2. 中国地震局地壳应力研究所, 地壳动力学重点实验室, 北京 100085
2. Key Laboratory of Crustal Dynamics, Institute of Crustal Dynamics, China Earthquake Administration, Beijing 100085, China
始于~45 Ma前的印度板块与欧亚板块的碰撞导致了新特提斯洋的闭合及青藏高原的广泛隆升和地壳物质向东“逃逸”运动(Molnar and Tapponnier, 1975;Tapponnier and Molnar, 1977;Avouac and Tapponnier, 1993;Meyer et al., 1998).青藏高原物质在向东“逃逸”过程中,由于受到鄂尔多斯块体和四川盆地等高强度块体的阻挡,在其东缘形成了局部挤压推覆构造带及其前陆盆地系统(《中国岩石圈动力学地图集》编委会,1991;Xu and Deng, 1996;邓起东等,1994;邓启东,2007;徐锡伟等,2003).位于青藏高原东部边界NE走向的龙门山推覆构造带始于侏罗纪(Hubbard and Shaw, 2009),它在新生代晚期的推覆构造运动导致了该区典型的构造环境和显著的地形高差,区内逆-走滑断层发育,构造区两侧的地形起伏高差达到了5 km以上(Zhang et al., 2004).龙门山推覆构造带不仅是四川盆地与青藏高原的地形和构造分界带,而且是研究青藏高原地壳厚度变化的关键部位(Derode et al., 2003;Wapenaar et al., 2004;Shapiro et al., 2005),具有发生大地震和特大地震的构造环境(邓起东等,1994;赵小麟等,1994;杨晓平等,1999).
2008年5月12日在龙门山推覆构造带中-北段发生了汶川8.0级大地震,2013年4月20日又在该构造带上的南段发生了四川芦山7.0级地震,两次地震的震中相距约90 km.其中,汶川地震因其独特的发震构造环境及造成重大的人员和财产损失,在国内外引起极大的关注.地质地表调查研究表明(徐锡伟等, 2008, 2010;Xu et al., 2009a, b;Lin et al., 2012),汶川MW7.9地震产生的地表实测最大同震垂直位移达6.5±0.5 m,在龙门山推覆构造带上造成了约300 km的地表破裂(图 1).震后,地球物理学家对汶川地震的孕震机制(刘超等,2008;USGS,2008;朱艾斓等,2008;张勇等,2009;Zhao et al., 2011;易桂喜等,2012)、震源位置参数(中国地震局,2008;USGS,2008;杨智娴等, 2008, 2012;陈九辉等,2009;马文涛等,2011;张新东等,2013)及其破裂过程(王卫民等,2008;张勇等,2008;杜海林等,2009;Xu Y et al., 2009;Huang et al., 2012)进行了研究,对本次地震的震源机制及震源破裂过程有了很好的认识,但是在发震构造模型上存在一定的争议.

|
图 1 汶川震区地形地貌、震中分布及紫坪铺台网台站分布图 红色线段为汶川地震造成的地表破裂分布(Xu et al., 2009b),红色五角星为本文的起始破裂点的位置,黄色小圆点表示余震分布,黑色三角表示台站位置. Fig. 1 Simplified topographical map and distribution of historical earthquake of the Wenchuan earthquake region and the stations distribution of the Zipingpu reservoir array The red star denotes the initial rupture position of this paper and the red line denotes the surface rupture (Xu et al., 2009b). Yellow circles are the aftershocks and the black triangles represent stations position. |
对于汶川地震而言,当前存在两个主流的发震构造模型:张培震等(2008, 2012)和Feng等(2016)认为汶川地震发震断层为高角度(>50°)铲型逆冲断层,汶川地震的孕育和发生可以用多单元组合模型来理解;Xu等(2009b)和Hubbard等(2010)则认为汶川地震发震断层为相对缓倾角(~35°)叠瓦状逆冲断层,地震的发生主要是由于地壳缩短引起.震中区域地表破裂的考察显示(徐锡伟等,2008),北川—映秀断裂近地表断层倾角较陡(~75°),汶川地震断层科学钻探显示地下500~1500 m断层面倾角~65°(Li et al., 2013;张伟等,2012).因此,无论汶川地震的发震构造模型属于哪一种,其发震断层倾角均小于地表断层倾角.龙门山推覆构造中-南段内部断层的几何特征整体上呈现为上陡下缓“叠瓦状”构造(Dong et al., 2008;徐锡伟等,2008;朱艾斓等,2008;Xu et al., 2009a;Yu et al., 2010;Jia et al., 2010;Zhao et al., 2011),起始破裂的深度位置会对地震发震构造模型的确定产生直接的影响.当前讨论的汶川地震发震构造模型基于汶川地震震源深度位于~15 km(图 2)的基础上进行的,然而利用了近距离台阵记录的波形资料获得的震源深度结果浅于10 km(马文涛等,2011;张新东等,2013;Gong et al., 2019),这对地震发震构造模型又有何影响?本文收集了紫坪铺水库台网记录的汶川地震主震波形数据,使用P波反投影叠加方法得到汶川地震的起始破裂过程,在确定起始破裂位置参数的同时约束了其发震断层的几何特征.

|
图 2 已发表汶川地震震源位置参数三维空间分布图 Fig. 2 Three-dimensional distribution of the epicenter location of Wenchuan earthquake determined by the published document |
紫坪铺水库台网始建于2004年8月16日,由7个台间距约10 km的高频短周期地震仪组成,主要用于监测紫坪铺周边地区的水库地震(图 3).7个地震台站分别为灵岩寺(LYS)、钻洞子(ZDZ)、白岩(BAY)、八角(BAJ)、桂花树(GHS)、桃子坪(TZP)、庙子坪(YZP),均使用港震EDAS-24L数据采集器和摩托罗拉M12型GPS授时系统,波形记录采样率为100 Hz.

|
图 3 紫坪铺水库区域、台站及不同研究机构得到的汶川地震震中分布图 Fig. 3 The Zipingpu reservoir region, seismic stations used and the main shock determined by different research institutions |
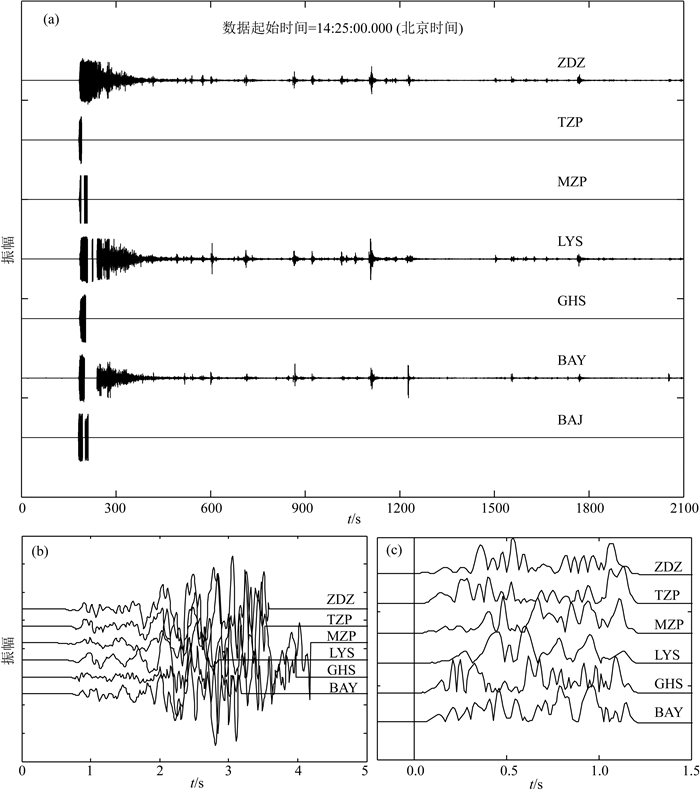
虽然,紫坪铺水库台网记录的汶川主震波形资料在S波到达后都出现了限幅现象(图 4a),但是限幅前的波形记录清晰且具有较高的相似性(图 4b),可以满足本次地震的起始破裂位置参数的研究工作.本文利用限幅前的P波波形数据(图 4c),采用P波反投影波形叠加方法对汶川地震起始破裂过程进行了研究.由于BAJ台站记录资料限幅前的波形资料不足1 s且其振幅也大于其余6个台站,因此未使用该台站资料.

|
图 4 紫坪铺水库台网记录到的汶川MW7.9地震波形数据 (a)紫坪铺台网垂直分量记录的汶川地震主震原始波形数据,信号的开始时间为2008年5月12日14时25分00秒(北京时);(b)为从(a)中剪切出来的未限幅波形数据,并将振幅进行归一化处理后按照P波初动对齐的波形记录图;(c)为从(b)中截取的P波初动前0.1 s至后1.2 s的绝对值波形,并对其进行振幅归一化和10%的余弦滤波处理后按P波初动到时排列的图像. Fig. 4 Datasets of the MW7.9 Wenchuan earthquake recorded by the Zipingpu reservoir array (a) Raw vertical components waveform of the Wenchuan earthquake and the seismograms time of 0 s is 14:25:00 on May 12, 2008 (China Standard Time (BJT)=Universal Time+8 hours); (b) Waveform are cut from the raw datasets (a) before the amplitude clipped and aligned by the first P wave arrival after amplitude normalization; (c) The absolute value of the segmented waveform (0.1 s before the first P arrivals and 1.2 s after the arrivals) which are cut from (b) with a 10% cosine function tapered on each end and are normalized individually. |
反投影波形叠加法研究震源起始破裂过程是基于波形相关性方法(Ishii et al., 2007;Huang et al., 2008;Xu Y et al., 2009).该方法大致可分为如下几个步骤.首先,考虑一个四维空间(即经度、纬度、深度、时间)围绕在震源位置和破裂时段,将震源区在经、纬度和深度上进行网格化,同时将所需研究的时间段进行等间隔离散;接着,在每个离散的时间节点上,利用理论速度模型计算出P波从每个网格点传播到各个台站的理论到时;之后,以理论到时为中心在所有台站的波形记录上截取一定长度的波形数据并利用4th-Root方法(McFadden et al., 1986)叠加起来;最后,将叠加得到的最大振幅值近似为破裂释放的能量反投影到该网格节点.对于第j个潜在的震源点,其叠加过程可用公式(1)来表示(McFadden et al., 1986; Ishii et al., 2007; Zhang et al., 2010):

|
(1) |
其中,uk(t)和tjk表示第k个台站记录到的波形事件和该台站的理论P波到时;Δtk和Ak表示使用波形互相关方法得到的波形走时偏移和每个台站记录的最大振幅;N表示使用的台站总数.利用波形的绝对值振幅进行叠加可避免地震记录的极性反转现象.如此,在整个研究的时间序列中每个离散的时间点都可以得到一个震源区的能量分布图像,且拥有能量值越大的网格节点越接近于真实的破裂点位置.
龙门山断裂带作为青藏高原东缘与四川盆地的地形和构造分界带,以西为松潘—甘孜褶皱系, 以东为扬子地台.断裂带东西两侧地质构造(邓起东等,1994;陈光国等,2007)和地壳平均速度结构(赵珠等,1997;黄媛等,2008;雷建设等,2009;Li et al., 2009;宫猛等,2010)等均存在明显差异.综合考虑汶川地震震中位置(陈九辉等,2009;马文涛等,2011;杨智娴等,2012;张新东等,2013)、台站分布(图 3),分别利用上述文献中的速度模型,采用P波反投影方法计算了起始破裂点的位置参数,并最终选取计算结果误差最小的速度模型(杨智娴等,2012)用于研究汶川大地震的起始破裂过程.
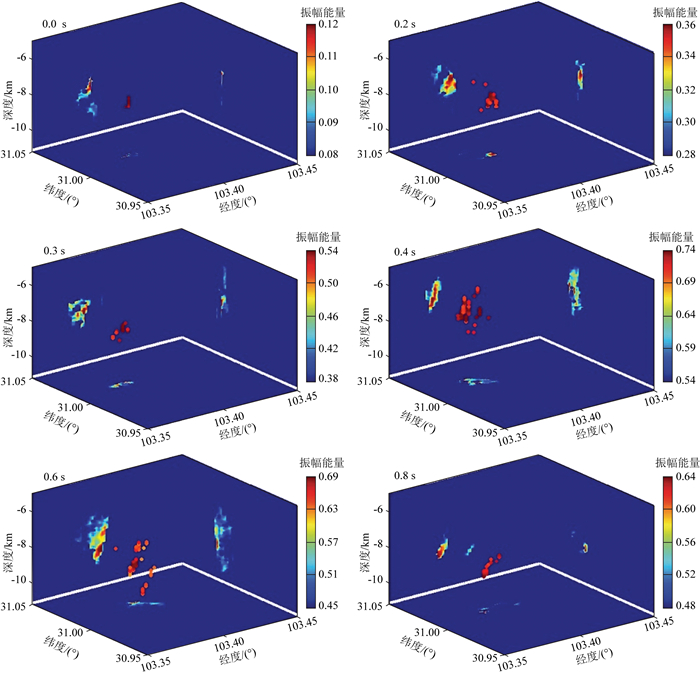
汶川地震的破裂速度约3 km·s-1(王卫民等,2008;杜海林等,2009;Huang et al., 2012),为了能得到0.1 s时间间隔的演化图像,则网格划分需要小于0.003°.另外,数据资料的采样率为100 Hz,其时间分辨率可达到0.01 s,假设P波的传播速度为6 km·s-1,则理论上位置迁移分辨率可达到0.06 km.因此,本文将震源区经纬度方向按照0.002°,深度方向上从5~20 km按照0.1 km等间隔进行划分,时间上从震后0 s至震后1 s进行0.1 s的等间隔离散.接着,在离散的每一个时间点上,利用1D速度模型(表 1)计算所有潜在震源点到各台站的理论P波到时,再从所有台站记录中截取P波理论到时前0.1 s和后0.2 s的波形数据,利用公式(1)叠加起来.最后,将叠加后波形振幅的最大值近似为破裂能量反传回所有的潜在震源点.如此,便可得到汶川地震在震后0~1 s时间内破裂的时空演化图像(图 5).
|
|
表 1 本文采用的P波速度模型(源自:杨智娴等,2012) Table 1 The P-wave velocity model used in this study (revised from Yang et al., 2012) |

|
图 5 汶川地震起始破裂阶段(0~1 s)的时空演化图像 圆点表示拥有能量高于反传回该时刻能量最大75%的网格节点,三个平面上的图像为破裂能量在各自对应平面的投影. Fig. 5 Spatial and temporal images of the initial rupture process (0~1 s) of the Wenchuan earthquake The colored circles represent the grid notes which the radiated seismic energy is greater than 75% of the peak value and the images of the three planes represent the projection of the rupture energy, respectively. |
大地震发生时,起始破裂往往发生在某一个固定断层上,并造成发震断层面两侧块体的相对运动.假设在起始破裂阶段,所有的破裂都发生在同一个断层面上且破裂的能量沿着发震断层面传播,则不同时刻的破裂点在震源区范围内三维空间的位置也应该分布在这个断层面上.那么,如果我们得到不同时刻的破裂点在三维空间的位置,就可以反过来利用这些破裂点在震源区的空间分布特征来构建发生破裂的断层面几何形态.在获取了汶川地震潜在震源点在起始破裂阶段(0~1 s)的时空演化图像(图 5)后,我们尝试利用这些破裂点在三维空间的分布来约束起始破裂断层面的几何特征,其详细的方法及步骤如下.
假定每个时刻只有一个破裂点,将该破裂点的位置设为该时刻75%以上能量点分布的平均值,如此在起始破裂后的0~1 s范围内可以得到10个破裂点位置参数(表 2).
|
|
表 2 汶川地震起始破裂阶段破裂点的位置参数 Table 2 The location parameters of the initial rupture points of Wenchuan earthquake |
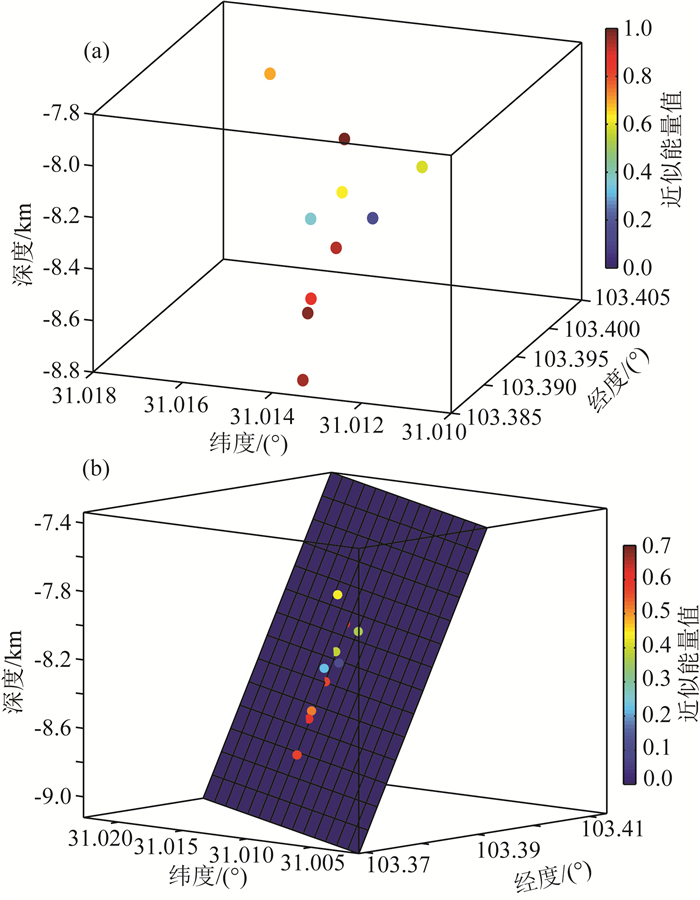
将这些点绘制在震源区的三维空间(图 6a)上发现,在起始破裂阶段(0~1 s)破裂点分布在不同的深度上,且各时刻释放的能量各不相同,但整体来看这些点在三维空间内分布在一个NW走向的平面上.本文采用单一平面断层进行拟合,以起始破裂0 s时刻的位置参数(31.013°N、103.392°E,深度8.2 km)为中心,在一定的倾角和走向范围内构建一系列不同走向和倾角的断层面.根据汶川地震震源区附近龙门山推覆构造带内部断层的几何特征(邓起东等,1994;徐锡伟等,2008;Xu et al., 2009b)及主震震源机制解结果(刘超等,2008;USGS,2008;张勇等,2009;易桂喜等,2012),在进行最佳发震断层面搜索过程中,将倾角和走向范围分别限定在29°~50°和40°~60°,将搜索步长设为1°.然后,将起始破裂阶段10个破裂点的位置参数及能量值垂直投影到构建的断层面上,并计算投影在该断层面上的破裂点的能量总和,则拥有能量值最大的断层面即为最佳的断层面.

|
图 6 起始破裂阶段(0~1 s)破裂点位置(a)及发震断层面(b)的空间分布图 蓝色平面为发震断层面,带颜色的小圆点为各个不同时刻的破裂点位置,颜色代表能量大小. Fig. 6 Spatial distributions of rupture points (a) and the seismogenic fault (b) of Wenchuan earthquake in the initial stage (0~1 s) The blue plane represents the seismogenic fault, the colored circles represent the locations of the rupture points and the color represents the seismic energy. |
依照此方法,最终得到的最佳断层面的走向为NW48°,倾角为35°.将起始破裂阶段破裂点的位置及得到的最佳断层一同绘制到震源区的三维空间图上(图 6b),我们发现该断层面能很好地拟合破裂点的分布位置,几乎所有的破裂点都分布或者接近分布在该断层面上.
2 结果分析与讨论我们使用Boot-strap(Efron and Gong, 1983)方法评价速度结构对定位结果的影响.首先,将表 1的速度模型设置为初始速度模型;然后,在±5%范围内随机产生100个扰动参数;之后,从这100个参数中随机抽取6个参数并将其叠加到初始速度模型;接着,使用叠加了速度扰动的新模型对地震起始破裂位置参数进行重定位;最后,重复以上过程20次便可得到20个重定位破裂参数结果,将这20次定位结果的标准偏差作为计算结果的误差.结果表明,定位结果纬度误差为±0.002°,经度误差为±0.002°,深度方向误差为±0.41 km.将主震后0 s的位置参数作为起始破裂位置,则汶川地震起始破裂位置为31.013±0.0015°N、103.392±0.0015°E,震源深度为8.2±0.4 km,发震时刻2008年5月12日14:27:58.80±0.4.本文定位结果与马文涛等(2011) 和张新东等(2013)研究结果相符.另外,在汶川地震发生前震源区附近的水磨镇发生了一群小震,其中一个深度为7.8 km的ML1.5地震的P波到时差与汶川主震的P波到时差基本一致(马文涛等,2011),这说明汶川地震震中应位于10 km以上.
已有研究表明(中国地震局,2008;USGS,2008;胡辛平等2008;陈九辉等,2009;马文涛等,2011;杨智娴等,2012;张新东等,2013),汶川地震的震源参数在深度及发震时间上存在较大差异.例如,震源深度在6~20 km分布,而发震时刻在14:27:57 s至14:28:04 s之间.从这些研究结果来看,使用远距离台站(区域台网记录及全球台网)资料定位的汶川地震震中位于12 km以下(USGS,2008;中国地震局,2008;胡辛平等2008;陈九辉等,2009);而使用7个紫坪铺水库近距离台站记录资料定位得到的汶川地震起始破裂位于10 km以上(马文涛等,2011;张新东等,2013).杨智娴等(2012)联合使用了区域台网和4个紫坪铺近距离台站资料,得到汶川地震震源深度为15 km,但是发震时间却比其余在该深度附近的重定位结果(USGS,2008;中国地震局,2008;胡幸平等,2008;陈九辉等,2009)早了接近2 s,这可能是震源深度与发震时刻的折衷效应在地震定位中的体现.在地震定位研究中,由于震源深度与发震时刻之间存在折衷效应,当台间距远大于地震的震源深度时,由于地震波走时数据对深度的变化不敏感,使得震源深度得不到有效的约束,便会造成反演得到震源深度与发震时刻具有较大的不确定性(Bormann, 2002);另外,由于震源破裂过程的复杂性,在使用不同的波形资料或不同的特征频率进行定位时,会得到具有不同物理意义的震源深度(高原等,1997).汶川主震定位误差除源于记录资料类型的不同和震相识别的差异外,龙门山断裂带地壳速度结构的横向不均匀性也是造成结果差异的一个重要原因.利用远距离台站记录资料进行定位时,由于震中距大,震中至台站位置下方的地壳速度结构差异较大,在采用一维平均速度模型进行重新位时,必然会造成较大地震波走时误差,进而影响震源位置精度.与远距离台网资料相比,近距离的台网记录可对震源深度和发震时刻进行有效的约束,且由于震中距较近,地壳速度结构差异相对较小,也能进一步减小速度模型带来的误差,能得到更为准确的结果.
当前,汶川地震存在两个主流的发震构造模型:张培震等(2009, 2012)和Feng等(2016)认为汶川地震发震断层为高角度(>50°)铲型逆冲断层;Xu等(2009b)、Hubbard等(2010)及Yu等(2010)则认为汶川地震发震断层为相对缓倾角(~35°)叠瓦状逆冲断层.研究表明(Bilham et al., 2001;Avouac and Tapponnier, 2003),世界上绝大多数8级以上逆冲型强震发生在海洋板块边界的俯冲带上及大陆碰撞的低倾角(< 20°)逆冲推覆断裂带上.然而,2008年5月12汶川MW7.9大地震与以往发生在大陆内部逆冲型8级以上强震有所不同,它是发生在高角度逆冲(30°~60°)断裂之上(张培震等,2009;Xu et al., 2009b;张勇等,2009),这种差异引起了大量学者高度关注.
龙门山推覆构造带中-南段内部断裂整体呈现为上陡下缓“铲式”的几何结构特征(邓起东等,1994;徐锡伟等,2008;Xu et al., 2009b),汶川地震主震位于映秀—北川断裂,震中地表破裂断层倾角达~75°(徐锡伟等,2008;Xu et al., 2009b),汶川地震断层科学钻探(张伟等,2012;Li et al., 2013)指出地下500~1500 m断层面倾角~65°.然而,张勇等(2009)得到的震源机制解认为汶川地震发震断层面的参数为走向230°,倾角39°,滑动角120°;刘超等(2008)利用矩张量反演方法得到汶川地震机制解参数节面I走向为220°,倾角32°;美国地质调查局(USGS)研究表明,汶川地震发震断面走向222°,倾角29°;全球矩心矩张量(GCMT)研究组认为汶川地震发震断层走向为229°,倾角为33°.这些研究表明,汶川8.0级地震破裂面的相对低倾角(29°~40°),与高角度(60°~70°)的地表破裂面明显不同.这种差异可能与震中附近断层的几何形态密切相关.易桂喜等(2012)利用汶川地震余震序列震源机制的结果显示汶川余震区南段的几何结构具有下缓上陡的特征.Jia等(2010)利用横跨龙门山推覆构造带的石油勘探地震反射资料发现,在汶川地震发震断裂的西南部,映秀—北川断裂和灌县—安县断裂两条断裂以不同的倾角向深部延伸(前者陡, 后者缓)并在地下约8~10 km处汇合, 合并后断裂继续向下延伸可能达到18~20 km深处的主滑脱带.由此推断,汶川地震破裂面的倾角可能由地表向深部变缓,在起始破裂位置断层倾角减缓到30°~40°.
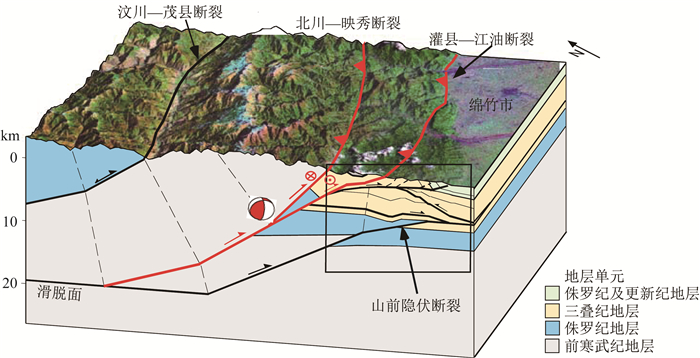
本文得到的汶川地震起始破裂位于地下约8 km的深度,破裂断层面的走向为48°、倾角为35°,与Xu等(2009b)、Hubbard等(2010)及Yu等(2010)认为汶川地震发震断层为相对缓倾角(~35°)相符,也与震源机制解参数节面I倾角(刘超等,2008;USGS,2008;张勇等,2009)基本一致.根据龙门山和四川盆地地区的石油勘探资料及地震剖面(罗志立,1998;贾东等,2003;贾秋鹏等,2007;Jia et al., 2010),结合地表破裂带展布和地表地质资料(宋鸿彪,1994;宋鸿彪和罗志立,1995;Dong et al., 2008;徐锡伟等,2008;Xu et al., 2009a, b;Yu et al., 2010),并考虑汶川地震起始破裂深度范围及求解的最佳发震断层面的几何形态,推断汶川地震起始破裂断层的几何结构示意图(图 7),认为汶川地震起始破裂可能位于映秀—北川断裂和灌县—安县断裂交汇处的断层面(倾角约35°).

|
图 7 汶川MW7.9地震三维发震构造模型(据Xu et al., 2009b修改) Fig. 7 Three-dimensional seismogenic structure model of the Wenchuan MW7.9 earthquake (revised from Xu et al., 2009b) |
综上所述,本文利用紫坪铺水库台网资料,采用P波反投影叠加法得到2008年5月12日汶川MW7.9地震起始破裂的深度范围为地下7.5~9 km,起始破裂断层面的倾向为NW35°,走向为NE48°.结合震源区断层几何形态分析认为,起始破裂位于映秀—北川断裂和灌县—安县断裂在地下约8 km交汇处的断层面上.
致谢 四川省地震局为本研究提供了数据资料,美国罗德岛大学沈旸教授及中国地震局地质研究所闻学泽研究员和马文涛副研究员对本文提出了宝贵的意见和建议,在此一并表示感谢.
Avouac J P, Tapponnier P. 1993. Kinematic model of active deformation in Central Asia. Geophysical Research Letters, 20(10): 895-898. DOI:10.1029/93GL00128 |
Bilham R, Gaur V K, Molnar P. 2001. Himalayan seismic hazard. Science, 293(5534): 1442-1444. DOI:10.1126/science.1062584 |
Bormann P. 2002. New manual of Seismological Observatory Practice. Vol. 1 and 2. Potsdam: Geo Forschungs Zentrum Potsdam, 1-1003.
|
Chen G G, Ji F J, Zhou R J, et al. 2007. Primary research of activity segmentation of Longmenshan fault zone since late-Quaternary. Seismology and Geology (in Chinese), 29(3): 657-673. |
Chen J H, Liu Q Y, Li S C, et al. 2009. Seismotectonic study by relocation of the Wenchuan MS8.0 earthquake sequence. Chinese Journal of Geophysics (in Chinese), 52(2): 390-397. DOI:10.1002/cjg2.1359 |
China Earthquake Administration. 2008. The epicenter location of 2008 MS8.0 Wenchuan earthquake. https://www.cea.gov.cn/eportal/ui?pageId=366509¤tPage=597.
|
Deng Q D, Chen S F, Zhao X L. 1994. Tectonics, seismicity and dynamics of Longmenshan Mountains and its adjacent regions. Seismology and Geology (in Chinese), 16(4): 389-403. |
Deng Q D. 2007. Map of Active Tectonics in China (in Chinese). Beijing: Seismological Press.
|
Derode A, Larose E, Tanter M, et al. 2003. Recovering the Green's function from field-field correlations in an open scattering medium (L). The Journal of the Acoustical Society of America, 113(6): 2973-2976. DOI:10.1121/1.1570436 |
Dong S W, Zhang Y Q, Wu Z H, et al. 2008. Surface rupture and co-seismic displacement produced by the MS8.0 Wenchuan earthquake of May 12th, 2008, Sichuan, China:Eastwards growth of the Qinghai-Tibet plateau. Acta Geologica Sinica, 82(5): 938-948. |
Du H L, Xu L S, Chen Y T. 2009. Rupture process of the 2008 great Wenchuan earthquake from the analysis of the Alaska-array data, China. Chinese Journal of Geophysics (in Chinese), 52(2): 389-403. |
Editorial Board of Atlas of Lithospheric Dynamics of China. 1991. An Overview of Lithosphere Dynamics in China (in Chinese). Beijing: Seismological Press.
|
Efron B, Gong G. 1983. A leisurely look at the Bootstrap, the Jackknife, and cross-validation. The American Statistician, 37(1): 36-48. |
Feng S Y, Zhang P Z, Liu B J, et al. 2016. Deep crustal deformation of the Longmen Shan, eastern margin of the Tibetan Plateau, from seismic reflection and finite element modeling. Journal of Geophysical Research:Solid Earth, 121(2): 767-787. DOI:10.1002/2015JB012352 |
Gao Y, Zhou H L, Zheng S H, et al. 1997. Preliminary discussion on implication of determination on source depth of earthquake. Earthquake Research in China (in Chinese), 13(4): 321-329. |
Gong M, Li H Y, Xu X M, et al. 2010. Surface wave group velocity distribution based on ambient noise analysis in eastern Tibet. Earth Science Frontiers (in Chinese), 17(3): 151-162. |
Gong M, Xu X W, Yang S, et al. 2019. Initial rupture processes of the 2008 MW7.9 Wenchuan, China earthquake:From near-source seismic records. Journal of Asian Earth Sciences, 173: 397-403. DOI:10.1016/j.jseaes.2019.01.040 |
Hu X P, Yu C Q, Tao K, et al. 2008. Focal mechanism solutions of Wenchuan earthquake and its strong aftershocks obtained from initial P wave polarity analysis. Chinese Journal of Geophysics (in Chinese), 51(6): 1711-1718. |
Huang B S, Huang Y L, Lee S J, et al. 2008. Initial rupture processes of the 2006 Pingtung earthquake from near source strong-motion records. Terrestrial Atmospheric and Oceanic Sciences, 19(6): 547-554. DOI:10.3319/TAO.2008.19.6.547(PT) |
Huang B S, Chen J H, Liu Q Y, et al. 2012. Estimation of rupture processes of the 2008 Wenchuan Earthquake from joint analyses of two regional seismic arrays. Tectonophysics, 578: 87-97. DOI:10.1016/j.tecto.2011.12.026 |
Huang Y, Wu J P, Zhang T Z, et al. 2008. The relocation of Wenchuan MS8.0 earthquake and its aftershock sequence. Science in China (Ser. D) (in Chinese), 38(10): 1242-1249. |
Hubbard J, Shaw J H. 2009. Uplift of the Longmen Shan and Tibetan Plateau, and the 2008 Wenchuan (M=7.9) earthquake. Nature, 458(7235): 194-197. DOI:10.1038/nature07837 |
Hubbard J, Shaw J H, Klinger Y. 2010. Structural setting of the 2008 MW7.9 Wenchuan, China, Earthquake. Bulletin of the Seismological Society of America, 100(5B): 2713-2735. DOI:10.1785/0120090341 |
Ishii M, Shearer P M, Houston H, et al. 2007. Teleseismic P wave imaging of the 26 December 2004 Sumatra-Andaman and 28 March 2005 Sumatra earthquake ruptures using the Hi-net array. Journal of Geophysical Research:Solid Earth, 112(B11): B11307. DOI:10.1029/2006JB004700 |
Jia D, Li Y Q, Lin A M, et al. 2010. Structural model of 2008 MW7.9 Wenchuan earthquake in the rejuvenated Longmen Shan thrust belt, China. Tectonophysics, 491(1-4): 174-184. DOI:10.1016/j.tecto.2009.08.040 |
Jia D, Chen Z X, Jia C Z, et al. 2003. Structural features of the Longmen Shan fold and thrust belt and development of the western Sichuan foreland basin, central China. Geological Journal of China Universities (in Chinese), 9(3): 402-409. |
Jia Q P, Jia D, Zhu A L, et al. 2007. Active tectonics in the Longmen thrust belt to the eastern Qinghai-Tibetan plateau and Sichuan basin:evidence from topography and seismicity. Chinese Journal of Geology (in Chinese), 42(1): 31-44. |
Lei J S, Zhao D P, Su J R, et al. 2009. Fine seismic structure under the Longmenshan Fault zone and the mechanism of the large Wenchuan earthquake. Chinese Journal of Geophysics (in Chinese), 52(2): 339-345. |
Li H B, Wang H, Xu Z Q, et al. 2013. Characteristics of the fault-related rocks, fault zones and the principal slip zone in the Wenchuan Earthquake Fault Scientific Drilling Project Hole-1 (WFSD-1). Tectonophysics, 584: 23-42. DOI:10.1016/j.tecto.2012.08.021 |
Li H Y, Wei S, Wang C Y, et al. 2009. Ambient noise Rayleigh wave tomography in western Sichuan and eastern Tibet. Earth and Planetary Science Letters, 282(1-4): 201-311. DOI:10.1016/j.epsl.2009.03.021 |
Lin A M, Rao G, Yan B. 2012. Field evidence of rupture of the Qingchuan Fault during the 2008 MW7.9 Wenchuan earthquake, northeastern segment of the Longmen Shan thrust belt, China. Tectonophysics, 522-523: 243-252. DOI:10.1016/j.tecto.2011.12.012 |
Liu C, Zhang Y, Xu L S, et al. 2008. A new technique for moment tensor inversion with applications to the 2008 Wenchuan MS8.0 earthquake sequence. Acta Seismologica Sinica (in Chinese), 30(4): 329-339. |
Luo Z L. 1998. New recognition of basement in Sichuan basin. Journal of Chengdu University of Technology (in Chinese), 25(2): 191-200. |
Ma W T, Xu C P, Zhang X D, et al. 2011. Study on the relationship between the reservoir-induced seismicity at Zipingpu reservoir and the MS8.0 Wenchuan earthquake. Seismology and Geology (in Chinese), 33(1): 175-190. |
McFadden P L, Drummond B J, Kravis S. 1986. The Nth-root stack:Theory, applications, and examples. Geophysics, 51(10): 1879-1892. DOI:10.1190/1.1442045 |
Meyer B, Tapponnier P, Bourjot L, et al. 1998. Crustal thickening in Gansu-Qinghai, lithospheric mantle subduction, and oblique, strike-slip controlled growth of the Tibet plateau. Geophysical Journal International, 135(1): 1-47. DOI:10.1046/j.1365-246X.1998.00567.x |
Molnar P, Tapponnier P. 1975. Cenozoic tectonics of Asia:effects of a continental collision:features of recent continental tectonics in Asia can be interpreted as results of the India-Eurasia collision. Science, 189(4201): 419-426. DOI:10.1126/science.189.4201.419 |
Shapiro N M, Campillo M, Stehly L, et al. 2005. High-resolution surface-wave tomography from ambient seismic noise. Science, 307(5715): 1615-1618. DOI:10.1126/science.1108339 |
Song H B. 1994. The comprehensive interpretation of geological and geophysical data in the orogenic belt of Longmen Mountains, China. Journal of Chengdu University of Technology (in Chinese), 21(2): 79-88. |
Song H B, Luo Z L. 1995. The study of the basement and deep geological structures of Sichuan basin, China. Earth Science Frontiers (in Chinese), 2(4): 231-237. |
Tapponnier P, Molnar P. 1977. Active faulting and tectonics in China. Journal of Geophysics Research, 82(20): 2905-2930. DOI:10.1029/JB082i020p02905 |
USGS. 2008. U.S. Earthquake hazards program, MW7.9-eastern Sichuan, China 2008-05-12 06: 28: 01UTC. https://earthquake.usgs.gov/earthquakes/eventpage/usp000g650executive.
|
Wapenaar K, Thorbecke J, Draganov D. 2004. Relations between reflection and transmission responses of three-dimensional in homogeneous media. Geophysical Journal International, 156(2): 179-194. DOI:10.1111/j.1365-246X.2003.02152.x |
Wang W M, Zhao L F, Li J, et al. 2008. Rupture process of the MS8.0 Wenchuan earthquake of Sichuan, China. Chinese Journal of Geophysics (in Chinese), 51(5): 1403-1410. |
Xu X W, Deng Q D. 1996. Nonlinear characteristics of paleoseismicity in China. Journal of Geophysical Research, 101(B3): 6209-6231. DOI:10.1029/95JB01238 |
Xu X W, Yu G H, Ma W T, et al. 2003. Model of latest crustal tectonic motion of the central tectonic zone on the mainland of China. Earth Science Frontiers (in Chinese), 10(S1): 160-167. |
Xu X W, Wen X Z, Ye J Q, et al. 2008. The MS8.0 Wenchuan earthquake surface ruptures and its seismogenic structure. Seismology and Geology (in Chinese), 30(3): 597-629. |
Xu X W, Yu G H, Chen G H, et al. 2009a. Parameters of coseismic reverse-and oblique-slip surface ruptures of the 2008 Wenchuan Earthquake, Eastern Tibetan Plateau. Acta Geologica Sinica, 83(4): 673-684. DOI:10.1111/j.1755-6724.2009.00091.x |
Xu X W, Wen X Z, Yu G H, et al. 2009b. Coseismic reverse-and oblique-slip surface faulting generated by the 2008 MW7.9 Wenchuan earthquake, China. Geology, 37(6): 515-518. DOI:10.1130/G25462A.1 |
Xu X W, Chen G H, Yu G H, et al. 2010. Reevaluation of surface rupture parameters of the 5·12 Wenchuan earthquake and its tectonic implication for Tibetan uplift. Chinese Journal of Geophysics (in Chinese), 53(10): 2321-2336. DOI:10.3969/j.issn.0001-5733.2010.10.006 |
Xu Y, Koper K D, Sufri O, et al. 2009. Rupture imaging of the MW7.9 12 May 2008 Wenchuan earthquake from back projection of teleseismic P waves. Geochemistry, Geophysics, Geosystems, 10(4): Q04006. DOI:10.1029/2008GC002335 |
Yang X P, Jiang P, Song F M, et al. 1999. The evidence of the south Longmenshan Fault zones cutting late Quaternary stratum. Seismology and Geology (in Chinese), 21(4): 341-345. |
Yang Z X, Chen Y T, Su J, et al. 2012. The hypocenter and origin time of the MW7.9 Wenchuan earthquake of May 12, 2008. Acta Seismologica Sinica (in Chinese), 34(2): 127-136. |
Yi G X, Long F, Zhang Z W. 2012. Spatial and temporal variation of focal mechanisms for aftershocks of the 2008 MS8.0 Wenchuan earthquake. Chinese Journal of Geophysics (in Chinese), 55(4): 1213-1227. DOI:10.6038/j.issn.0001-5733.2012.04.017 |
Yu G, Xu X, Klinger Y, et al. 2010. Fault-scarp features and cascading-rupture model for the MW7.9 Wenchuan earthquake, eastern Tibetan plateau, China. Bulletin of the Seismological Society of America, 100(5B): 2590-2614. DOI:10.1785/0120090255 |
Zhang H, Ge Z. 2010. Tracking the rupture of the 2008 Wenchuan earthquake by using the relative back-projection method. Bulletin of the Seismological Society of America, 100(B): 2551-2560. |
Zhang P Z, Shen Z K, Wang M, et al. 2004. Continuous deformation of the Tibetan Plateau from global positioning system data. Geology, 32(9): 809-812. DOI:10.1130/G20554.1 |
Zhang P Z, Wen X Z, Xu X W, et al. 2009. Tectonic model of the great Wenchuan earthquake of May 12, 2008, Sichuan, China. Chin. Sci. Bull. (in Chinese), 54(7): 944-953. DOI:10.1360/csb2009-54-7-944 |
Zhang P Z, Zhu S B, Zhang Z Q, et al. 2012. Seismogenic structure and rupture mechanism of the MS8.0 Wenchuan earthquake. Seismology and Geology (in Chinese), 34(4): 566-575. |
Zhang W, Li H B, Huang Y, et al. 2012. Lithologic characteristics and fault zone structure revealed by No.2 hole cores of the Wenchuan Earthquake Fault Zone Scientific Drilling (WFSD-2). Geological Bulletin of China (in Chinese), 31(8): 1201-1218. |
Zhang X D, Yan J G, Z X T, et al. 2013. The aftershock determination of hypocenter and origin time of the MW7.9 Wenchuan earthquake of May 12, 2008. Earthquake Research in China (in Chinese), 29(2): 230-235. |
Zhang Y, Xu L S, Chen Y T. 2009. Spatio-temporal variation of the source mechanism of the 2008 great Wenchuan earthquake. Chinese Journal of Geophysics (in Chinese), 52(2): 379-389. DOI:10.1002/cjg2.1358 |
Zhao B, Shi Y T, Gao Y. 2011. Relocation of aftershocks of the Wenchuan MS8.0 earthquake and its implication to seismotectonics. Earthquake Science, 24(1): 107-113. DOI:10.1007/s11589-011-0774-6 |
Zhao X L, Deng Q D, Chen S F. 1994. Study on tectonic geomorphology of middle section of opposite fault zone in Longmen Shan. Seismology and Geology (in Chinese), 16(4): 422-428. |
Zhao Z, Fan J, Zheng S H, et al. 1997. Precision determination of the crustal structure and hypocentral locations in the Longmenshan thrust napper belt. Acta Seismologica Sinica (in Chinese), 19(6): 615-622. |
Zhu A L, Xu X W, Diao G L, et al. 2008. Relocation of the MS8.0 Wenchuan earthquake sequence in Part:Preliminary seismotectonic analysis. Seismology and Geology (in Chinese), 30(3): 759-767. |
陈国光, 计凤桔, 周荣军, 等. 2007. 龙门山断裂带晚第四纪活动性分段的初步研究. 地震地质, 29(3): 657-673. DOI:10.3969/j.issn.0253-4967.2007.03.019 |
陈九辉, 刘启元, 李顺成, 等. 2009. 汶川MS8.0地震余震序列重新定位及其地震构造研究. 地球物理学报, 52(2): 390-397. |
邓起东, 陈社发, 赵小麟. 1994. 龙门山及其邻区的构造和地震活动及动力学. 地震地质, 16(4): 389-403. |
邓起东. 2007. 中国活动构造图. 北京: 地震出版社.
|
杜海林, 许力生, 陈运泰. 2009. 利用阿拉斯加台阵资料分析2008年汶川大地震的破裂过程. 地球物理学报, 52(2): 372-378. |
高原, 周蕙兰, 郑斯华, 等. 1997. 测定震源深度的意义的初步讨论. 中国地震, 13(4): 321-329. |
宫猛, 李红谊, 徐小明, 等. 2010. 青藏高原东部基于噪声的面波群速度分布特征. 地学前缘, 17(5): 151-162. |
胡幸平, 俞春泉, 陶开, 等. 2008. 利用P波初动资料求解汶川地震及其强余震震源机制解. 地球物理学报, 51(6): 1711-1718. DOI:10.3321/j.issn:0001-5733.2008.06.011 |
黄媛, 吴建平, 张天中, 等. 2008. 汶川8.0级大地震及其余震序列重定位研究. 中国科学D辑:地球科学, 38(10): 1242-1249. |
贾东, 陈竹新, 贾承造, 等. 2003. 龙门山前陆褶皱冲断带构造解析与川西前陆盆地的发育. 高校地质学报, 9(3): 402-409. DOI:10.3969/j.issn.1006-7493.2003.03.010 |
贾秋鹏, 贾东, 朱艾斓, 等. 2007. 青藏高原东缘龙门山冲断带与四川盆地的现今构造表现:数字地形和地震活动证据. 地质科学, 42(1): 31-44. DOI:10.3321/j.issn:0563-5020.2007.01.004 |
雷建设, 赵大鹏, 苏金蓉, 等. 2009. 龙门山断裂带地壳精细结构与汶川地震发震机理. 地球物理学报, 52(2): 339-345. |
刘超, 张勇, 许力生, 等. 2008. 一种矩张量反演新方法及其对2008年汶川MS8.0地震序列的应用. 地质学报, 30(4): 329-339. |
罗志立. 1998. 四川盆地基底结构的新认识. 成都理工学院学报, 25(2): 191-200. |
马文涛, 徐长朋, 张新东, 等. 2011. 紫坪铺水库与汶川地震关系的讨论. 地震地质, 33(1): 175-190. DOI:10.3969/j.issn.0253-4967.2011.01.017 |
宋鸿彪. 1994. 龙门山造山带地质和地球物理资料的综合解释. 成都理工学院学报, 21(2): 79-88. |
宋鸿彪, 罗志立. 1995. 四川盆地基底及深部地质结构研究的进展. 地学前缘, 2(4): 231-237. DOI:10.3321/j.issn:1005-2321.1995.04.015 |
王卫民, 赵连锋, 李娟, 等. 2008. 四川汶川8.0级地震震源过程. 地球物理学报, 51(5): 1403-1410. DOI:10.3321/j.issn:0001-5733.2008.05.013 |
徐锡伟, 于贵华, 马文涛, 等. 2003. 中国大陆中轴构造带地壳最新构造变动样式及其动力学内涵. 地学前缘, 10(S1): 160-167. |
徐锡伟, 闻学泽, 叶建青, 等. 2008. 汶川MS8.0地震地表破裂带及其发震构造. 地震地质, 30(3): 597-629. DOI:10.3969/j.issn.0253-4967.2008.03.003 |
徐锡伟, 陈桂华, 于贵华, 等. 2010. 5·12汶川地震地表破裂基本参数的再论证及其构造内涵分析. 地球物理学报, 53(10): 2321-2336. DOI:10.3969/j.issn.0001-5733.2010.10.006 |
杨晓平, 蒋溥, 宋方敏, 等. 1999. 龙门山断裂带南段错断晚更新世以来地层的证据. 地震地质, 21(4): 341-345. DOI:10.3969/j.issn.0253-4967.1999.04.007 |
杨智娴, 陈运泰, 苏金蓉, 等. 2012. 2008年5月12日汶川MW7.9地震的震源位置与发震时刻. 地震学报, 34(2): 127-136. DOI:10.3969/j.issn.0253-3782.2012.02.001 |
易桂喜, 龙锋, 张致伟. 2012. 汶川MS80地震余震震源机制时空分布特征. 地球物理学报, 55(4): 1213-1227. DOI:10.6038/j.issn.0001-5733.2012.04.017 |
《中国岩石圈动力学地图集》编委会. 1991. 中国岩石圈动力学概论. 北京: 地震出版社.
|
张培震, 闻学泽, 徐锡伟, 等. 2009. 2008年汶川8. 0级特大地震孕育和发生的多单元组合模式. 科学通报, 54(7): 944-953. |
张培震, 朱守彪, 张竹琪, 等. 2012. 汶川地震的发震构造与破裂机理. 地震地质, 34(4): 566-575. DOI:10.3969/j.issn.0253-4967.2012.04.003 |
张伟, 李海兵, 黄尧, 等. 2012. 四川汶川地震断裂带科学钻探2号孔(WFSD-2)岩性特征和断裂带的结构. 地质通报, 31(8): 1201-1218. DOI:10.3969/j.issn.1671-2552.2012.08.001 |
张新东, 闫俊岗, 张小涛, 等. 2013. 用余震确定2008年汶川MW7.9地震的震源位置与发震时刻. 中国地震, 29(2): 230-235. DOI:10.3969/j.issn.1001-4683.2013.02.005 |
张勇, 许力生, 陈运泰. 2009. 2008年汶川大地震震源机制的时空变化. 地球物理学报, 52(2): 379-389. |
赵小麟, 邓起东, 陈社发. 1994. 龙门山逆断裂带中段的构造地貌学研究. 地震地质, 16(4): 422-428. |
赵珠, 范军, 郑斯华, 等. 1997. 龙门山断裂带地壳速度结构和震源位置的精确修定. 地震学报, 19(6): 615-622. |
中国地震局. 2008. 2008年汶川MS8.0级地震震中位置参数. https://www.cea.gov.cn/eportal/ui?pageId=366509¤tPage=597.
|
朱艾斓, 徐锡伟, 刁桂苓, 等. 2008. 汶川MS8.0地震部分余震重新定位及地震构造初步分析. 地震地质, 30(3): 759-767. DOI:10.3969/j.issn.0253-4967.2008.03.014 |
 2020, Vol. 63


