2. 中国科学技术大学地球和空间科学学院, 合肥 230026;
3. 美国佐治亚理工学院地球与大气科学学院, 佐治亚州 亚特兰大 30332-0340;
4. 中国地震局地球物理勘探中心, 郑州 450003
2. School of Earth and Space Sciences, University of Science and Technology of China, Hefei 230026, China;
3. School of Earth and Atmospheric Sciences, Georgia Institute of Technology, Atlanta, GA, 30332-0340, USA;
4. Geophysical Exploration Center, China Earthquake Administration, Zhengzhou 450003, China
不同板块或块体边界在区域构造或局部应力作用下,常常会发育一个条带状的断裂带,一般表现为岩性复杂、裂隙发育、岩石破碎、地震波速度低等特征(Chester et al., 1993; Evans and Chester, 1995; Ben-Zion and Sammis, 2003; Li et al., 2013),波速较低的断裂带与周围的块体形成一个典型的低速区(Sagy and Brodsky, 2009; Sutherland et al., 2012; Ujiie et al., 2013).此外,断裂带两侧岩石特性不同,形成显著的速度间断面.低速区和间断面的存在会影响该区域的应力积累和释放、地震的孕育和发生过程,以及放大地面运动等(Yang, 2015).对以走滑为主的断裂带,低速区和间断面还会影响发生在该断裂带上地震的破裂方向(Ben-Zion, 2001; Shi and Ben-Zion, 2006; Ampuero and Ben-Zion, 2008).研究断裂带及附近区域地层的精细结构是理解地震孕育和发生过程的基础.
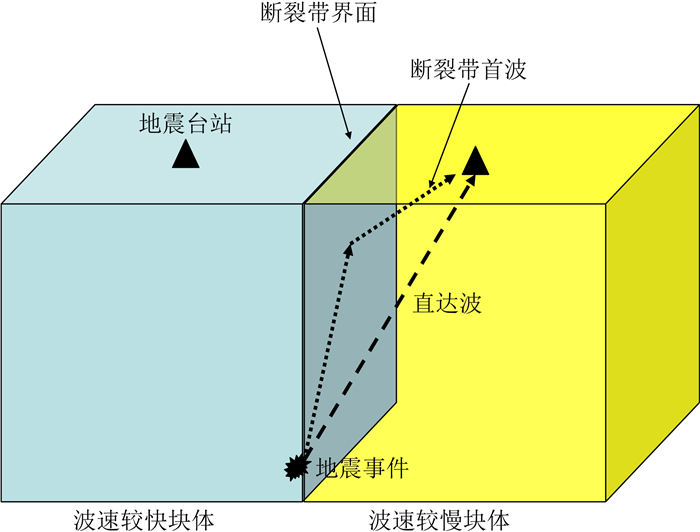
在断裂带内或靠近断裂带的台站可记录到两组与断裂带结构相关的震相.一种叫断裂带围陷波(Fault Zone Trapped Wave,FZTW),出现在直达波震相后,其主要特征为振幅大、持续时间长、频率在2~5 Hz等(Ben-Zion and Aki, 1990; Li and Leary, 1990; Ben-Zion et al., 2003; Lewis et al., 2005; Hillers et al., 2014; Qin et al., 2018).另外一种叫断裂带首波(Fault Zone Head Wave,FZHW),出现在直达P波震相前,与直达P波相比,其表现特征为振幅小、频率低、初至起跳方向相反等(Ben-Zion, 1990; Ben-Zion and Malin, 1991; McGuire and Ben-Zion, 2005; Lewis et al., 2007; Zhao and Peng, 2008; Zhao et al., 2010).断裂带首波的产生是由于岩石物性差异界面会引起地震波在传播方式上的路径差异,当地震事件发生在断裂带附近,地震波同时沿着断裂带界面两侧块体进行传播,在波速较快一侧的块体里传播的地震波会沿着断裂带界面折射传播到速度较慢一侧的块体,与水平层状介质情况下的Pn波震相类似,在波速较慢一侧地层的台站可观测到断裂带首波(Ben-Zion and Malin, 1991).
断裂带首波的传播路径主要在断裂带边界及附近区域进行传播,携带了丰富的断裂带信息,为研究震源深度以上断裂带精细结构提供了地震波信息.近几年,利用断裂带首波的走时、振幅、频谱和偏振特征确定断裂带速度差异和内部结构的方法得到了发展(Bulut et al., 2012; Bennington et al., 2013; Allam et al., 2014; Yang et al., 2015; Najdahmadi et al., 2016; Share et al., 2017, 2019).早期,断裂带首波是在北美板块和太平洋板块边界的圣安德烈斯断裂Parkfield段(Ben-Zion and Malin, 1991; Zhao and Peng, 2008)与Bear Valley段(McGuire and Ben-Zion, 2005),和南加州的Mission Creek断裂(Hough et al., 1994)附近观测到.流动地震观测技术的发展,使得在北美板块和太平洋板块边界的Calaveras断裂(Zhao et al., 2010)、Hayward断裂(Allam et al., 2014)、圣安德烈斯断裂南段(Share and Ben-Zion, 2016)、San Jacinto断裂(Share et al., 2017, 2019; Share and Ben-Zion, 2018),在安纳托利亚和欧亚板块边界的北安纳托利亚断裂Mudurnu段(Bulut et al., 2012)和Karadere段(Najdahmadi et al., 2016)附近也观测到断裂带首波.随着断裂带首波资料分析的深入,在破裂带边界(Li and Peng, 2016; Najdahmadi et al., 2016)和盆地附近(Yang et al., 2015; Qiu et al., 2017),断裂带首波也可被观测到.目前,在已观测到断裂带首波的几条断裂带上,通过分析发现沿断裂带走向方向的平均速度差异范围为3%~20%.
Yang等(2015)在甘孜—玉树断裂带附近观测到了断裂带首波,并且得到了沿断裂带的速度差异分布,但识别到断裂带首波的地震事件主要在主震震中附近及西北(NW)段.由于在甘孜—玉树断裂带的SE段的台站少,没有很好的约束,那么断裂带的SE段两侧是否也存在速度差异?本文增加了中国地震局地球物理勘探中心布设的早期流动地震台站的观测资料,进行了进一步的分析,把两次观测资料的结果进行了对比,确定断裂带首波主要是与断裂带拉张盆地结构有关,并对盆地结构特征进行了分析和讨论.
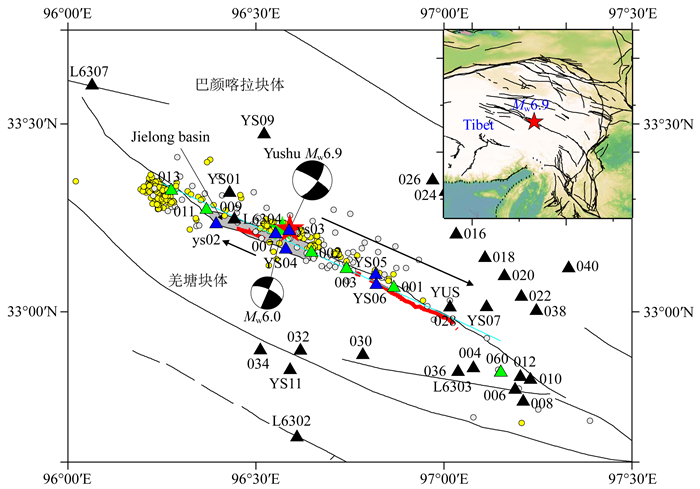
1 研究区域及观测数据甘孜—玉树断裂带是青藏高原内部的一条规模巨大的左旋走滑断裂带,全长~500 km,总体呈NW-NWW走向,和鲜水河—小江断裂带共同构成青藏高原物质东向挤出的边界(王敏等,2008).基岩破碎带一般宽数十至百余米,局部地段达数百米(孙鑫喆等,2012),将巴颜喀拉块体(NE)和羌塘块体(SW)分隔开(图 1),是一条第四纪以来表现为左旋走滑为主的大型构造断裂带.近些年来,利用GPS数据估算甘孜—玉树断裂带的错动速率,SE段为13.0±1.7 mm·a-1,NW段为3.1±2.8 mm·a-1(王阎昭等,2008).其中,玉树段在全新世的左旋走滑速率估计是7.3~12 mm·a-1(周荣军等,1996; 闻学泽等, 2003).甘孜—玉树断裂带的结隆段在隆宝湖附近形成两条分支断裂带(图 1),并在拉张作用力下,产生了一个被隆宝湖填充的结隆盆地(Wang et al., 2008).层析成像结果表明在巴颜喀拉块体(NE)的P波速度比在羌塘地块(SW)快达8%(王长在等,2013).
|
图 1 研究区域、地震事件及台站位置分布图 地震观测台站用不同颜色的实心三角形标记(包括固定和流动台站),其中Yang等(2015)分析和识别到断裂带首波的地震台站用蓝色三角形标出,绿色三角形为本文分析中国地震局地球物理勘探中心的数据新识别到断裂带首波的地震台站.该研究区域内的断裂带用黑色线条标记,玉树地震后产生的地表破裂为红色实线所在的位置(Guo et al., 2012),灰色区域为断裂带拉张作用下产生的结隆盆地(Wang et al., 2008),蓝绿色实线为便于计算和分析过程中采用简化的断裂带界面位置(走向为114.95°).2010年玉树地震主震MW6.9和最大余震MW6.0的震中位置分别为红色和绿色五角星.震源机制解采用全球矩张量地震目录的震源信息(http://www.globalcmt.org).观测到断裂带首波的余震事件水平位置用实心圆点表示,其中Wang等(2014)重新精定位的事件用黄色圆点表示,中国地震台网中心(CENC)定位的事件用灰色圆点表示. Fig. 1 A map of the study region and seismic station location The triangles with different color denote the seismic stations, including the permanent and portable stations, and the green and blue triangles denote the stations that record FZHWs found in this study and in Yang et al. (2015), respectively. The faults in the study region are marked as the black lines, the mainshock surface rupture zones are marked as the red solid lines (Guo et al., 2012), and the Jielong basin is marked as the gray area (Wang et al., 2008). The cyan solid line with the strike of 114.95° marks the simplified fault interface for calculation. The red and green stars denote the epicenters of the MW6.9 mainshock and MW6.0 aftershock, and their focal mechanisms are from the website of http://www.globalcmt.org. Aftershocks with FZHWs are marked as the solid circles, and the yellow and gray circles denote the events relocated by Wang et al.(2014) and located by CENC, respectively. |
巴颜喀拉块体位于甘孜—玉树断裂带的东北(NE)侧,作为青藏高原的主要块体之一,是一个东西(EW)长、南北(SN)短的长条形地块,其中在EW方向上长~2000 km,而在SN方向上有些区域仅200 km(马玉虎和马辉青,2013).在巴颜喀拉块体边界上,自20世纪以来发生了超过10个MS≥7.0的强震(陈立春等, 2010).例如,2008年5月12日在四川发生的汶川MS8.0(MW7.9)和2010年4月14日在青海发生的玉树MS7.1(MW6.9)地震等.其中,玉树MS7.1地震发生在甘孜一玉树断裂带上.
玉树地震发生在青海省玉树县结古镇往西~40.0 km处,其震中位置为33.20°N,96.60°E,深度为~14.0 km(据中国地震台网中心测定).主震(MW6.9)和最大余震(MW6.0)导致沿着走向310°~320°破裂了~70 km长(陈立春等, 2010;Li et al., 2012;Xu et al., 2013),整体为左旋走滑性质,东北(NE)盘向NW方向运动,西南(SW)盘向SE方向运动.陈立春等(2010)的研究表明地震造成的同震地表破裂存在着两段(图 1).其中,一段是由主震MW6.9地震引发往SE方向的连续同震地表破裂长度为~30 km,且地震产生的最大同震滑移量就在该段破裂上,另一段是由最大余震MW6.0地震造成往NW方向的同震地表破裂,其长度为~15 km,中间是拉张的结隆盆地.王长在等(2013)层析成像结果表明从浅层延伸至地下~10 km的深度,在甘孜—玉树断裂带的结隆段存在着明显的速度差异.
主震发生之后余震不断,在距离主震震中150 km范围内只有一个固定地震台站(YUS),其观测的设备是频率响应范围为120 s到50 Hz的三分量KS2000型宽频带地震计.中国地震局地震应急观测组分批在震区布设了流动地震观测台站(图 1),以监测后续的余震事件.其中,中国地震局地球物理勘探中心在2010年4月18日至4月29日期间,围绕震区架设了30台PDS-2数字地震仪(频带范围为2.5~40 Hz)对余震序列进行观测(刘巧霞等,2012),在观测期间一共记录到了408次余震事件.中国地震局地球物理研究所在2010年5月10日至10月30日期间,围绕主震破裂区布设了26个流动地震观测台站(Yang et al., 2015),布设的观测设备是频率响应范围为60 s到50 Hz的三分量Guralp-3ESPC型宽频带地震仪,在观测期间一共记录约2000次余震事件(Wang et al., 2014).流动和固定地震台站的采样率均为100 sps (samples per second).余震观测台站中有20多个台站分布在甘孜—玉树断裂带附近,选取其中20个台站的数据进行分析(19个流动地震台站和1个YUS固定站,表 1),位置分布图请见图 1,为在该区域开展断裂带精细结构研究提供了丰富的数据基础.
|
|
表 1 地震观测台站信息 Table 1 The information of the seismic stations |
断裂带首波的传播路径是沿存在速度差异界面传播速度较快一侧折射到速度较慢的地层(图 2),与水平层状地层的Pn震相传播路径相似,同样也存在着一个临界距离(xc).地震波速度较慢一侧地层的台站到断裂带界面的距离(x)必须小于临界距离,断裂带首波才会先于直达P波到达,并在地震记录上易于识别(Ben-Zion and Malin, 1991).Ben-Zion(1989)给出了临界距离(xc)的计算公式:
|
图 2 断裂带首波传播示意图(改自Bennington et al., 2013) Fig. 2 Schematic diagram showing the propagation for FZHW (Modified from Bennington et al., 2013) |

|
(1) |
其中,r为断裂带首波沿断裂带界面的传播距离;α1为地层传播速度较快的P波速度;α2为地层传播速度较慢的P波速度.
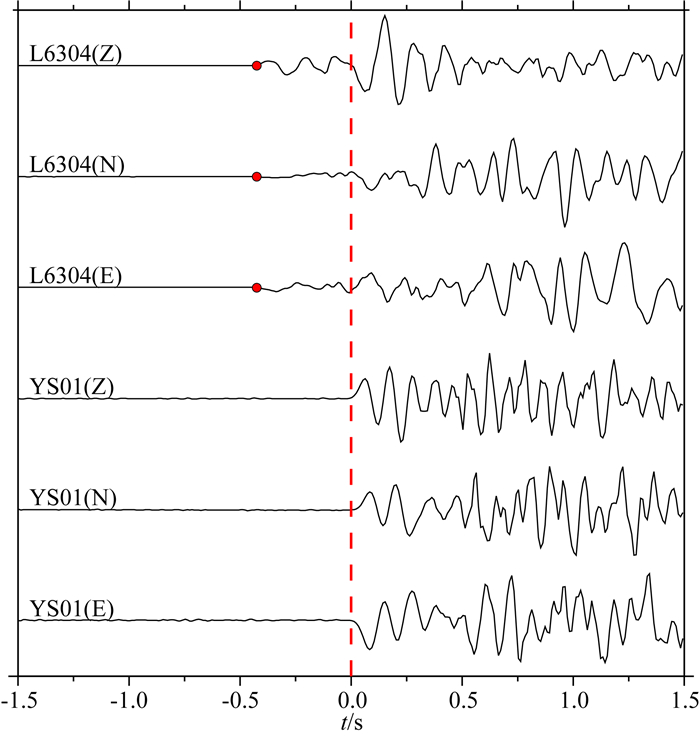
在断裂带首波的传播过程中,传播路径从波速较快一侧的地层折射到较慢一侧,穿过了断裂带界面.在实际的地质地层中,断裂带界面常常是一个岩性复杂和裂隙发育的破碎区,具有一定的衰减作用.因此,断裂带首波在穿过破碎区时,波形在振幅和频率特征上均会发生变化(图 3),断裂带首波比直达P波的波形振幅要小一些,频率略微低一些(Ben-Zion, 1990).图 3为同一地震事件在L6304和YS01两个台站的三分量记录,根据记录的波形特征,在台站L6304上识别到了断裂带首波,而台站YS01的波形简单,没有发现断裂带首波.对于走滑型地震来说,断裂带两侧的滑动方向是相反的,断裂带首波的初至起跳方向与直达P波在理论上也是相反的.图 3台站L6304的垂直分量记录中识别到的断裂带首波初至是向上的,直达P波的初至是向下的.Yang等(2012)指出当复合型地震事件的震源机制较复杂时,断裂带首波和直达P波的初至方向不一定相反.
|
图 3 台站L6304和YS01记录到同一事件(QH.201005280736)的三分量原始记录图红色的圆点和竖直虚线分别是识别的断裂带首波和直达P波震相初至. Fig. 3 The three-component waveform of an aftershock (event ID QH.201005280736) recorded at seismic stations L6304 and YS01 The red dots and vertical dashed line mark the onset of FZHWs and the direct P wave, respectively. |
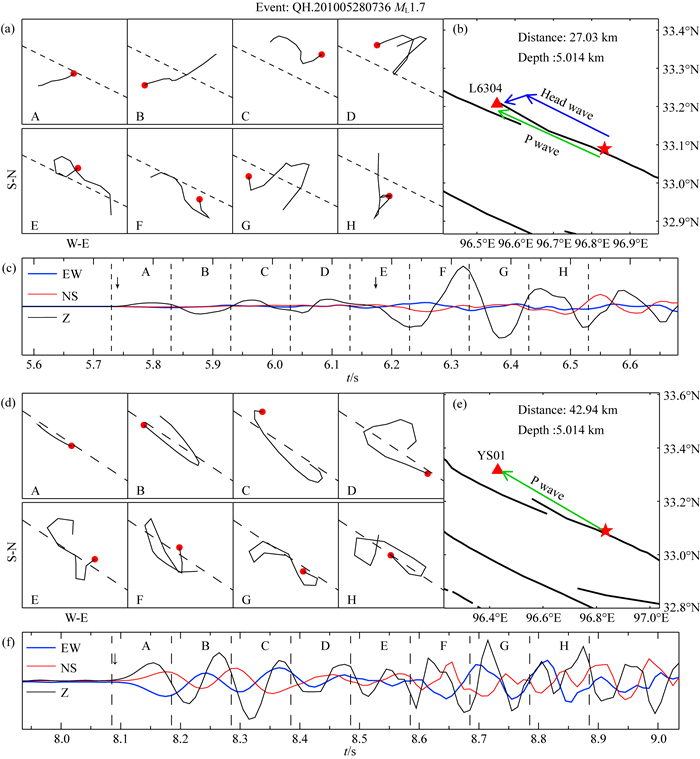
根据断裂带首波和直达P波的传播路径,除了在波形特征上有差别外,在水平偏振极化方向上也有差异.在理论上,断裂带首波是从速度较快的块体里沿着断裂带界面传播,在断裂带界面折射到速度相对较慢块体上的台站,其在水平分量的偏振极化方向与震源距方向存在一定的角度.而直达P波的传播路径是从震源震中直接传播到台站,在水平分量的偏振极化方向应该与震源距方向一致.因此,断裂带首波到达观测台站时的水平偏振极化方向与直达P波存在着角度差异,可以通过在水平分量上的偏振极化差异特征来进一步确定断裂带首波和直达P波震相拾取的正确性和可靠性(Bulut et al., 2012).图 4给出了图 3中台站L6304和YS01记录的水平偏振极化特征,可以清晰的看到台站L6304记录到的直达P波是沿着震源距方向,而断裂带首波的水平极化方向与直达P波存在一定的角度.另外,没有识别到断裂带首波的台站YS01记录的水平极化方向一直沿着震源距方向.
|
图 4 台站L6304和YS01记录到同一事件(QH.201005280736)的水平分量偏振极化分析图,来自Yang等(2015) Fig. 4 The polarization analysis map with horizontal component of the QH.201005280736 aftershock event recorded at seismic stations L6304 and YS01 from Yang et al. (2015) |
对于一个存在速度差异的两个板块或块体界面,除了存在上述的波形特征和偏振极化关系,通过震相识别后可以获得一系列地震事件产生的断裂带首波和直达P波之间的走时差(Δt).对台站观测到的所有地震事件波形按直达P波初至排列,可以发现在连续的速度差异界面下,断裂带首波的初至分别在台站位置沿断裂带界面的两个方向大致呈线性关系.Ben-Zion和Malin(1991)给出了走时差(Δt)和沿断裂带界面的传播距离(r)之间的关系:

|
(2) |
其中,Δα为断裂带首波与直达P波之间的速度差;α为地层的平均P波速度.
一般情况下,研究区域地层的平均速度(α)可以假设为一个常数,就可以根据公式(2),利用走时差和沿断裂带界面距离的数据,通过线性回归拟合来分析和估算沿断裂带界面不同方向上的平均速度差异(Δα/α).
3 断裂带首波分析在主震后的余震事件观测期间,按照中国地震台网中心(CENC)的地震目录一共有2500多个余震事件,其中1688个事件的震中位置采用双差定位的地震目录信息(Wang et al., 2014),其余的事件使用中国地震台网中心(CENC)的地震目录.根据流动地震台站的位置分布(图 1)和部分数据的分析结果(Yang et al., 2015),本文选取了在甘孜—玉树断裂带附近及周围的20个台站,其中028,YUS,YS07,060,012和010等6个台站位于断裂带的东南段,其他14个台站均分布在主震震中附近的结隆盆地周围.
结合断裂带首波的波形和水平偏振极化特征,参照断裂带首波的分析步骤(Zhao et al., 2010; Allam et al., 2014; Yang et al., 2015).首先,将观测到的余震事件记录按照地震目录进行准备,接着按照台站名对三分量记录进行挑选和识别,去除掉信噪比较低的事件波形,同时标记发育断裂带首波的地震事件和拾取震相,然后再按照地震事件对各台站波形进行回溯性检验,以检查同一事件在不同台站上观测到的断裂带首波和直达P波震相的一致性.在拾取震相初至到时的过程中对三分量记录数据只去除均值,不做任何滤波处理,以减少数值分析对原始记录的干扰(Allam et al., 2014).最后,将断裂带首波和直达P波在水平分量上进行偏振极化分析(Bulut et al., 2012),以确保根据三分量波形特征识别的断裂带首波的准确性.
通过系统的分析和检验后,在中国地震局地球物理勘探中心架设的7个台站的记录上识别到了断裂带首波震相到时(表 2)和相应的直达P波震相,在结隆盆地周围的6个台站(001,002,003,007,011和013)与Yang等(2015)识别到断裂带首波的6个台站(ys02,ys03,YS04,YS05,YS06和L6304),都分布在结隆盆地周围(图 1).其中,台站ys02的记录识别到的断裂带首波震相事件最多,拾取到了234个,001台站最少,只拾取到了5个.这与地震事件和台站的位置、地层的地质结构、记录到的余震事件数量以及观测信号的信噪比等均有一定的关系.
|
|
表 2 各台站观测到的地震事件和断裂带首波数量 Table 2 The information of earthquake events and FZHWs observed by the seismic stations |
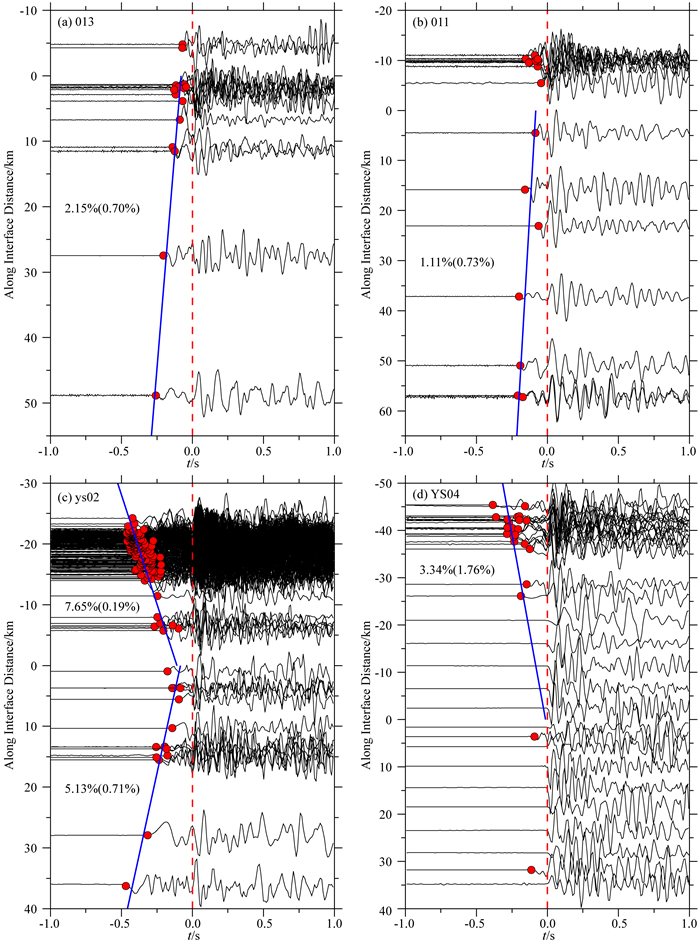
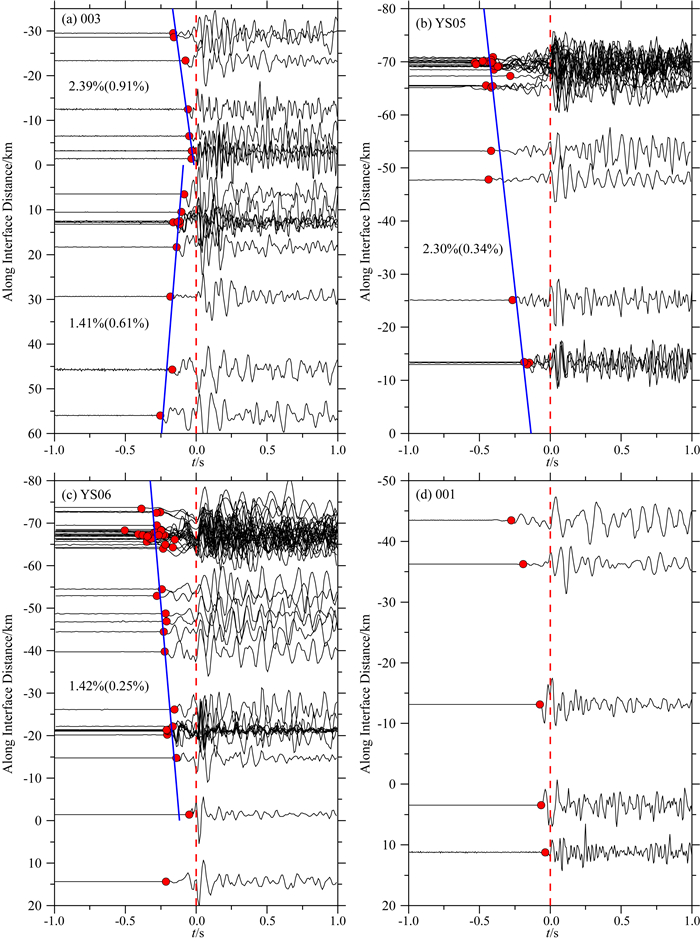
图 5,6,7和8给出了各台站识别的断裂带首波以及相应的直达P波的垂直分量波形和震相到时,并从图中可看出同一台站记录在部分相近距离上的断裂带首波与直达P波之间的走时差也存在一定的差别.这些差别主要与地震事件震源特征、地震定位精度、传播路径和震相手动识别精度等有关.在震源特征不清楚的情况下,地震定位精度的误差会带来一定的影响,在断裂带首波分析过程中,地震事件采用了双差重定位的结果(Wang et al., 2014),但还是会存在一定的误差.其次,断裂带内部结构复杂,岩性破碎,传播路径可能会有差异.最后,在断裂带首波和直达P波的震相识别过程中也存在一定的误差.但对于分析这些台站记录到的断裂带首波与直达P波的走时差与沿断裂带界面的传播距离之间的线性关系并不影响,从图 5—8中也可以看出两者之间具有良好的线性关系.
|
图 5 盆地南侧流动地震台站垂直分量记录的断裂带首波和直达P波的震相到时及走时差 红色虚线是识别的直达P波震相初至,红色的圆点是识别的断裂带首波震相初至,蓝色实线是走时差随断裂带界面传播距离的最小二乘线性拟合(95%置信区间). Fig. 5 Vertical seismograms showing the moveout between FZHWs and direct P waves recorded at the temporary seismic stations in the south side of the basin The red dots and vertical dashed line mark the onset of FZHWs and the direct P wave, respectively. The blue solid lines show the least squares fitting of the moveout and propagation distance with the slope and 95 percent confidence bounds marked. |

|
图 6 盆地北侧流动地震台站垂直分量记录的断裂带首波和直达P波的震相到时及走时差 红色虚线是识别的直达P波震相初至,红色的圆点是识别的断裂带首波震相初至,蓝色实线是走时差随断裂带界面传播距离的最小二乘线性拟合(95%置信区间). Fig. 6 Vertical seismograms showing the moveout between FZHWs and direct P waves recorded at the temporary seismic stations in the north side of the basin The red dots and vertical dashed line mark the onset of FZHWs and the direct P wave, respectively. The blue solid lines show the least squares fitting of the moveout and propagation distance with the slope and 95 percent confidence bounds marked. |
|
图 7 盆地东侧流动地震台站垂直分量记录的断裂带首波和直达P波的震相到时及走时差 红色虚线是识别的直达P波震相初至,红色的圆点是识别的断裂带首波震相初至,蓝色实线是走时差随断裂带界面传播距离的最小二乘线性拟合(95%置信区间). Fig. 7 Vertical seismograms showing the moveout between FZHWs and direct P waves recorded at the temporary seismic stations in the east side of the basin The red dots and vertical dashed line mark the onset of FZHWs and the direct P wave, respectively. The blue solid lines show the least squares fitting of the moveout and propagation distance with the slope and 95 percent confidence bounds marked. |

|
图 8 台站060观测到震中距小于10 km事件的断裂带首波和直达P波走时差与沿断裂带界面传播的距离(a)和震源深度(b)的关系图 红色虚线是识别的直达P波震相初至,红色的圆点是识别的断裂带首波震相初至. Fig. 8 (a) Vertical seismograms showing the moveout between FZHWs and direct P waves recorded at the station 060 with the distances along interface (a) and the hypocentral depths (b) for events with the epicentral distances less than 10 km The red dots and vertical dashed line mark the onset of FZHWs and the direct P wave, respectively. |
根据该研究区域此前的研究结果,P波的平均速度约为5.5 km·s-1(刘巧霞等, 2012;王长在等, 2013).为获得前人类似的分析结果(Zhao and Peng, 2008; Zhao et al., 2010; Allam et al., 2014; Yang et al., 2015),根据公式(2)将识别的断裂带首波到时与对应直达P波到时之差沿界面传播距离的数据进行线性拟合分析,获得平均速度差异的估算值,线性拟合的两个斜率取决于事件发生在台站位置沿速度差异界面走向的两个不同方向.图 5,6和7给出了12个台站记录拾取到的断裂带首波与直达P波走时差与沿界面传播距离的线性拟合关系,从图中可看出中国地震局地球物理勘探中心布设在盆地周围的6个台站的速度差异分布,其中台站007往SE方向的平均速度差异为5.72%,其余台站沿断裂带界面的速度差异为1%~2%.与Yang等(2015)给出的ys02,ys03,YS04,YS05,YS06和L6304等6个台站的速度差异相比,两个观测时期获得速度差异分布基本一致.
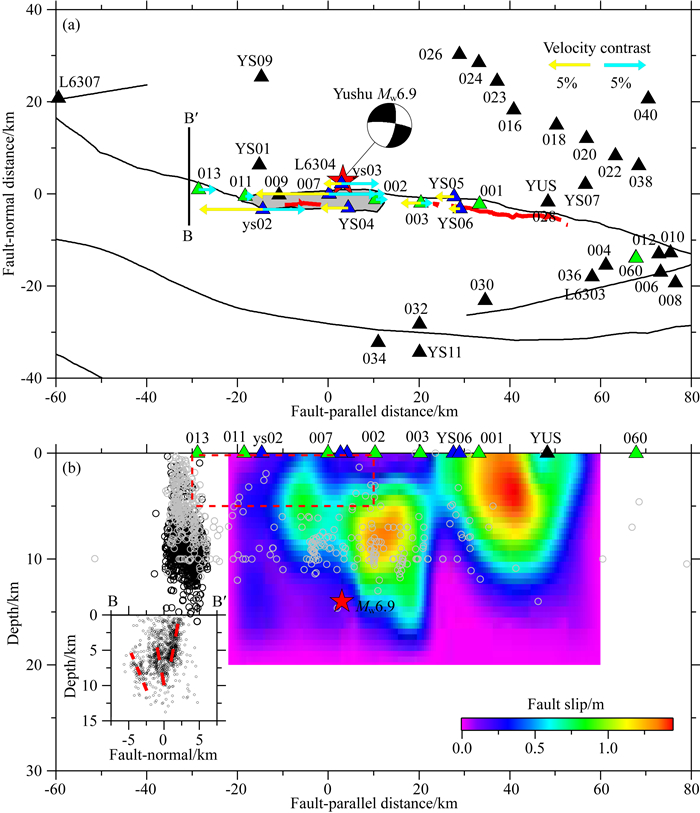
图 8给出了位于断裂带东南段附近的台站060观测到的断裂带首波与直达P波初至震相特征,从图中可看出断裂带首波与直达P波的走时差随沿断裂带界面的距离和余震事件的震源深度的变化关系,在沿断裂带界面距离或震源深度发生变化时,断裂带首波与直达P波的走时差基本不变,而在台站060附近的两个台站012和010记录上没有识别到断裂带首波,从图 1的台站分布和断裂带位置上看,台站012和010比台站060更靠近断裂带,在理论上也应该发育断裂带.表明在台站060观测到的断裂带首波应该是由于局部低速区造成的.从图 1中可推断局部低速区在水平和深度上范围均不超过4 km.图 9b给出主震的同震滑移分布(Li et al., 2011),最大的滑动位移量可达1.5 m,然而台站060的位置与同震滑动位移最大处在水平方向上相距~20 km,说明该局部低速区不是同震滑移造成的.
|
图 9 (a) 沿甘孜—玉树断裂带的速度差异.黄色和蓝绿色箭头分别表示各个台站沿断裂带走向往NW和SE方向的速度差异值,箭头的长短代表速度差异的大小,台站标记与图 1相同.(b)沿断裂带的主震滑移分布图.红色的虚线方框表示结隆盆地可能形成的低速区.同震滑移分布数据来源于Li等(2011) Fig. 9 (a) A map of the observed velocity contrasts for all stations with FZHWs along the GYF. The yellow and cyan arrows represent velocity contrast values for along-strike sections to the NW and SE that are centered at different stations, respectively. The length of each arrow is proportional to the percentage of the velocity contrast. The stations symbols are the same as in Fig. 1. (b) The mainshock slip distribution along the GYF. The red dashed rectangle marks a possible low-velocity zone (LVZ) formed beneath the Jielong basin. The data of the slip distribution is from Li et al. (2011) |
图 9给出了该研究区域根据断裂带首波分析获得的平均速度差异的分布特征.Yang等(2015)根据图中蓝色三角形的台站资料分析,给出了在主震震中附近和往NW方向的平均速度差异为5%~8%,而往SE方向的平均速度差异较小,约为1%~3%.图中绿色三角形为物探中心布设观测到断裂带首波的台站,其资料分析与Yang等(2015)的结果基本一致.另外,在同震滑移量最大的地表破裂带附近的台站001,YS05和YS06,分析获得的平均速度差异小于2.5%,而在主震震中附近的台站007,ys02和L6304,获得的平均速度差异反而比其他台站的大,表明在主震震中附近观测到的断裂带首波与玉树地震的同震滑移之间不存在相关性.
4 讨论本文对中国地震局地球物理勘探中心在2010年玉树MW6.9地震后的余震观测资料,按照前人的分析方法(Zhao and Peng, 2008; Zhao et al., 2010; Allam et al., 2014; Yang et al., 2015)进行了系统的分析和研究.识别到断裂带首波的地震台站主要分布在结隆盆地周围,其中在主震震中附近的台站沿断裂带界面SE方向的平均速度差异值最大为5.72%,盆地周围其他台站沿断裂带走向的速度差异只有1%~2%.产生断裂带首波的余震事件的震源深度都不超过12 km,且主要集中在两个地方:一个是在主震震中NW方向的台站013水平距离范围为-5到5 km的下方,另一个是在主震震中SE方向的台站002水平距离范围为-10到10 km的下方.分析获得的平均速度差异值分布和产生断裂带首波的余震事件位置,与Yang等(2015)的分析结果是一致的.另外,在沿甘孜—玉树断裂带SE方向的台站060观测到了断裂带首波,主要是由于在台站060下方或附近存在较小的局部低速体造成,且对主震位置沿甘孜—玉树断裂带NW方向的拉张盆地的结构特征分析没有影响,因此在本文中不再讨论.
刘巧霞等(2012)的余震精定位结果给出余震区随时间而发生改变,2010年4月30日前,余震事件主要分布在隆宝盆地SE侧的断裂段内,从2010年5月起,呈现沿甘孜—玉树断裂带向NW方向迁移的趋势,余震转移到结隆盆地NW方向的附近区域,说明在两个时段观测到的断裂带首波与该区域地下结构存在着密切的关系.产生断裂带首波类似特征的还有可能是在横向介质的莫霍面或壳内界面(Stein and Wysession, 2003)或地震事件震源效应引起,结合Yang等(2015)的分析结果,在该研究区域最有可能的结构是一个存在速度差异的垂直或高倾角界面.
根据Wang等(2008)的野外地质调查和Yang等(2015)在结隆盆地周围台站资料分析的结果,表明在主震震中附近的结隆盆地不能简单的用一个单一的速度差异界面来解释.结隆盆地在甘孜—玉树断裂带的拉张力作用下,形成了一个被隆宝湖所填充的拉张盆地.在结隆盆地两侧的台站都识别到了明显的断裂带首波,盆地内介质地震波速度比断裂带两侧块体的速度都低.因此,在拉张力作用下,结隆盆地形成了一个在两侧地震波速度高、盆地内速度低的低速区.另外,该研究区域的地震层析成像(王长在等,2013)和地表地质调查(Wang et al., 2008)的结果,在主震起始破裂的地表破裂处的速度差异是比较小的,进一步说明观测到的断裂带首波主要是由于结隆盆地导致的低速区产生的.
根据断裂带首波产生的原理,在地震波速度较慢一侧的地震观测台站位置到速度差异界面的距离应小于临界距离(Ben-Zion, 1989),即前面所提到的公式(1),则可通过断裂带首波分析获得的平均速度差异值估算台站位置到速度差异界面的距离.例如,台站YS04识别到的断裂带首波分析获得沿断裂带界面往西北方向的平均速度差异为3.34%,图 5d中给出了断裂带首波沿速度差异界面的传播距离为~30 km,则台站YS04到速度差异界面的距离小于临界距离0.52 km.同理可获得台站ys03到速度差异界面的距离小于0.09 km.表 1给出了台站YS04和ys03到简化计算断裂带界面的距离分别为2.88和2.47 km.则根据台站YS04和ys03的位置可估算结隆盆地形成低速区的宽度为5.35~5.97 km,与Wang等(2008)的野外地质调查的盆地宽度为~7.0 km也比较一致.
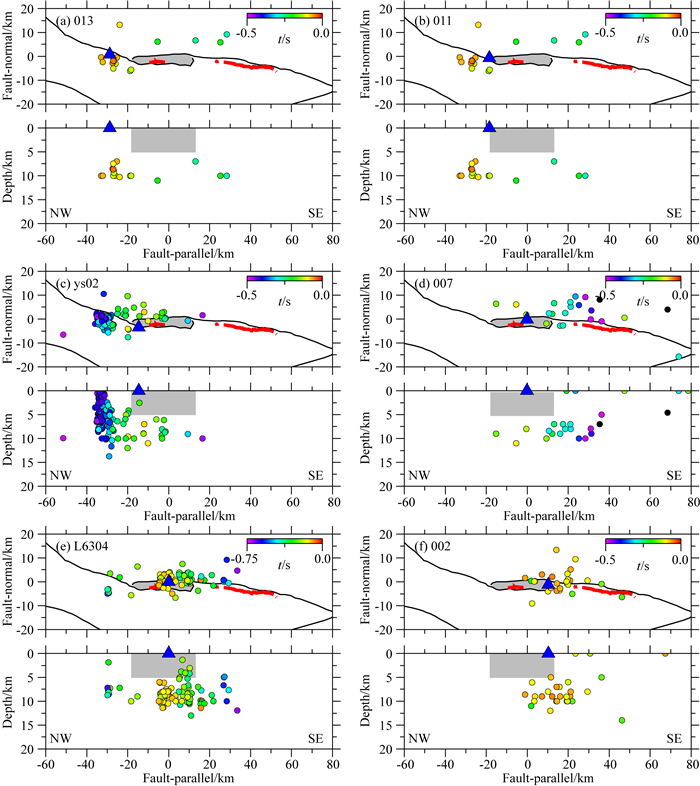
对于存在速度差异界面的断裂带,还可以通过断裂带首波分析和评估断裂带界面的连续性.在理论上,地震波沿着一个连续的断裂带界面传播的距离越长,断裂带首波和直达P波之间的走时差Δt越大.但是从图 10中获得的6个台站观测到的走时差Δt分布特征,与Yang等(2015)的结果类似,也观测到了走时差Δt的空间变化.例如,在-20 km处的余震事件在台站002波形记录上的走时差Δt仅为~0.1 s,而在台站007的记录上高达0.3 s,相差约3倍,但是该事件沿断裂带界面到台站007的距离只是到台站002的1.5倍.另外,根据研究区域的平均速度差异分布特征(图 9),在主震震中附近,台站007,ys02和L6304观测到的速度差异比其他台站的大,也说明了甘孜—玉树断裂带在该研究区域存在着明显的分段性.
|
图 10 结隆盆地周围观测到断裂带首波的6个地震台站的地震事件分布图 每个事件震中的颜色表示断裂带首波和直达P波的走时差幅度. Fig. 10 A map of the event locations for the 6 seismic stations near the Jielong basin that recorded FZHWs The color of each hypocenter denotes the amplitude of the moveout between the FZHW and direct P wave. |
为进一步探讨结隆盆地的延伸深度问题,对断裂带首波与直达P波的走时差随震源深度的变化进行了分析.为了减小沿横向传播带来的走时变化的影响,我们选用了震中距小于5 km的余震事件.从图 11中可得出,断裂带首波与直达P波的走时差Δt随着震源深度的增加而没有变化,说明结隆盆地往下的深度没有延伸到余震区震源深度,仅限于地表浅层5 km之上.另外,根据Wang等(2008)的地表调查结果和模型,结隆盆地地表长度为~35 km,从图 9中可看出,台站013不在其盆地模型上,而台站013观测到了明显的断裂带首波.根据余震事件精定位的结果(图 9b),余震事件在台站013附近下方呈楔形分布,并延伸到震源深度(Wang et al., 2014),而图 11中台站013观测到的断裂带首波与直达P波的走时差与震源深度的关系可得出,产生断裂带首波的地层深度应该在7 km以上,与其他台站基本一致.说明结隆盆地往NW方向至少延伸到了台站013,同理往SE方向延伸到了台站002.因此,结隆盆地的长度至少为40 km,沿着甘孜—玉树断裂带分别与巴颜喀拉块体(NE)和羌塘块体(SW)产生了两个存在物性差异的界面.

|
图 11 结隆盆地周围不同台站观测到的断裂带首波与直达P波的走时差随震源深度的关系图.其中,台站011到地震事件的水平距离小于10 km,其他5个台站均小于5 km 红色圆点和垂直虚线分别为识别的断裂带首波和直达P波的初至. Fig. 11 Vertical seismograms for the moveout between FZHWs and direct P waves recorded at the 6 seismic stations with the hypocentral depths. The epicentral distances for the events recorded at station 011 is within 10 km, and for other 5 stations is within 5 km The red dots and vertical dashed line mark the onset of FZHWs and the direct P wave, respectively. |
本文在Yang等(2015)结果的基础上,联合中国地震局地球物理勘探中心在2010年MW6.9玉树地震后的余震观测资料,对主震发生后6个月的余震事件,围绕甘孜—玉树断裂带附近地震台站的观测资料进行了系统的分析,发现在结隆盆地周围的地震台站沿断裂带走向上的平均速度差异存在着百分之几量级的变化,物探中心的数据资料分析结果与之前Yang等(2015)的结果基本一致,在主震震中附近的台站观测到的速度差异为5%~8%,且通过台站位置和产生断裂带首波事件的分析获得了断裂带拉张盆地(结隆盆地)的结构特征,盆地长度为~40 km,宽度为5.35~5.97 km,深度没有延伸到余震区震源深度,且不超过5 km,在地表浅层形成了一个低速区,分别与巴颜喀拉块体(NE)和羌塘块体(SW)产生了两个物性差异的界面.
通过利用断裂带首波信息对甘孜—玉树断裂带结构进行分析,获得了断裂带拉张盆地结构的几何特征,为发展断裂带精细结构及几何特征提供了一种新的技术方法和途径.在下一步的工作中,将联合断裂带首波和直达P波的震相信息对结隆盆地进行成像研究(如Bennington et al., 2013),获得结隆拉张盆地的速度结构及形态等.另外,随着高度可重复人工震源的发展和应用(如Wang et al., 2012, 2018),结合密集台阵(如Yang et al., 2014; Share et al., 2017, 2019)可以开展断裂带高精度结构探测及变化监测,以进一步认识和掌握潜在发震断裂带随时间的变化行为.
致谢 感谢中国地震局地球物理勘探中心提供了玉树地震科考流动地震观测数据.同时,中国地震局地球物理研究所、中国地震局地球物理勘探中心、青海省地震局和甘肃省地震局等单位的很多同志参与了野外流动地震观测,在此表示衷心的感谢.另外,感谢两位评审专家对该文章提出的宝贵建议.
Allam A A, Ben-Zion Y, Peng Z G. 2014. Seismic imaging of a bimaterial interface along the Hayward fault, CA, with fault zone head waves and direct P arrivals. Pure and Applied Geophysics, 171(11): 2993-3011. DOI:10.1007/s00024-014-0784-0 |
Ampuero J P, Ben-Zion Y. 2008. Cracks, pulses and macroscopic asymmetry of dynamic rupture on a bimaterial interface with velocity-weakening friction. Geophysical Journal International, 173(2): 674-692. DOI:10.1111/j.1365-246X.2008.03736.x |
Bennington N L, Thurber C, Peng Z G, et al. 2013. Incorporating fault zone head wave and direct wave secondary arrival times into seismic tomography:Application at Parkfield, California. Journal of Geophysical Research:Solid Earth, 118(3): 1008-1014. DOI:10.1002/jgrb.50072 |
Ben-Zion Y. 1989. The response of two joined quarter spaces to SH line sources located at the material discontinuity interface. Geophysical Journal International, 98(2): 213-222. DOI:10.1111/j.1365-246X.1989.tb03346.x |
Ben-Zion Y. 1990. The response of two half spaces to point dislocations at the material interface. Geophysical Journal International, 101(3): 507-528. DOI:10.1111/j.1365-246X.1990.tb05567.x |
Ben-Zion Y, Aki K. 1990. Seismic radiation from an SH line source in a laterally heterogeneous planar fault zone. Bulletin of the Seismological Society of America, 80(4): 971-994. |
Ben-Zion Y, Malin P. 1991. San Andreas fault zone head waves near Parkfield, California. Science, 251(5001): 1592-1594. DOI:10.1126/science.251.5001.1592 |
Ben-Zion Y. 2001. Dynamic ruptures in recent models of earthquake faults. Journal of the Mechanics and Physics of Solids, 49(9): 2209-2244. DOI:10.1016/S0022-5096(01)00036-9 |
Ben-Zion Y, Peng Z G, Okaya D, et al. 2003. A shallow fault-zone structure illuminated by trapped waves in the Karadere-Duzce branch of the North Anatolian Fault, western Turkey. Geophysical Journal International, 152(3): 699-717. DOI:10.1046/j.1365-246X.2003.01870.x |
Ben-Zion Y, Sammis C. 2003. Characterization of fault zones. Pure and Applied Geophysics, 160(3-4): 677-715. |
Bulut F, Ben-Zion Y, Bohnhoff M. 2012. Evidence for a bimaterial interface along the Mudurnu segment of the North Anatolian Fault Zone from polarization analysis of P waves. Earth and Planetary Science Letters, 327-328: 17-22. DOI:10.1016/j.epsl.2012.02.001 |
Chen L C, Wang H, Ran Y K, et al. 2010. The MS7.1 Yushu earthquake surface rupture and large historical earthquakes on the Garzê-Yushu Fault. Chinese Science Bulletin, 55(31): 3504-3509. DOI:10.1007/s11434-010-4079-2 |
Chester F M, Evans J P, Biegel R L. 1993. Internal structure and weakening mechanisms of the San Andreas fault. Journal of Geophysical Research:Solid Earth, 98(B1): 771-786. DOI:10.1029/92JB01866 |
Evans J P, Chester F M. 1995. Fluid-rock interaction in faults of the San Andreas system:inferences from San Gabriel fault rock geochemistry and microstructures. Journal of Geophysical Research:Solid Earth, 100(B7): 13007-13020. DOI:10.1029/94JB02625 |
Guo J M, Zheng J J, Guan B B, et al. 2012. Coseismic surface rupture structures associated with 2010 MS7.1 Yushu earthquake, China. Seismological Research Letters, 83(1): 109-118. DOI:10.1785/gssrl.83.1.109 |
Hillers G, Campillo M, Ben-Zion Y, et al. 2014. Seismic fault zone trapped noise. Journal of Geophysical Research:Solid Earth, 119(7): 5786-5799. DOI:10.1002/2014JB011217 |
Hough S E, Ben-Zion Y, Leary P. 1994. Fault zone waves observed at the southern Joshua Tree earthquake rupture zone. Bulletin of the Seismological Society of America, 84(3): 761-767. |
Lewis M A, Peng Z G, Ben-Zion Y, et al. 2005. Shallow seismic trapping structure in the San Jacinto fault zone near Anza, California. Geophysical Journal International, 162(3): 867-881. DOI:10.1111/j.1365-246X.2005.02684.x |
Lewis M A, Ben-Zion Y, McGuire J. 2007. Imaging the deep structure of the San Andreas Fault south of Hollister with joint analysis of fault zone head and direct P arrivals. Geophysical Journal International, 169(3): 1028-1042. DOI:10.1111/j.1365-246X.2006.03319.x |
Li C Y, Pang J Z, Zhang Z Q. 2012. Characteristics, geometry, and segmentation of the surface rupture associated with the 14 April 2010 Yushu earthquake, eastern Tibet, China. Bulletin of the Seismological Society of America, 102(4): 1618-1638. DOI:10.1785/0120110261 |
Li H B, Wang H, Xu Z Q, et al. 2013. Characteristics of the fault-related rocks, fault zones and the principal slip zone in the Wenchuan Earthquake Fault Scientific Drilling Project Hole-1 (WFSD-1). Tectonophysics, 584: 23-42. DOI:10.1016/j.tecto.2012.08.021 |
Li Y G, Leary P G. 1990. Fault zone trapped seismic waves. Bulletin of the Seismological Society of America, 80(5): 1245-1271. |
Li Z H, Elliott J, Feng W P, et al. 2011. The 2010 MW6.8 Yushu (Qinghai, China) earthquake:Constraints provided by InSAR and body wave seismology. Journal of Geophysical Research:Solid Earth, 116(B10): B10302. DOI:10.1029/2011JB008358 |
Li Z F, Peng Z G. 2016. Automatic identification of fault zone head waves and direct P waves and its application in the Parkfield section of the San Andreas Fault. Geophysical Journal International, 205(3): 1326-1341. DOI:10.1093/gji/ggw082 |
Liu Q X, Yang Z X, Xin H L, et al. 2012. Relocation of Yushu MS7.1 earthquake aftershocks and discussion on seismogenic structure. Chinese Journal of Geophysics (in Chinese), 55(1): 146-154. DOI:10.6038/J.issn.0001-5733.2012.01.014 |
Ma Y H, Ma H Q. 2013. Relationship between Bayankala block activity of strong earthquakes and Yushu MS7.1 earthquake in 2010. Plateau Earthquake Research (in Chinese), 25(1): 1-9. |
McGuire J, Ben-Zion Y. 2005. High-resolution imaging of the Bear Valley section of the San Andreas Fault at seismogenic depths with fault-zone head waves and relocated seismicity. Geophysical Journal International, 163(1): 152-164. DOI:10.1111/j.1365-246X.2005.02703.x |
Najdahmadi B, Bohnhoff M, Ben-Zion Y. 2016. Bimaterial interfaces at the Karadere segment of the North Anatolian Fault, northwestern Turkey. Journal of Geophysical Research:Solid Earth, 121(2): 931-950. DOI:10.1002/2015JB012601 |
Qin L, Ben-Zion Y, Qiu H, et al. 2018. Internal structure of the San Jacinto fault zone in the trifurcation area southeast of Anza, California, from data of dense seismic arrays. Geophysical Journal International, 213(1): 98-114. DOI:10.1093/gji/ggx540 |
Qiu H, Ben-Zion Y, Ross Z E, et al. 2017. Internal structure of the San Jacinto fault zone at Jackass Flat from data recorded by a dense linear array. Geophysical Journal International, 209(3): 1369-1388. DOI:10.1093/gji/ggx096 |
Sagy A, Brodsky E. 2009. Geometric and rheological asperities in an exposed fault zone. Journal of Geophysical Research:Solid Earth, 114(B2): B02301. DOI:10.1029/2008JB005701 |
Share P E, Ben-Zion Y, Ross Z E, et al. 2017. Internal structure of the San Jacinto fault zone at Blackburn Saddle from seismic data of a linear array. Geophysical Journal International, 210(2): 819-832. DOI:10.1093/gji/ggx191 |
Share P E, Ben-Zion Y. 2016. Bimaterial interfaces in the South San Andreas fault with opposite velocity contrasts NW and SE from San Gorgonio Pass. Geophysical Research Letters, 43(20): 10680-10687. DOI:10.1002/2016GL070774 |
Share P E, Ben-Zion Y. 2018. A bimaterial interface along the northern San Jacinto fault through Cajon Pass. Geophysical Research Letters, 45(21): 11622-11631. DOI:10.1002/2018GL079834 |
Share P E, Allam A A, Ben-Zion Y, et al. 2019. Structural properties of the San Jacinto fault zone at Blackburn Saddle from seismic data of a dense linear array. Pure and Applied Geophysics, 176(3): 1169-1191. DOI:10.1007/s00024-018-1988-5 |
Shi Z Q, Ben-Zion Y. 2006. Dynamic rupture on a bimaterial interface governed by slip-weakening friction. Geophysical Journal International, 165(2): 469-484. DOI:10.1111/j.1365-246X.2006.02853.x |
Stein S, Wysession M. 2003. An Introduction to Seismology, Earthquakes and Earth Structure. Oxford, UK: Wiley-Blackwell Publishing: 498.
|
Sun X Z, Xu X W, Chen L C, et al. 2012. Surface rupture features of the 2010 Yushu earthquake and its tectonic implication. Chinese Journal of Geophysics (in Chinese), 55(1): 155-170. DOI:10.6038/j.issn.0001-5733.2012.01.015 |
Sutherland R, Toy V G, Townend J, et al. 2012. Drilling reveals fluid control on architecture and rupture of the Alpine fault, New Zealand. Geology, 40(12): 1143-1146. DOI:10.1130/G33614.1 |
Ujiie K, Tanaka H, Saito T, et al. 2013. Low coseismic shear stress on the Tohoku-Oki megathrust determined from laboratory experiments. Science, 342(6163): 1211-1214. DOI:10.1126/science.1243485 |
Wang B S, Ge H K, Yang W, et al. 2012. Transmitting seismic station monitors fault zone at depth. EOS. Transactions American Geophysical Union, 93(5): 49-50. |
Wang B S, Yang H F, Peng Z G, et al. 2014. High-resolution aftershock distribution of 2010 MW6.9 Yushu, China earthquake and its implication. Abstract for SSA 2014 Annual Meeting.
|
Wang B S, Tian X F, Zhang Y P, et al. 2018. Seismic signature of an untuned large-volume airgun array fired in a water reservoir. Seismological Research Letters, 89(3): 983-991. DOI:10.1785/0220180007 |
Wang C Z, Wu J P, Fang L H, et al. 2013. The relationship between wave velocity structure around Yushu earthquake source region and the distribution of aftershocks. Chinese Journal of Geophysics (in Chinese), 56(12): 4072-4083. DOI:10.6038/cjg20131212 |
Wang M, Shen Z K, Gan W J, et al. 2008. GPS monitoring of temporal deformation of the Xianshuihe Fault. Science in China Series D:Earth Sciences, 51(9): 1259-1266. DOI:10.1007/s11430-008-0095-3 |
Wang S F, Fan C, Wang G, et al. 2008. Late Cenozoic deformation along the northwestern continuation of the Xianshuihe fault system, Eastern Tibetan Plateau. GSA Bulletin, 120(3-4): 312-327. DOI:10.1130/B25833.1 |
Wang Y Z, Wang E N, Shen Z K, et al. 2008. GPS-constrained inversion of present-day slip rates along major faults of the Sichuan-Yunnan region, China. Science in China Series D:Earth Sciences, 51(9): 1267-1283. DOI:10.1007/s11430-008-0106-4 |
Wen X Z, Xu X W, Zheng R Z, et al. 2003. Average slip-rate and recent large earthquake ruptures along the Garzê-Yushu fault. Science in China Series D:Earth Sciences, 46(S2): 276-288. |
Xu C, Xu X W, Yu G H. 2013. Landslides triggered by slipping-fault-generated earthquake on a plateau:an example of the 14 April 2010, MS7.1, Yushu, China earthquake. Landslides, 10(4): 421-431. DOI:10.1007/s10346-012-0340-x |
Yang H F, Li Z F, Peng Z G, et al. 2014. Low-velocity zones along the San Jacinto Fault, Southern California, from body waves recorded in dense linear arrays. Journal of Geophysical Research:Solid Earth, 119(12): 8976-8990. DOI:10.1002/2014JB011548 |
Yang H F. 2015. Recent advances in imaging crustal fault zones:areview. Earthquake Science, 28(2): 151-162. DOI:10.1007/s11589-015-0114-3 |
Yang W, Hauksson E, Shearer P. 2012. Computing a large refined catalog of focal mechanisms for Southern California (1981-2010):Temporal stability of the style of faulting. Bulletin of the Seismological Society of America, 102(3): 1179-1194. DOI:10.1785/0120110311 |
Yang W, Peng Z G, Wang B S, et al. 2015. Velocity contrast along the rupture zone of the 2010 MW6.9 Yushu, China, earthquake from fault zone head waves. Earth and Planetary Science Letters, 416: 91-97. DOI:10.1016/j.epsl.2015.01.043 |
Zhao P, Peng Z G. 2008. Velocity contrast along the Calaveras fault from analysis of fault zone head waves generated by repeating earthquakes. Geophysical Research Letters, 35(1): L01303. DOI:10.1029/2007GL031810 |
Zhao P, Peng Z G, Shi Z Q, et al. 2010. Variations of the Velocity Contrast and Rupture Properties of M6 Earthquakes along the Parkfield Section of the San Andreas Fault. Geophysical Journal International, 180(2): 765-780. DOI:10.1111/j.1365-246X.2009.04436.x |
Zhou R J, Ma C H, Cai C X. 1996. Late Quaternary active features of the Ganzi-Yushu fault zone. Earthquake Research in China (in Chinese), 12(3): 250-260. |
陈立春, 王虎, 冉勇康, 等. 2010. 玉树MS7.1级地震地表破裂与历史大地震. 科学通报, 55(13): 1200-1205. |
刘巧霞, 杨卓欣, 莘海亮, 等. 2012. 玉树MS7.1级地震部分余震重新定位及发震构造分析. 地球物理学报, 55(1): 146-154. DOI:10.6038/J.issn.0001-5733.2012.01.014 |
马玉虎, 马辉青. 2013. 巴颜喀拉块体强震活动与2010年玉树7.1级地震的关系. 高原地震, 25(1): 1-9. DOI:10.3969/j.issn.1005-586X.2013.01.001 |
孙鑫喆, 徐锡伟, 陈立春, 等. 2012. 2010年玉树地震地表破裂带典型破裂样式及其构造意义. 地球物理学报, 55(1): 155-170. DOI:10.6038/j.issn.0001-5733.2012.01.015 |
王长在, 吴建平, 房立华, 等. 2013. 玉树地震震源区速度结构与余震分布的关系. 地球物理学报, 56(12): 4072-4083. DOI:10.6038/cjg20131212 |
王敏, 沈正康, 甘卫军, 等. 2008. GPS连续监测鲜水河断裂形变场动态演化. 中国科学D辑:地球科学, 38(5): 575-581. |
王阎昭, 王恩宁, 沈正康, 等. 2008. 基于GPS资料约束反演川滇地区主要断裂现今活动速率. 中国科学D辑:地球科学, 38(5): 582-597. |
闻学泽, 徐锡伟, 郑荣章, 等. 2003. 甘孜-玉树断裂的平均滑动速率与近代大地震破裂. 中国科学(D辑), 33(S1): 199-208. |
周荣军, 马长浩, 蔡长星. 1996. 甘孜-玉树断裂带的晚第四纪活动特征. 中国地震, 12(3): 250-260. |
 2020, Vol. 63

