 2020, Vol. 63


2. 中国地震局地质研究所, 北京 100029
2. Key laboratory of Active Tectonics&Volcano, Institute of Geology, China Earthquake Administration, Beijing 100029, China
我国大陆是全球板内地震发生最为频繁的地区之一,在长达3000年的历史记载中,发生了140多次7级以上地震,其中包括了19次8级以上地震(闵子群等,1995;汪素云,1999),这些强震给当时当地的人民造成了巨大的人口伤亡和财产损失,如何减轻地震所引起的灾害对整个国民经济、人口社会等方面都具有重要的实际意义.20世纪中叶以来,我国在地球物理学和地震地质学研究基础上,逐渐发展了5个版本的全国烈度区划图或地震动参数区划图(李善邦,1957;邓起东等,1980;中国地震烈度区划图编委会,1992;胡聿贤,2001;高孟潭,2016),这些地震区划图为国民经济发展提供了重要保障.2008年汶川级联破裂型地震的发生,突破了既有地震危险性预测模型中基于历史地震破裂分段给出的预测结果,并造成了巨大的灾害.如何在新的地震危险性模型中考虑特大级联破裂的发生率具有重要的实际意义.
自Cornell(1968)使用泊松分布模型预测地震危险性以来,地震危险性概率分析(Probabilistic of Seismic Hazard Analysis, PSHA)陆续形成了标准的工作步骤(McGuire, 1976;1977),即根据区域地震活动与断层活动特征进行震源分区、历史地震整理与古登堡-里克特关系(G-R关系)中参数的计算(Gutenberg and Richter, 1944)及其在震源上的分配,地震动衰减关系的分析,使用概率模型对场地地震动预测方程的计算.断层震源模型是PSHA的基础,如美国加州地震概率工作组(Working Group on California Earthquake Probabilities, WGCEP)自1988年以来主要针对PSHA中的震源模型进行了广泛而深入的研究(WGCEP, 1988, 1990, 1995, 2003),并在加州地震统一破裂模型(Uniform California Earthquake Rupture Forcast)中加大了级联破裂的权重(WGCEP, 2008;Field et al., 2014, 2015);全美地震灾害分布图(Petersen et al., 2008),日本地震灾害预测模型(Koravos et al., 2006)等区域预测模型中对于级联破裂的考虑也主要基于定性的破裂组合和专家给出权重的方案上,目前还缺少科学定量的方法应用.
我国在前几代区划图基础上,第四代《中国地震动参数区划图(2001)》在泊松分布模型基础上,考虑了我国大陆板内地震时空不均匀性的特点,形成了“考虑地震活动时空不均匀性的概率地震危险性分析方法”(胡聿贤,2001);其中潜在震源区分为地震统计区和潜在震源区.2016年出版的《中国地震动参数区划图》(以下简称五代图)在上述基础上增加了地震背景源,强震主要分布在潜在震源区(断层源)内,背景地震源内主要分布着5级以下小震;在计算过程中,背景地震发生率平均分配到整个背景源内(潘华等,2013).上述模型均只考虑了断层分段或者历史地震破裂分段所引起的地震危险性,对于可能超过历史最大震级的特大级联破裂型地震发生率均没有考虑,因此不可避免地对某些特大地震的危险性欠缺考虑,而这些地震是灾难性的.另外, 我国在全球地震灾害评估项目(Global Seismic Hazard Assessment Program, GSHAP)(Zhang et al., 1999)也主要基于地震动区划图中潜在震源区展开, 同样缺少了对于特大强震的考虑.
本文选择活动断层发育程度高、强震活动频繁的川滇地区作为研究对象(图 1),采用地震危险性标准计算方法, 根据断裂活动特征,历史地震分布与震源机制解分布形态等对区域进行震源分区;综合GPS应变率场资料、断层滑动速率和统计地震学模型,建立考虑超过历史最大震级的特大地震的川滇地区地震危险性预测模型,并比较这一模型结果与现有五代图差别并进行分析.这一结果将为后续地震危险性预测分析提供依据.

|
图 1 (a) 川滇地区主要活动断裂与强震活动图(根据程佳等,2012修改); (b)川滇地区的震源分区划分特征 (a)NBWQLF西秦岭北缘断裂;EKLF东昆仑断裂带南东段;MJF岷江断裂;HYF虎牙断裂;LMSF龙门山断裂带;LRBF龙日坝断裂;QCF青川断裂;GZF甘孜断裂带;YSF玉树断裂带;XSHF鲜水河断裂带;ZMHF则木河断裂带;ANHF安宁河断裂带;XJF小江断裂带;DLSF大凉山断裂带;LTF理塘断裂带;JSJF金沙江断裂带;CHF程海断裂带;LXF小金河断裂带;ZDF中甸断裂带;QJF曲江断裂带;RRF红河断裂带;LL-RLF龙陵—瑞丽断裂带;NJF怒江断裂带;NTHF南汀河断裂带;HHF黑河断裂带;DLF打洛断裂带;DBFF奠边府断裂带;PEF普洱断裂.(b)中红色线段为震源分区分界线,灰色线条为活动断裂;沙滩球为1976—2019年4月MS 4.7以上地震震源机制解(www.globalcmt.org).震源区可分为:1缅甸俯冲带区;2滇西南震源分区;3川滇震源分区;4东南沿海震源分区;5华南震源分区;6龙门山震源分区;7喜马拉雅震源分区;8巴颜喀拉震源分区;9羌塘震源分区;10西秦岭震源分区;11汾渭震源分区. Fig. 1 (a) Main active faults and strong earthquakes in the Sichuan-Yunnan region (Cheng et al., 2012); (b) Seismic source zones in the Sichuan-Yunnan area (a) NBWQLF: West Qinling north boundary fault; EKLF: eastern Kunlun fault; MJF: Minjiang fault; HYF: Huya fault; LMSF: Longmenshan fault; LRBF: Longriba fault; QCF: Qingchuan fault; GZF: Garzê fault; YSF: Yushu fault; XSHF: Xianshuihe fault; ZMHF: Zemuhe fault; ANHF: Anninghe fault; XJF: Xiaojiang fault; DLSF: Daliangshan fault; LTF: Litang fault; JSJF: Jinshajiang fault; CHF: Chenghai fault; LXF: Xiaojinhe fault; ZDF: Zhongdian fault; QJF: Qujiang fault; RRF: Red River fault; LL-RLF: Longling-Ruili fault; NJF: Nujiang fault; NTHF: Nantinghe fault; HHF: Heihe fault; DLF: Daluo fault; DBFF: Dien Bian Phu fault; PEF: Pu′er fault. (b) The red solid lines are the boundaries of the Seismic source zones, while the gray ons show the active faults. Beach balls are the focal mechanisms in the global CMT catalog for the earthquakes larger than MS4.7 from 1976 to April 2019(www.globalcmt.org). The seismic source zones are as follows: 1 The Myanmar subduction seismic source zone; 2 The southwestern Yunnan seismic source zone; 3 The Sichuan-Yunnan seismic source zone; 4 The southeast coast seismic source zone; 5 The South China seismic source zone; 6 The Longmenshan seismic source zone; 7 The Himalaya seismic source zone; 8 The Bayan Har seismic source zone; 9 The Qiangtang seismic source zone; 10 The West Qinliang seismic source zone; 11 The Fenwei seismic source zone. |
川滇地区位于我国青藏高原向东挤出最强烈的部位.由于四川盆地的阻挡作用以及地壳下部流体作用的影响,川滇地区构造活动及其复杂(徐锡伟等,2003;程佳等,2012).这一地区不仅包括了整体向东挤出的巴颜喀拉块体东南部;还包括了围绕着东喜马拉雅构造结进行顺时针旋转最强烈的川滇块体,这一旋转作用在各个阶段呈现不同的地壳运动特征(Shen et al., 2005; Zheng et al., 2017).在这一复杂的构造机制下,川滇地区不同地区发育了不同类型的活动断裂;其中巴颜喀拉块体与四川盆地之间的龙门山断裂带以挤压作用为主,鲜水河—小江断裂带以左旋走滑作用为主,红河断裂带以右旋走滑作用为主,而红河以南地区则表现为北东向左旋走滑断裂和北西向右旋走滑断裂的共轭分布(徐锡伟等,2003;Wang et al., 1998; Lacassin et al., 2005).在上述地壳运动特征以及活动断裂作用下,川滇地区地震活动频繁;该地区发生了数十次7级以上历史地震,其中包括了2次8级地震,即1833年嵩明8级地震,2008年汶川8级地震.
对于川滇地区的震源划分上,我们沿用了程佳等(2012)在这一地区划分块体的思路,根据活动断裂、震源机制解和历史破裂特征进行震源分区划分;将活动断裂滑动性质和震源机制解相同,且不被其他较明显的构造切割的部分作为一个震源分区;在这一过程中,既保持震源分区内部的独立性,又考虑是否有足够多的历史地震计算出稳定的震级-频度关系.基于上述原则,本文将川滇地区(95°E—110°E, 18°N—35°N)划分成了11个震源分区(地震统计区)(见图 1b).在震源分区基础上,本文对川滇地区每个震源区内的历史地震分布进行统计分析,给出每个震源分内的震级-频度关系,并预测今后地震的发生率.
2 震源模型的构建流程在PSHA各种算法的研究基础上,全球地震模型(Global Earthquake Model, GEM)在2009年开发了地震危险性分析与灾害风险评估软件OpenQuake(Silva et al., 2014),在其中集成了地震危险性分析和灾害评估各个阶段应用最为广泛的算法,其中包括了地震灾害建模工具箱(Hazard Modeller′s Toolkit, HMTK)、地震动工具箱(Ground Motion toolkit, GMTK)、地震风险建模工具箱(Risk Modeller′s Toolkit,RMTK)和OpenQuake计算引擎.本文在全球地震模型(GEM)的地震灾害建模工具箱基础上,使用了Rong等(2017)提出的构造震源模型流程.其主要步骤如下:
(1) 历史地震目录与前处理
川滇地区历史地震活动频繁,较我国东部地区拥有更加丰富的地震资料,目录相对于我国西部其他地区完整度更高,这也是我们选择川滇地区来研究地震危险性预测模型的重要原因之一.在历史地震目录的选取上,Cheng等(2017)使用了一般正交回归方法得到的矩震级MW与面波震级MS间关系式,将所有其他震级(主要为MS)转换成MW并给出中国大陆统一的MW目录.这一目录包含了我国大陆公元前23世纪至2015年记录到的15708个MW大于4.0级以上事件,并包括了Weatherill等(2016)全球地震目录的其他事件.本文将使用这一目录来计算川滇地区的地震危险性.
首先我们使用了Gardner和Knopoff算法(1974)来分震级档除去特定时间和空间范围的余震(公式(1)和(2)),其中包括了余震、前震和震群;这一算法目前也在全球PSHA研究中被广泛采用(如Boyd, 2012).第二步是对地震完整性震级和时间进行定义.

|
(1) |
|
(2) |
图 2a显示的地震目录除余震的情况,蓝点是对使用Gardner和Knopoff(1974)除余震方法处理后得到的主震分布图.

|
图 2 (a) 地震目录显示的川滇地区主要地震事件(红色点)和余震(蓝色点),其中黄色五角星为2008年汶川M8地震震中; (b)川滇地区应变率分布图 Fig. 2 (a) The major earthquake events (red dots) and aftershocks (blue dots) in the Sichuan-Yunnan region in our used catalogue. Yellow star shows the epicenter of the 2008 M8 Wenchuan earthquake; (b) The strain rate distribution in the Sichuan-Yunnan region |
(2) 断层源模型
断层是整个震源区内地震发生的主要部位,特大地震一般都发生在主要大型活动断裂上,破裂长度随着震级而增加.在PSHA建模过程中,发震断层数据主要来源于活动断层,而很多发生中强地震(6级左右)的断裂可能会在活动断裂图上忽略;因此在建模中既要求地震发生率模型中特大地震可分配到大型活动断裂上,又要保证大型活动断裂足够长来安置这些特大地震的破裂长度.基于上述特征,本文没有采用以往常用的特征地震模型(Schwartz and Coppersmith, 1984; Wesnousky, 1994),而是主要根据了相关断层地表迹线上的阶区宽度等特征,尽可能的将一些主要断层作为一条大型断层进行处理,以便能够分配特大地震的发生率.在地震时间分布模型上,本文使用了泊松随机分布模型;在空间上则允许破裂可沿较长断层面上以5 km网格滑动(Pagani et al., 2014).
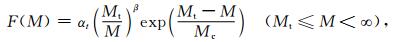
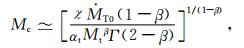
本文将使用断层滑动速率来描述断层上地震发生率积累特征.在方法上使用了OpenQuake中集成的截断型G-R关系(Youngs and Coppersmith, 1985),将滑动速率转换为断层面积累的各震级年发生率.在这一模型中,需要给出最大震级(由破裂长度或破裂面积根据统计关系给出)、最小震级(指定断层上发生的最小震级)、b值、a值.为了对震源分区的最大地震进行控制,使用了锥形古登堡-里克特关系(Tapered Gutenberg-Richter relationship,TGR)(Kagan, 2002),TGR认为地震在中、小震级服从一般性G-R直线关系,而在大于某个震级后地震发生率对数不会继续直线增加,而是随着震级的增加而加速衰减;其在G-R关系原有的a、b值基础上,增加了mc(corner magnitude)这个控制曲线变化的未知量.根据GPS应变率计算出,并得到特大地震的发生率(公式(3)和公式(4)):
|
(3) |
其中M单位为N·m,F(M)为地震矩大于M的地震发生率,β=2b/3,Mc(corner moment)(mc对应的地震矩),主要控制M在上限范围内的分布.Mt是完整性目录最小地震的地震矩,αt为是地震矩大于和等于Mt的地震所对应的地震发生率.Mc可以通过地震矩守恒准则来估算.
|
(4) |

|
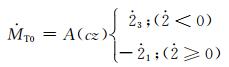
(5) |
其中A为网格面积,(cz)为平均耦合发震层深度,c为耦合度,z为发震层深度(单位:km).
在地震分配率计算中,川滇地区最新GPS资料给出的应变率场数据来源于沈正康(内部交流,图 2b),并使用Shen等(2015)应变率计算方法得到.本文在除余震后,使用Stepp方法(Stepp, 1972)对每个震源分区的完整性时间进行分析,并根据Weichert方法(Weichert,1980)计算了各震源分区的G-R关系中的a值和b值,然后在TGR关系中根据各震源分区应变率场资料计算mc(表 1).由于应变率场只是地表能量积累情况,而地震能量的积累则是整个块体地表到某个深度内的能量积累情况,因此我们使用了公式(5)中耦合度c和发震层深度z的乘积给出GPS反映的整个块体能量积累情况.在这一厚度值选取上,使用了一个重要的估算原则,即整个震源区发生特大地震的主要断层均在我们的断层库中,且这些断层速率已知.根据这一假定,如图 3可以根据cz的大小平移TGR的曲线,使得其恰好封闭所有断层积累总的地震发生率曲线(图 3中蓝色曲线),即保证整个震源区的特大地震都发生在断层上,由此推算出cz值(表 1).然后将每个震源分区内总的地震发生率(GPS应变率)和断层上地震发生率(滑动速率)之差归结到震源分区背景发生率上(图 4);并使用空间光滑地震活动性方法(Frankel et al., 1995)将这一背景地震发生率分配到整个震源分区内,即根据历史地震活动的空间和强度特征以及震级-频度关系来分配这一背景地震活动性.
|
|
表 1 川滇地区主要震源分区a值、b值、mc值以及发震层深度z和耦合系数表 Table 1 Parameters including the a value, b value, corner magnitude (mc), seismogenic depth (z), and the coefficient ratio (c) for each seismic source zone |

|
图 3 川滇震源分区断层累积速率与GPS给出的应变率累积速率之间的关系 (a)年发生率分布;(b)超越概率分布.其中b值为0.76;红色圆点为区域内地震给出的震级-频度关系;红色虚线为GPS应变率转化成各震级理论累积率;绿色实线为震源分区内各断裂给出的各震级累积率;蓝色直线为各断裂带总计的各震级理论累积率.其中sf415鲜水河断裂带北西段;sf437小江断裂带北段;sf438小江断裂带南段西支;sf435鲜水河断裂带南东段;sf72安宁河断裂;sf73则木河断裂带;sf71折多塘断裂;sf33小江断裂带南段东支;sf37红河断裂带;sf68色拉哈断裂;sf83丽江—小金河断裂;sf34曲江断裂带;sf62大凉山断裂带北段;sf67大凉山断裂带南段;sf81昔格达断裂北段;sf36昔格达断裂南段;sf464甘孜断裂带;sf69雅拉河断裂;sf76玉农希断裂;sf434理塘断裂带;sf31奠边府断裂. Fig. 3 The relationship between the cumulative seismicity rate transferred from the slip rate of each fault and the cumulative seismicity rate from the strain rate field from GPS data in the Sichuan-Yunnan seismic source zone (a) Annual occurrence rate distribution on each fault and the seismic source zone; (b) Exceedance probability distribution. The calculated b vaule of the seismic source zone is 0.76. The red dot is the magnitude-frequency relationship calculated from the historical earthquake catalog; the red dashed line is the cumulative seismicity rate of each magnitude for the seismic source zone converted from the GPS strain rate data; the green solid line is the cumulative seismicity rate for each fault transferred from the slip rate of the fault; the blue line the is the cumulative seismicity rate for the earthquakes on all the faults in the seismic source zone. In the figure, sf415: the northwestern section of the Xianshuihe fault; sf437: the northern section of the Xiaojiang fault; sf438: the west branch of the south section of the Xiaojiang fault; sf435: the southeastern section of the Xianshuihe fault; sf72: the Anninghe fault; sf73: the Zemuhe fault; sf71: the Zheduotang fault; sf33: the east branch of the south section of the Xiaojiang fault; sf37: the Red River fault; sf68: the Selaha fault; sf83: the Lijiang-Xiaojinhe fault; sf67: the south section of the Daliangshan fault; sf81: the north section of the Xigeda fault; sf36: the south section of the Xigeda fault; sf464: the Garzê fault; sf69: the Yalahe fault; sf76: the Yunongxi fault; sf434: the Litang fault; sf31: the Dian Bien Phu fault. |

|
图 4 川滇震源分区断裂源与背景地震源分布示意图 (a)断层源分布特征;(b)地震活动性平滑获取背景地震发生率,其中白色圆点为除余震后的MW≥4.5历史地震. Fig. 4 The seismogenic fault source and background seismicity zone of the Sichuan-Yunnan seismic source zone (a) The seismogenic fault source; (b) The background seismicity rate from the smoothed seismicity method, in which white dots are the MW≥4.5 earthquakes after the declustering. |
(3) 震源分区地震发生率模型
在前述基础上,本文给出了川滇地区各震源分区的地震发生率模型.以下以川滇震源分区为例进行展示.
川滇震源分区主要包括了川滇菱形块体(阚荣举等,1977)的东部,区域以鲜水河断裂带、安宁河断裂带、则木河断裂带和小江断裂带等高速左旋走滑断裂为主,该震源分区也包括了大凉山次级块体区域(程佳等,2014).川滇震源分区a值为4.21,b值为0.76,mc为7.8.对于断裂上可能发生的最大地震(Mmax),本文使用了Wells和Coppersmith(1994)的震级与破裂长度的关系.图 3中红色虚线为根据应变率年累积率和TGR关系曲线所给出的各震级年发生率,而黄色实线为震源分区内各断裂根据各自滑动速率和Youngs和Coppersmith(1985)公式转换为的地震发生率曲线,蓝色实线则为黄色实线之和.根据红色虚线与蓝色实线的对应情况得到川滇震源分区发震层深度与耦合系数乘积c×z为25 km,这一值较其他震源分区高.这一高值显示鲜水河—小江断裂带这一深大断裂在积累能量上较其他断层厚度更大.其他震源分区的发震层深度和耦合系数的乘积基本都在16 km左右.图 3中蓝色实线与红色虚线基本吻合,这一结果可保证7.8级以上地震基本发生在断裂上,但也不排除其他在图 3中被默认为速率为0.01 mm·a-1的断裂上发生7.8级及以下地震的可能.对于蓝色实线与红色虚线吻合程度不高时, 则一般综合小震重新定位的发震层深度、相邻震源分区的深度给出相近结果.
在断层发生率的分配上,主要分配了6.5级及以上的强震,其最大地震主要根据断层破裂长度的统计关系计算.对于一些只有部分长度位于某震源分区内的断裂,则根据在各震源内的面积百分比来计算所积累的地震矩积累量,而断裂上各震级的地震发生率分配仍然以断裂所能发生的最大震级与每个震源分区的a、b值来分配.背景地震发生率则为根据应变率积累率转换出的震源分区各震级档频次累积率,与震源分区内所有断裂滑动速率所计算的地震矩累积率转换成的各震级频次之间差值得到(图 3a);在地震发生率平滑方法中使用了高斯空间平滑方法,使用了10 km×10 km网格化处理,并50 km作为平滑半径,这一半径来自于美国中东部的推荐结果(Moschetti, 2015).图 4为使用OpenQuake的HMTK工具箱将川滇震源分区划分成的断层源和背景地震源.
3 模型计算结果基于上述所建立的断层地震源和背景地震源模型、地震发生率模型,使用OpenQuake计算引擎计算了川滇地区的地震危险性所引起的PGA分布图.
在地震动预测方程(Ground Motion Prediction Equations, GMPEs)的选取上,由于我国强震动数据的记录相对较少,样本不足以用来回归相关统计关系来得到各区域的衰减关系,五代图使用了胡聿贤等(2001)的转换方法得到中国大陆各分区地震动衰减关系;其主要思路是根据美国西部的地震动衰减关系和地震烈度衰减关系之间的对应情况,将我国的地震烈度衰减关系转换为地震动衰减关系,并使用包括汶川地震等强震动数据进行了校正;在场地上选取了VS30=500 m·s-1的基岩场地条件(俞言祥等, 2013).本文使用了Dangkua等(2018)在对中国大陆PGA的分析后推荐使用的逻辑树模型,即:ASK14(Abrahamson et al., 2014), BSSA14(Boore et al., 2014), CB14(Campbell and Bozorgnia, 2014)和CY14(Chiou and Yongs, 2014),权重均等于0.25;在VS30的选取上, 统一选取了VS30=760 m·s-1的基岩场地条件(Seyhan and Stewart, 2014).基于上述模型与参数,在OpenQuake中计算了这一模型下的PGA分布特征.本文设置计算PGA的截断最大距离为200 km(浅层地壳地震活动程度较高地区),即计算过程中考虑最大为200 km距离内震源所造成的灾害情况.我们使用了泊松随机分布模型(Cornell, 1968),分别计算50年内超越概率为10%(475年一遇)的断裂上地震发生各震级个数所产生的PGA分布(图 5a)以及背景地震模型中各震级发生率所产生的PGA分布(图 5b).

|
图 5 (a) 川滇地区基于断层上地震发生率所产生的PGA分布图(其中数字代表断层的滑动速率); (b)背景地震发生率所引起的PGA分布图(475年)(绿色圆点为余震除去后MW4.0以上地震) Fig. 5 (a) The distribution map of PGA based on the occurrence rate on the faults (475 years) in the Sichuan-Yunnan region, where the numbers represent the slip rate of the faults; (b) The distribution map of PGA based on the background seismicity rate (475 years), the green dot is the earthquake with larger than MW4.0 after the earthquake declustering |
图 5a为断裂上地震活动所产生的PGA分布图.川滇地区除远离断裂带的华南块体内部外,其他地区断裂引起的峰值加速度均较高;PGA较大的地区一般都集中在了大型高速断裂带上,如鲜水河—小江断裂带,其周边的PGA值一般均大于0.4 g.对于极易发生级联破裂的鲜水河断裂带、安宁河断裂带、则木河断裂带、小江断裂带,由于本文并没有进行详细分段,而是根据较大的断层分段展开,震源分区内主要强震和特大级联破裂型地震均被分配到这些断裂上,因此这些断裂周边的PGA值较大, 且具有连续性.这与五代图中断裂上PGA仅在历史地震破裂段呈现高值的情况具有明显不同, 避免了滑动速率较大的断裂由于历史上没有发生地震而导致的PGA分布较低的情况出现.由于断裂滑动速率较小,龙门山断裂带附近断裂地震源的地震发生率并不高,仅在龙门山中段存在着一个相对高值区,其主要原因为该地区4条平行断裂均具有一定的滑动速率(汶川—茂汶断裂,1.1 mm·a-1;龙门山主边界断裂,0.9 mm·a-1;北川—映秀断裂,走滑速率1 mm·a-1;安县—灌县断裂,0.4 mm·a-1).这些断裂所分配的地震在该区域进行了叠加作用,使得在龙门山断裂带中部形成了一个较高值;其他活动性较高的断裂也存在着较高的PGA预测值.断层给出的结果主要反映了长期应力加载下,区域特大地震发生概率,而这一过程可能需要较长的时间.因为特大地震年发生率可能仅为万年一遇或者更低,如龙门山震源分区给出的MW8.0地震发生率仅为6×10⁻⁵,即1.7万年1次(图 3a),与汶川MW7.9同级别地震则约为5000年一遇.
通过空间平滑分析地震活动性所得到的背景地震发生率则主要是对历史地震空间分布的反映,图 5b为地震活动性空间平滑分析后背景地震发生率所引起的预测PGA结果,其中绿色圆点为5级以上地震.从这一结果看,在川滇地区基本与断层引起的PGA分布(图 5a)相似;除远离断裂带的华南块体内部外,其他背景地震发生率所显示的PGA值也较高.在川滇地区北部高值区主要集中在鲜水河断裂和龙门山断裂带附近,而在川滇南部则出现多处高值区.龙门山断裂带中段高值区不仅发生了2008年汶川地震,还发生了1933年叠溪地震;这两次强震触发的周边小规模断裂上的中等地震活动较多,因此这一区域的预测值较高.在红河断裂带北端的丽江—小金河断裂、程海断裂等附近区域存在着背景地震发生率所引起的高值区,这与该地区拉张构造环境下断裂密集分布有关.这种高值区还包括滇西南的盈江地区,这一地区位于腾冲火山区,构造极其复杂,中等浅源地震活动频繁,与印度板块对缅甸弧的俯冲后物质上涌有着重要的关联(Lei et al., 2012).这些PGA预测高值区还包括了滇南普洱断裂附近地区(NE走向与SW走向的两组共轭断裂丛生)、曲江断裂带与通海断裂带交会处(1970年通海MS7.8地震)、马边断裂带与莲峰断裂带交会处(1974年大关MS7.1地震).从上述区一般对应背景地震发生率高值的情况可以看出,诸如汶川地震这样的强震,其释放的能量可能是多条断层总能量的叠加.由于本文使用的仅仅是一条或者两条已知滑动速率断裂的资料(北川—映秀断裂,滑动速率为1.0 mm·a-1;茂汶—汶川断裂,滑动速率为1.1 mm·a-1,龙门山主边界断裂0.9 mm·a-1),断裂不足以概括历史地震目录中所有地震引起的地震活动性.在鲜水河断裂带这样的大型走滑断裂带附近,由于断裂单一且清晰,该地区背景地震发生率所引起的PGA值高值区则一般不明显.
综合图 5a和5b中的各点PGA预测值,可以得到本文计算的川滇地区重现期为475年的PGA分布图(图 6).图 6结果在整个分布上与图 5b给出的背景地震发生率引起的PGA分布相似,而PGA预测高值区则基本位于断裂附近.甘孜—玉树断裂带、鲜水河断裂带、则木河断裂带、小江断裂带、东昆仑断裂带东段具有大于0.4 g的值;这是因为大型断裂带长度较长且滑动速率大,在本文的模型中分配了应变率和断层速率根据G-R关系进行地震频次分配所得到的特大地震.从PGA分布图看,龙门山断裂带相对于鲜水河断裂等滑动速率较大的断裂而言相对较小,这是因为断裂滑动速率对区域地震能量积累起着关键作用;因为在McGuire(1976)给出的地震动超越概率公式中,地震动超越概率为地震年发生率、地震动衰减关系、震级和距离各自的概率分布函数的乘积;因此计算出的PGA不仅和震级有关,还与该震级的地震发生率以及使用的概率公式等有关;龙门山断裂带中段的PGA预测高值区,与背景地震发生率PGA结果类似,显示这一地区在地震活动性上较龙门山断裂带西段和东段更为活跃;当然这一高值中也包括了虎牙断裂带和岷江断裂带对这一地区影响值.其他高值区基本与图 5b给出的结果类似,集中在红河断裂带北端的丽江—小金河断裂、程海断裂等附近区域、滇西的盈江地区、普洱断裂带等区域.另外,在大凉山断裂带以西到马边断裂一带也存在着一个PGA预测值较高区域,该区域背景地震发生率较高,而区域内多条与马边断裂平行的NW向断裂速率较低而很难得到.在实皆断裂带沿线的PGA预测值较高,其中包括了在喜马拉雅东构造节附近呈现大面积的高值区,显示实皆断裂尤其是喜马拉雅构造带也是未来强震危险程度较高的区域.

|
图 6 川滇地区地震发生率模型所引起的PGA分布图 (a)本文模型结果;(b)五代图结果. Fig. 6 PGA distribution map induced by the seismicity rate model in Sichuan-Yunnan region (a) Our result; (b) The result of the Seismic ground motion parameter zonation map of China (Gao et al., 2016). |
与五代图的方法相比,本文使用了断裂滑动速率与震源分区内应变率积累比较的方法来分配地震发生率,并允许了超过历史最大震级的特大地震发生,计算了川滇地区PGA分布图;五代图则主要基于潜在震源区(历史地震破裂区和破裂分段)展开.在背景地震发生率上本文使用了区域应变率积累与断层应变率积累之差得到,并通过地震率平滑方法分配这些地震发生率.这一方法科学定量的给出特大级联破裂型地震发生率,对断层上PGA分布进行了控制;而在断层之外则通过地震发生率平滑方法给出分散的PGA结果.五代图将中强震都归纳到具体的破裂震源上,对于更小的地震主要是均匀分布到震源分区内.因此,本文的方法既在主干断层上对级联破裂引起的PGA值进行了重塑,又兼顾了中强震多发区PGA的弥散分布特征,并科学合理的避免了由于人工干预而造成的不可靠性.
从本文结果(图 6a)与五代图(图 6b)比较看(图中颜色代表的数值相同),本文结果明显较高,其原因有:
本文考虑了更大地震的破坏,尤其是根据TGR关系和应变率计算出各震级档地震发生率,其中包括了大于8.0级地震,即便这些地震发生的概率和超越概率很小.本文着眼于地震模型对于特大强震的预测,考虑到区域历史地震记录时间与整个区域大的地震循环周期相比太短,而对区域最大地震的认识相对片面,地震是否贯穿断层间的分段标志目前仍然尚无定论.本文在处理断裂时没有利用较小的断层间分段标志来划分断层段,这样也导致了断层上的最大地震较大.另外,五代图在震级处理上选择使用代表性震级方法也相应地降低了区域地震矩释放率;五代图使用的GMPEs在距离小于80 km时较本文GMPEs的逻辑树模型结果更大,在大于80 km时,五代图则衰减更快.
从PGA预测值的形状看,本文基于断裂错动和背景地震发生率的综合结果较五代图差异明显,其形状在很多地区并不与小区域内主要断层呈现较高的吻合,如龙陵—澜沧断裂带周边, 滇西南普洱断裂周边.五代图主要基于潜在震源区展开,几乎所有的强震都被分配到潜在震源区内,因此其结果与断层的吻合程度更高.另外地震目录定位的误差也对结果有很大的影响,有些仪器记录到的地震很难根据定位来确定其归属哪条断裂;历史地震根据烈度中心给出的定位结果也易导致其发震断层归属存在误差.因此不管是本文结果还是五代图均有赖于历史地震研究详细程度以及仪器定位的准确性的进一步提高.
基于上述结果,本文综合GPS数据、地震数据、活动断层数据等,建立了川滇地区新的震源及其发生率模型,着眼于对未来特大强震的考虑,使用GPS应变率和锥形G-R方法计算了区域特大地震发生率,并通过震源与断层上地震发生率之差给出背景地震发生率,最终计算了PGA分布图,这一结果将为区域地震危险性分析和建模提供依据.
致谢 感谢FM Global自然灾害研究中心Yufang Rong博士和Harold Magistrale博士对本文作者在模型建立方法上的指导.
AbrahamsonN A, SilvaW J, Kamai R. 2014. Summary of the ASK14 ground motion relation for active crustal regions. Earthquake Spectra, 30(3): 1025-1055. DOI:10.1193/070913EQS198M |
Bird P, Kreemer C, Holt W E. 2010. A long-term forecast of shallow seismicity based on the Global Strain Rate Map. Seismological Research Letters, 81(2): 184-194. DOI:10.1785/gssrl.81.2.184 |
Bird P, Kreemer C. 2015. Revised tectonic forecast of global shallow seismicity based on version 2.1 of the Global Strain Rate Map. Bulletin of the Seismological Society of America, 105(1): 152-166. DOI:10.1785/0120140129 |
Boore D M, Stewart J P, Seyhan E, et al. 2014. NGA-West2 equations for predicting PGA, PGV, and 5% damped PSA for shallowcrustal earthquakes. Earthquake Spectra, 30(3): 1057-1085. DOI:10.1193/070113EQS184M |
Boyd O S. 2012. Including foreshocks and aftershocks in time-independent probabilistic seismichazard analyses. Bulletin of the Seismological Society of America, 102(3): 909-917. DOI:10.1785/0120110008 |
Campbell K W, Bozorgnia Y. 2014. NGA-West2 ground motion model for the average horizontal components of PGA, PGV, and 5% damped linear acceleration response spectra. Earthquake Spectra, 30(3): 1087-1115. DOI:10.1193/062913EQS175M |
Cheng J, Xu X W, Gan W J, et al. 2012. Block model and dynamic implication from the earthquake activities and crustal motion in the southeastern margin of Tibetan Plateau. Chinese Journal of Geophysics (in Chinese), 55(4): 1198-1212. DOI:10.6038/j.issn.0001-5733.2012.04.016 |
Cheng J, Liu J, Xu X W, et al. 2014. Tectonic Characteristics of strong earthquakes in Daliangshan sub-block and impact of the MS6.5 Ludian earthquake in 2014 on the surrounding faults. Seismology and Geology (in Chinese), 36(4): 1228-1243. |
Cheng J, Rong Y F, Magistrale H, et al. 2017. An Mw-based historical earthquake catalog for mainland China. Bulletin of the Seismological Society of America, 107(5): 2490-2500. DOI:10.1785/0120170102 |
Chiou B S, YoungsR R. 2014. Update of the chiou and youngs NGA model for the average horizontalcomponent of peak ground motionand response spectra. Earthquake Spectra, 30(3): 1117-1153. DOI:10.1193/072813EQS219M |
Cornell C A. 1968. Engineering seismic risk analysis. Bulletin of the Seismological Society of America, 58(5): 1583-1606. |
Dangkua D T, Rong Y F, Magistrale H. 2018. Evaluation of NGA-West2 and Chinese ground-motion prediction equations for developing seismic hazard maps of mainland China. Bulletin of the Seismological Society of America, 108(5A): 2422-2443. DOI:10.1785/0120170186 |
Deng Q D, Zhang Y M, Huan W L, et al. 1980. Principles and methods of composing the Seismic Zoning Map of China. Acta Seismologica Sinica (in Chinese), 2(1): 90-110. |
Field E H, Arrowsmith R J, Biasi G P, et al. 2014. Uniform California earthquake rupture forecast, version 3 (UCERF3)-the time-independent model. Bulletin of the Seismological Society of America, 104(3): 1122-1180. DOI:10.1785/0120130164 |
Field E H, Biasi G P, Bird P, et al. 2015. Long-term time-dependent probabilities for the third UniformCalifornia Earthquake Rupture Forecast (UCERF3). Bulletin of the Seismological Society of America, 105(2A): 511-543. DOI:10.1785/0120140093 |
Frankel A, ThenhausP, Jacob K. 1995. Seismic hazard mapping in the northeastern United States. NceerBulletin, 9(1): 13-16. |
Gao M. 2016. Propaganda Materials for the Seismic Ground Motion Parameter Zonation Map of China (GB 18306-2015) (in Chinese). Beijing: China Standards Press.
|
Gardner J K, Knopoff L. 1974. Is the sequence of earthquakes in Southern California, with aftershocks removed, Poissonian?. Bulletin of the Seismological Society of America, 64(5): 1363-1367. |
Gutenberg B, Richter C F. 1944. Frequency of earthquakes in California. Bulletin of the Seismological Society of America, 34(4): 185-188. |
Hu Y. 2001. GB 18306-2001 Propaganda Materials for the Seismic Ground Motion Parameter Zonation Map of China (in Chinese). Beijing: China Standards Press.
|
Kagan Y Y. 2002. Seismic moment distribution revisited:Ⅱ. Momentconservation principle. Geophysical Journal International, 149(3): 731-754. DOI:10.1046/j.1365-246X.2002.01671.x |
Kan R J, Zhang S C, Yan F, et al. 1977. Present tectonic stress field and its relation to the characteristics of recent tectonic activity in southwestern China. Acta Geophysica Sinica (in Chinese), 20(2): 96-109. |
Koravos G C, Tsapanos T M, Bejaichund M. 2006. Probabilistic seismic hazard assessment for Japan. Pure and Applied Geophysics, 163(1): 137-151. DOI:10.1007/s00024-005-0003-0 |
Lasserre C, Peltzer G, Crampé F, et al. 2005. Coseismic deformation of the 2001 MW=7.8 Kokoxili earthquake in Tibet, measured by synthetic aperture radar interferometry. Journal of Geophysical Research:Solid Earth, 110(B12): B12408. DOI:10.1029/2004JB003500 |
Lee S P. 1957. The map of seismicity of China. Acta Geophysica Sinica (in Chinese), 6(2): 127-156. |
Min Z, Wu G, Jiang Z, et al. 1995. The Catalogue of Chinese Historical Strong Earthquakes (B.C.2300-A.D.1911) (in Chinese). Beijing: Seismological Press: 8-270.
|
McGuire R K. 1976. Fortran computer program for seismic risk analysis. USGS, Open-File Report, 76-67, doi: 10.3133/ofr7667(https://pubs.er.usgs.gov/publication/ofr7667).
|
McGuire R K. 1977. Seismic design spectra and mapping procedures using hazard analysis based directly on oscillator response. Earthquake Engineering & Structural Dynamics, 5(3): 211-234. |
Moschetti M P. 2015. A long-term earthquake rate model for the Central and Eastern United States from Smoothed Seismicity. Bulletin of the Seismological Society of America, 105(6): 2928-2941. DOI:10.1785/0120140370 |
Pagani M, Monelli D, Weatherill G, et al. 2014. OpenQuakeengine:an open Hazard (and Risk) software for the global earthquake model. Seismological Research Letters, 85(3): 692-702. DOI:10.1785/0220130087 |
Pan H, Gao M T, Xie F R. 2013. The earthquake activity model and seismicity parameters in the new seismic hazard map of China. Technology for Earthquake Disaster Prevention (in Chinese), 8(1): 11-23. |
Petersen M D, Frankel A D, Harmsen S C, et al. 2008. Documentation for the 2008 update of the United States National Seismic Hazard Maps.U.S. Geological Survey, Open-File Report 2008-1128.Reston, VA.: U.S. Geological Survey.
|
Rong Y, Pagani M, Magistrale H, et al. 2017. Modeling seismic hazard by integrating historical earthquake, fault, and strain rate data.//Proceedings of the 16th World Conference on Earthquake Engineering. Santiago, Chile.
|
Schwartz D P, Coppersmith K J. 1984. Fault behavior and characteristic earthquakes:Examples from the Wasatch and San Andreas Fault Zones. Journal of Geophysical Research:Solid Earth, 89(B7): 5681-5698. DOI:10.1029/JB089iB07p05681 |
Seyhan E, Stewart J P. 2014. Semi-empirical nonlinear site amplification from NGA-West2data and simulations. Earthquake Spectra, 30(3): 1241-1256. DOI:10.1193/063013EQS181M |
Shen Z K, Wang M, Zeng Y H, et al. 2015. Optimal interpolation of spatially discretized geodetic data. Bulletin of the Seismological Society of America, 105(4): 2117-2127. DOI:10.1785/0120140247 |
Shen Z K, LV J N, Wang M, et al. 2005. Contemporary crustal deformation around the southeast borderland of the Tibetan Plateau. Journal of Geophysical Research:Solid Earth, 110(B11): B11409. DOI:10.1029/2004JB003421 |
Silva V, CrowleyH, Pagani M, et al. 2014. Development of the openquake engine, the global earthquake model's open-source software for seismic risk assessment. Natural Hazards, 72(3): 1409-1427. DOI:10.1007/s11069-013-0618-x |
Stepp J C. 1972. Analysis of completeness of the earthquake sample in the Puget Sound area and its effect on statistical estimates of earthquake hazard.//Proceedings of the 1st International Conference on Microzonazion.Seattle, Wash, USA: U.S. Geological Survey, 897-909.
|
The Compiling Committee of Seismic Zoning Map in China. 1992. Seismic Intensity Zoning Map of China (1990) and its explanations. Earthquake Research in China (in Chinese), 8(4): 1-11. |
Wang E, Burchfiel B C, Royden L H, et al. 1998. Late Cenozoic Xianshuihe-Xiaojiang, Red River, and Dali Fault systems of southwestern Sichuan and Central Yunnan, China. Geological Society of America Special Paper, 327. |
Wang S Y, Wu G, Jiang Z X, et al. 1999. The Catalogue of Recent Earthquakes in China (A.D. 1912-A.D. 1990) (in Chinese). Beijing: China Science and Technology Publishing House.
|
Weatherill G A, PaganiM, Garcia J. 2016. Exploring earthquake databases for the creation of magnitude-homogeneous catalogues:tools for application on a regional and global scale. Geophysical Journal International, 206(3): 1652-1676. DOI:10.1093/gji/ggw232 |
Weichert D H. 1980. Estimation of the earthquake recurrence parameters for unequal observation periods for different magnitudes. Bulletin of the Seismological Society of America, 70(4): 1337-1346. |
Wells D L, Coppersmith K J. 1994. New empirical relationships among magnitude, rupture length, rupture width, rupture area, and surface displacement. Bulletin of the Seismological Society of America, 84(4): 974-1002. |
Wesnousky SG. 1994. The Gutenberg-Richter or characteristic earthquake distribution, which is it?. Bulletin of the Seismological Society of America, 84(6): 1940-1959. |
Working Group on California Earthquake. 1988. Probabilities of large earthquakes occurring in California on the San Andreas fault. U.S.Geol.Surv., Open-File Report, pp. 88-398. https://www.resolutionmineeis.us/sites/default/files/references/wgcep-1988.pdf
|
Working Group on California Earthquake Probabilities. 1990. Probabilities of Large Earthquakes in the San Francisco. Bay. Region, California. U.S. Geological Survey Circular, 1053. (https://pubs.er.usgs.gov/publication/cir1053.)
|
Working Group on California Earthquake Probabilities. 1995. Seismic hazards in southern california:probable earthquakes, 1994 to 2024. Bulletin of the Seismological Society of America, 85(2): 379-439. |
Working Group on California Earthquake Probabilities. 2003. Earthquake probabilities in the San Francisco bay region: 2002-2031. U.S. Geological Survey, Open-File Report, 03-214 (https://pubs.usgs.gov/of/2003/of03-214/).
|
Working Group on California Earthquake Probabilities. 2008. The Uniform California Earthquake Rupture Forecast, Version 2 (UCERF 2). U.S. Geological Survey Open-File Report 2007-1437 and California Geological Survey Special Report 203 (http://pubs.usgs.gov/of/2007/1091/).
|
Xu X W, Wen X Z, Zheng R Z, et al. 2003. Pattern of latest tectonic motion and its dynamics for active blocks in Sichuan-Yunnan region, China. Science in China Series D:Earth Sciences, 46(2): 210-226. |
Youngs R R, Coppersmith K J. 1985. Implications of fault slip rates and earthquake recurrence models to probabilistic seismic hazard estimates. Bulletin of the Seismological Society of America, 75(4): 939-964. |
Yu Y X, Li S Y, Xiao L. 2013. Development of ground motion attenuation relations for the new seismic hazard map of China. Technology for Earthquake Disaster Prevention (in Chinese), 8(1): 24-33. |
Zhang P Z, Yang Z X, Gupta H K, et al. 1999. Global seismic hazard assessment program (GSHAP) in continental Asia. Annali Di Geofisica, 42(6): 1167-1190. |
Zheng G, Wang H, Wright T J, et al. 2017. Crustal Deformation in the India-Eurasia collision zone from 25 years of GPS measurements. Journal of Geophysical Research:Solid Earth, 122(11): 9290-9312. DOI:10.1002/2017JB014465 |
程佳, 徐锡伟, 甘卫军, 等. 2012. 青藏高原东南缘地震活动与地壳运动所反映的块体特征及其动力来源. 地球物理学报, 55(4): 1198-1212. DOI:10.6038/j.issn.0001-5733.2012.04.016 |
程佳, 刘杰, 徐锡伟, 等. 2014. 大凉山次级块体内强震发生的构造特征与2014年鲁甸6.5级地震对周边断层的影响. 地震地质, 36(4): 1228-1243. |
邓起东, 张裕明, 环文林, 等. 1980. 中国地震烈度区划图编制的原则和方法. 地震学报, 2(1): 90-110. |
高孟潭. 2016. GB 18306-2015《中国地震动参数区划图》宣贯教材. 北京: 中国标准出版社.
|
胡聿贤. 2001. GB 18306-2001《中国地震动参数区划图》宣贯教材. 北京: 中国标准出版社.
|
阚荣举, 张四昌, 晏凤桐, 等. 1977. 我国西南地区现代构造应力场与现代构造活动特征的探讨. 地球物理学报, 20(2): 96-109. |
李善邦. 1957. 中国地震区域划分图及其说明I.总的说明. 地球物理学报, 6(2): 127-156. |
闵子群, 吴戈, 江在雄, 等. 1995. 中国历史地震目录(公元前23世纪-公元1911年). 北京: 地震出版社.
|
潘华, 高孟潭, 谢富仁. 2013. 新版地震区划图地震活动性模型与参数确定. 震灾防御技术, 8(1): 11-23. DOI:10.3969/j.issn.1673-5722.2013.01.002 |
汪素云, 吴戈, 时振梁, 等. 1999. 中国近代地震目录(公元1912-1990). 北京: 中国科学技术出版社.
|
徐锡伟, 闻学泽, 郑荣章, 等. 2003. 川滇地区活动块体最新构造变动样式及其动力来源. 中国科学D辑, 33(S1): 151-162. |
俞言祥, 李山有, 肖亮. 2013. 为新区划图编制所建立的地震动衰减关系. 震灾防御技术, 8(1): 24-33. DOI:10.3969/j.issn.1673-5722.2013.01.003 |
中国地震烈度区划图编委会. 1992. 中国地震烈度区划图(1990)及其说明. 中国地震, 8(4): 1-11. |