 2020, Vol. 63


2. 中国地震局地球物理研究所, 地震观测与地球物理成像重点实验室, 北京 100081;
3. 中国科学院青藏高原研究所, 大陆碰撞与高原隆升重点实验室, 北京 100101;
4. 中国地震台网中心, 北京 100045;
5. 新疆维吾尔自治区地震局, 乌鲁木齐 830011
2. Division of Digital Seismology and Physics of Seismic Source, Institute of Geophysics, China Earthquake Administration, Beijing 100081, China;
3. Key Laboratory of Continental Collision and Plateau Uplift, Institute of Tibetan Plateau Research, Chinese Academy of Sciences, Beijing 100101, China;
4. China Earthquake Networks Center, Beijing 100045, China;
5. Earthquake Administration of Xinjiang Uygur Autonomous Region, Vrümqi 830011, China
帕米尔高原是大陆内部构造变形非常剧烈的地区,也是印度—喜马拉雅碰撞带两个著名的构造结之一,一直以来都是板块间相互作用与大陆内部动力学过程的研究热点,通过该区域的构造特征研究对于理解印度板块向北推挤过程中的应变分配与应力转换具有重要的启示(Burtman and Molnar 1993; Fan et al., 1994; Robinson et al., 2004; Sobel et al., 2013).帕米尔高原地区的构造特征主要以南北向地壳缩短、东西向拉张为主,其变形被一系列的逆冲走滑断裂所吸收,这与青藏高原的构造变形行为与扩展方式非常相似——地壳缩短主要发生在高原边界上而在高原内部变形较小(Fu et al., 2010).此外,帕米尔高原具有与青藏高原类似的构造演化和地球动力学过程(Ducea et al., 2003; Schwab et al., 2004),这对于研究青藏高原的演化形成生长过程有非常重要的意义(Robinson et al., 2007; Sobel et al., 2013).
最新的GPS观测结果表明,帕米尔高原的构造变形主要集中在主帕米尔断裂(MPT)和阿莱谷地附近,缩短速率约10~15 mm·a-1(Ischuk et al., 2013; Mohadjer et al., 2010; Zhou et al., 2016; Zubovich et al., 2010).一些学者认为造成如此剧烈的地壳缩短是欧亚板块向南俯冲的结果(Schneider et al., 2013; Sobel et al., 2013),而另外一部分学者认为这是印度板块向北俯冲与欧亚板块向南俯冲导致的联合产物(Burtman and Molnar, 1993; Fan et al., 1994; Koulakov and Sobolev, 2006).最新数值模拟的结果认为帕米尔高原的形成可能源于印欧碰撞导致的分布式缩短与亚洲地壳侧向不均一性之间的相互作用(Blayney et al., 2016).这些动力学的机制也被很多不同的构造模式所描述(陈汉林等, 2014; 陈杰等, 2011; Robinson et al., 2004).其中弧形造山弯曲的模式认为整个帕米尔高原-西构造结地区是由于帕米尔弧形造山带南侧的挤压缩短作用和北部的伸展作用导致的(Yin et al., 2001);径向逆冲模式认为挤压缩短为主要特征,其内部的拉张作用可能是由于帕米尔高原沿着主帕米尔断裂逆冲导致的(Robinson et al., 2004);喀喇昆仑右旋走滑断层的向北传播模式认为喀喇昆仑断裂在帕米尔高原形成过程中占有重要的作用(Murphy et al., 2000; Strecker et al., 1995);兼顾径向逆冲与喀喇昆仑断裂走滑作用的混合模式则考虑了塔吉克盆地顺时针旋转与喀喇昆仑右旋走滑的作用(Cowgill, 2010).然而,这些模式都没有很好的描述帕米尔高原的形成机制与构造模式,其中一个最重要的原因在于帕米尔高原的应力应变状态并没有得到很好的限定.GPS大地测量数据可以给出帕米尔高原一些具体部位的构造形变特征,但由于区域地形地势条件的特殊,其站点的分布过于稀疏,GPS观测数据很难准确地解析帕米尔高原的构造变形与相邻区域的相互作用方式,并且再也无法反映在一定深度上的应力应变状态.结合GPS观测数据与丰富的地震资料,可以为研究印度板块向北推挤所导致的应变在帕米尔高原、天山造山带以及两侧盆地的分配方式提供更为准确的认识,也为验证不同的岩石圈构造变形模式是否适用于帕米尔高原的构造演化提供重要的约束.
因此,本文联合GPS观测数据与中强地震的震源机制解分析帕米尔高原的构造变形特征及其应变扩展方式.我们首先利用Shen等(2015)方法对GPS速度场进行应变求解,得到帕米尔高原区域的地壳缩短与应变分布特征;然后利用收集的震源机制解求解地震应变率,获取在帕米尔高原不同构造部位的应力分布特征及其应变累积状态;接着利用震源应力反演得到区域最大、小主压应力以及水平主压应力SHmax的方向,并且通过安德森断层参数Aϕ来分析帕米尔高原与周围区域的断层应力状态及其相互作用方式.综合上述所有结果及其比较SKS各项异性的结果,具体讨论帕米尔高原现今的运动学特征及其构造变形模式.
1 地质构造背景帕米尔高原位于青藏高原的西北缘,包括我国新疆喀什地区以及塔吉克斯坦和阿富汗等国家,南边与印度板块相邻,北边与天山造山带相邻,西侧紧挨塔吉克盆地,东侧毗邻我国境内的塔里木盆地.Tanymas缝合线和Rushan-Pshart断裂带将帕米尔高原分割为北、中和南三个部分(Blayney et al., 2016; Burtman and Molnar, 1993; Mechie et al., 2012; Sobel et al., 2013).帕米尔高原周缘被一系列正向逆冲和斜冲-走滑断层所围绕,西缘以左旋走滑-斜冲的达瓦孜断裂带与塔吉克盆地为界,北侧以主帕米尔断裂和帕米尔前缘褶皱逆断层带与天山为界,东部为右旋走滑的喀喇昆仑断裂、喀什叶城转换带等与塔里木盆地为界(Robinson, 2015; Robinson et al., 2004)(图 1).

|
图 1 帕米尔高原GPS速度场(a)与震源机制分布图(b) 其中地形数据来源http://srtm.csi.cgiar.org/,断层数据参考(Burtman and Molnar, 1993; Schurr et al., 2014) Fig. 1 The GPS velocity (a) and focal mechanism (b) in the Pamir plateau The topography data is from http://srtm.csi.cgiar.org/, the fault reference (Burtman and Molnar, 1993; Schurr et al., 2014) |
晚新生代以来,在印度板块向北推挤的作用下帕米尔高原向北推挤了近300 km,导致了高原强烈的地壳缩短与构造隆升,并且伴随着一定的旋转(陈杰等., 2011; Burtman and Molnar, 1993).相对于欧亚板块约32 mm·a-1的北向推挤(Ischuk et al., 2013; Zhou et al., 2016),引发了帕米尔高原地区以及附近区域频繁的地震活动,仅仅在过去的一百年里7级以上的地震达数十次.这些地震活动中挤压型地震主要发生在帕米尔北部边界的MPT以及兴都库什地区,走滑型地震主要发生在帕米尔构造结东边的喀喇昆仑断裂和西边的达瓦孜断裂附近区域,拉张型的正断层地震主要发生在帕米尔高原内部.地震震源机制解的结果表明帕米尔高原地区的最大挤压应力轴是指向N-S(Chatelain et al., 1980),P轴和T轴几乎分别指向NNW-SSE和ENE-WSW(Khan, 2003),与GPS获得的地壳运动方向基本一致(Ischuk et al., 2013; Pan et al., 2018; Zhou et al., 2016).然而很少有研究联合大地测量应变和地震应变应力的状态去解析帕米尔高原的构造变形与相邻区域的相互作用方式.所以本文旨在联合GPS与震源机制的资料去分析帕米尔高原的构造变形模式,希望对帕米尔高原形成演化机制提供更好的认识.
2 数据方法与结果本文选择经度66°E—78°E,纬度36°N—42°N的区域作为研究区域.收集震源深度在50 km以内的震源机制解(Verma and Sekhar, 1985; 唐兰兰等, 2012; Schurr et al., 2014; Feld et al., 2015; Kufner et al., 2018b; Pan et al., 2018)与区域的GPS速度场(Perry et al., 2019; Ischuk et al., 2013; Qiao et al., 2017; Zhao et al., 2015; Zhou et al., 2016; Zubovich et al., 2010)进行GPS应变、地震应变率与震源应力场的分析.我们利用每组GPS速度解中的公共点通过七参数转换将所有GPS速度解统一到欧亚参考框架下.最终我们采用234个GPS站点速度与560个震源机制解,用以分别进行以下分析:
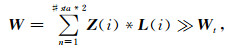
2.1 GPS速度场与应变场筛选速度分量误差σ < 1.5 mm·a-1的GPS站点速度参与应变场计算.利用改进的最小二乘配置方法(Shen et al., 2015)对帕米尔高原的GPS速度场进行应变张量的求解,通过配置合理的距离加权与空间站点分布加权获得解析度和可信度均衡的应变场分布.在计算过程中最重要的是搜索最佳的平滑因子D,选择站点间隔距离范围0~500 km,间隔1 km的步长用以满足以下条件:
|
(1) |
其中L是距离相关的加权,Z是空间站点分布的加权.由于帕米尔高原速度场较为稀疏,选择函数L(i)=1/(1+ΔRi2/D2), ΔR为站点与插值点之间的距离,在运算过程中排除距计算点超出阈值Lmax=10*Dkm的数据点,在满足Wt的条件下得到最佳的平滑因子D,并利用应变求解方程求解每个站点的速度与应变张量[Ux, Uy, τx, τxy, τy, ω]T, 结果如图 2.

|
图 2 帕米尔高原GPS应变场结果 (a)主应变结果; (b)旋转应变结果;(c)最大剪切应变;(d)面应变;(e) D空间尺度平滑结果. Fig. 2 The GPS strain field in the Pamir plateau (a) Distribution of the principle strain; (b) Distribution of the rotational strain; (c) Distribution of the Maximum shear strain; (d) Distribution of the dilatation strain; (e) Optimal smoothing distance (D). |
从主应变结果可以看出,帕米尔高原以及相邻区域主要以NNW-SSE或近N-S向的挤压为主,应变主要集中在主帕米尔断裂以及阿莱谷地附近(约55~60 nstrain/a; 1 nstrain/a=1×10-9/a),而在高原内部伴随着明显ENE-WSW或近E-W向的拉张,应变值都在30 nstrain/a以下.从旋转应变的结果可以看出,包括塔吉克盆地以及南天山在内的帕米尔高原区域都发生比较明显的逆时针旋转,而在喀喇昆仑断裂以东以及塔里木盆地则处于顺时针旋转,这与喀喇昆仑断裂的右旋走滑性质是一致的.最大剪切应变主要集中在阿莱谷地与天山以及塔里木盆地的连结处,应变值高达约50~60 nstrain/a,表明该区域具有较高的地震危险性,而频繁的地震活动也证实了这一点.面应变的结果显示在帕米尔高原内部应变值在约20 nstrain/a,表明高原内部存在拉张活动,这与主拉张应变的结果是一致的;在帕米尔高原北边与阿莱谷地相连结的地带,面应变值为负值(-40~-50 nstrain/a之间),说明该区域存在明显的地壳挤压缩短,同时主挤压应变以及剪切应变的最大值也集中在此区域,以及该区域发生的频繁的地震活动都说明该区域是强烈的地壳缩短区域.这与前人的结果基本一致(Ischuk et al., 2013; Pan et al., 2018; Zhou et al., 2016),但是在量级上存在一定的差异,这主要是由于使用不同的应变计算方法求解所导致的,而本研究同时考量了站点分布以及距离加权,保证了应变结果的可靠性与准确性.
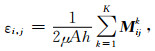
2.2 地震应变场参照Zoback(Zoback et al., 1989; Zoback, 1992)的应力分类方法将收集的560个震源机制解投影到地形图中,并且采用Frohlich的三角图法进行分类(Frohlich, 1992)得到区域的震源机制解类型的分布(图 3).从图 3a与3b中可以发现,研究区域内主要以逆断层类型的震源机制解为主,大约占有所有地震个数的55%左右,这种类型的震源机制解主要分布主帕米尔断裂与阿莱谷地区域附近,走滑断层类型的震源机制解在30%左右,主要分布在大型的走滑断裂附近,然而正断层类型的震源机制解最少,仅仅分布在高原内部区域.这也说明了帕米尔高原内部区域主要是以挤压缩短为主,在高原内部伴有拉张活动.为了定量地反映该区域地震活动的应变累积与释放状态——通过求解地震矩张量的PTB轴实现(Mazzotti et al., 2005; Middleton et al., 2018),本文利用改进Kostrov的方法(Kostrov, 1974; Ward, 1998)得到0.5°网格内所有地震的地震矩张量总和的等效矩震级(图 3c),然后求解特征向量与特征值得到地震应变率张量.

|
图 3 帕米尔高原震源机制解与地震应变率结果 (a)震源机制解类型分布; (b)三角图震源机制解分类; (c)网格内地震矩张量总和; (d)地震应变的主应变轴. Fig. 3 The distribution of the focal mechanism and seismic strain in the Pamir plateau (a) Distribution of the focal mechanism; (b) Ternary diagram of the focal mechanism solutions; (c) Summation of the seismic moment tensor in each grid; (d) Axis of the principle seismic strain. |
|
(2) |
εi, j是地震应变率,Mijk是第k个地震的地震矩张量的ij部分,K是网格区域内的地震数目,μ代表剪切模量,h代表地壳厚度,A代表区域的面积.这里参考Molnar and Ghose(2000)的结果选择μ=3.3 GPa, h=30 km, 从图 3c与图 3d中可以看出,地震挤压应变轴在帕米尔高原西侧与塔吉克盆地区域主要以NNW-SSE方向为主,挤压的方向几乎与帕米尔高原西侧的弧形断裂走向垂直,而在天山以北以及塔里木盆地内的地震挤压应变轴方向基本以N-S向为主.地震应变率的拉张应变轴基本上与挤压应变轴垂直,近乎平行于帕米尔高原弧形构造.这与GPS得到应变结果基本一致,说明了GPS应变结果所捕捉到的构造形变信息绝大部分应为地震构造应变信息,也就是说GPS的站点应变结果可以用来很好的反映区域的地震应力状态,这为分析该区域的孕震机制及其危险性评估提供了良好的限定.
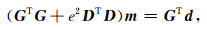
2.3 震源应力场震源应力场可以用来反映地震分布地区的地壳应力状态,是研究地壳运动以及地震孕震机制的一种常用的方式(Michael, 1987).本文中利用阻尼线性逆推法(Hardebeck and Michael, 2006)反演帕米尔高原地区的应力场分布,其主要的反演方程为
|
(3) |
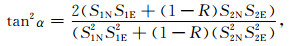
m为求解的模型变量,d是震源参数,G是震源断层面法向量定义的矩阵,D是阻尼矩阵,e是阻尼系数.这种数据自拟合方式是线性反演应力方法(Michael, 1984; Michael, 1987)的改进,并且考量了断层参数以及模型权重可以使得结果更加可靠.此次研究中我们依然采用0.5°进行网格剖分从而反演应力场,通过控制数据拟合与模型长度的权重,选择截止距离最短得到最佳的阻尼系数e为0.6,然后得到最大压应力S1,中间压应力S2,以及最小压应力S3的走向与倾角,以及R=(S1·S2)/(S1·S3)(图 4a, b).R意味中间压应力S2相对于最大压应力S1以及最小压应力S3的大小,如果S1=S2,也就是R=1,应力则为正断层的应力状态;如果S3=S2则R=0,应力则为逆断层的应力状态,如果0 < R < 1,应力则在正断层与逆断层的应力状态转换.为了更加直观得到区域应力的分布,基于Lund(Lund and Townend, 2007)的方法得到了单位网格内水平最大主应力SHmax的方向:

|
图 4 帕米尔高原震源应力场与安德森断层参数结果 (a)主压应力σ1与主张应力σ3; (b)最佳阻尼因子; (c) SHmax分布; (d)安德森断层参数. Fig. 4 Distribution of the focal stress field and Anderson fault parameter in the Pamir plateau (a) Distribution of the principal compressive stress σ1 and the principal extensive stress σ3; (b) Optimal damped parameter; (c) Dstribution of the SHmax; (d) Distribution of the Anderson fault parameter. |
|
(4) |
其中α为SHmax的trend方向,其中S1N,S1E, S2N, S2E, 分别为S1北向以及东向的分量,S2北向与东向的分量.另外,我们根据应力张量计算安德森参数Aϕ:

|
(5) |
Aϕ的范围在0~3之间,而取值在0~1之间时为正断层的应力状态,取值为1~2之间时为走滑断层的应力状态,而在2~3之间时为逆断层的应力状态(Simpson, 1997).图 4a中应力轴的方向代表应力张量的方位角,而长度代表应力的倾角,可以看出研究区域内最大挤压应力的方向是近WNW-ESE或者N-S向的,而在高原内部最大拉张应力的方向是近ENE-WSW或者近E-W向的,说明在印度板块向北推挤作用下,应力到达阿莱谷地以及主帕米尔断裂地带后,应力扩展方式开始发生变化,最大主压应力仍然与帕米尔高原应力方向保持一致,但是最大拉张应力则几乎消失,说明了帕米尔高原在与天山造山带发生碰撞与挤压后导致帕米尔高原内部的拉张作用,而在天山造山带以北,应力继续传播,但一部分的应变已经被主帕米尔与阿莱附近区域吸收,所以在天山以北应力场方向仍然近乎与天山造山带垂直.而在塔吉克盆地与帕米尔高原西部达瓦孜断裂附近区域,最大主压应力方向以及主张应力都发生了一定程度上的旋转,类似于GPS速度场的偏转方向,这可能与帕米尔高原在该区域的俯冲挤压作用有关,并且很有可能是地震资料推断的重力垮塌导致的结果(Schurr et al., 2014).而在帕米尔高原的东侧,喀喇昆仑断裂以东以及塔里木盆地区域,应力的方向几乎与帕米尔高原内部一致,结合喀喇昆仑断裂北段的滑动速率较低(Robinson et al., 2015; Wright et al., 2004),这可能说明了喀喇昆仑断裂北端与塔里木盆地已经连为一体,东西两侧应力方向的对比也暗示了塔里木盆地的刚性强度相比塔吉克盆地明显要强.从图 4d中也可以看出,在帕米尔高原周缘与塔吉克盆地以及南天山连结地带,断层应力状态都显示为逆冲断层的应力状态,而在高原内部显示大部分都为正断层的应力状态,这与前面的地震应变、GPS应变的结果也是一致的.
3 讨论为了更好地讨论分析帕米尔高原构造变形特征,我们将各向异性SKS快波方向——主要用来反映区域的上地幔的构造形变特征(Wüstefeld et al., 2009; Kufner et al., 2018a),与我们计算的SHmax、GPS应变、地震应变结果进行了对比与讨论,并分析了帕米尔高原的构造变形模式.
3.1 地震应变轴与SHmax的对比尽管受到帕米尔高原地震记录时间较短以及地震复发周期的影响,但我们的结果可以对地震历史周期中的应变以及受力方向进行约束,并且利用这种地震应变轴与构造应力场的一致性对比分析可以进一步评估区域的地震危险性.由Kostrov地震应变轴与SHmax对比结果(图 5a)可以看出,在帕米尔高原大部分区域的震源应力与地震挤压应变方向是一致的,说明仪器记录的地震构造形变可以反映区域的构造应力场.但是在塔吉克盆地以及帕米尔高原内部某些部位存在应力场与地震应变的差异,我们认为可能是由于这些区域都存在一定数量的正断层地震,这些地震的孕育很有可能是构造应力场与重力势能联合作用导致的,尤其在塔吉克盆地区域,重力垮塌可能是导致地震应变分异的重要因素(Schurr et al., 2014; Kufner et al., 2018b).并且该区域中小地震的应力方向与两者的方向基本一致(Lukk et al., 1995),也说明该区域频繁的地震活动性其主要机制是来自于印度板块向北推挤的作用力.另外,本文得到Kostrov地震应变结果也显示帕米尔高原的主挤压应变方向从帕米尔北部NNW-SSE方向转换到天山北部的近N-S方向(Lukk et al., 1995),我们认为这种应力场的转换很有可能是由于印度板块向北的推挤过程中帕米尔高原与天山造山带之间不对称的径向逆冲导致的.
3.2 GPS应变与SHmax对比地震水平挤压应力与GPS挤压应变(图 5b)在帕米尔高原呈现出近似的NNW-SSE或N-E方向.GPS应变显示地壳缩短主要集中在帕米尔高原周缘地区,而在高原内部伴随明显的拉张,这与安德森断层参数显示的断层应力分布是一致的.而在塔吉克盆地与塔里木盆地,两者存在明显不同程度角度的偏差,假定在一定的应力作用下,刚性强度较强的块体变形明显会小于刚性强度较弱的块体,所以我们认为这很有可能与两侧盆地的刚性强度有关.而在天山北侧,印度板块向北推挤的应力继续扩展,应变在推挤过程中被一系列的断层构造等所吸收(Ischuk et al., 2013; Mohadjer et al., 2010; Reigber et al., 2001; Zhou et al., 2016; Zubovich et al., 2010),导致了天山北侧应变较低,并且应变的方向在帕米尔高原与天山造山带的不对称逆冲作用下,与应力扩展的方向发生了角度的偏差.因此,考虑到上面所描述的帕米尔高原两侧盆地都存在不同程度的旋转变形,以及应力场的转换,认为不对称的径向逆冲模式可能是帕米尔高原现今构造变形特征的主要成因.

|
图 5 帕米尔高原GPS应变场、地震应变场、震源应力场与SKS各项异性对比 (a)地震应变轴与震源应力场的对比; (b) GPS应变轴与震源应力场的对比; (c) GPS应变轴与SKS各项异性的对比. Fig. 5 Comparison of the GPS strain, seismic strain, focal stress and SKS in the Pamir plateau (a) Comparison of the seismic P axis with SHmax; (b) The comparison of the GPS shortening strain with SHmax; (c) The comparison of the GPS extensional strain with polarizations direction of fast shear-waves. |
结合GPS地表形变场和SKS剪切波各向异性可以很好的用来分析区域的壳幔变形特征及其机制.由于GPS速度场与参考框架密切相关,采用GPS应变场与SKS快波方向进行对比(见图 5).从图 5c可以看出在帕米尔高原以及塔吉克盆地都显示了类似的ENE-WSW方向,反映了地壳与地幔的变形机制可能相同.而在喀喇昆仑断裂以及塔里木盆地附近区域,各项异性结果显示喀喇昆仑断裂与塔拉斯费尔干纳断裂附近区域SKS的快波方向与断层的走向类似,Kufner(2018a)认为这是该断裂带贯穿到岩石圈地幔导致的结果(Kufner et al. 2018a).比较帕米尔高原以及周围两侧各向异性的结果,以及该区域GPS主压应变与震源应力都显示近N-S的方向,加之喀喇昆仑断裂带北端以及塔拉斯费尔干纳断裂的滑动速率相对较低(约0~7 mm·a-1)(Robinson et al., 2015; Wright et al., 2004),都支持不对称的径向逆冲模式可能是该区域的主要构造模式.同时安德森断层参数表明帕米尔高原在其北侧与西侧的接触作用主要为逆断层应力模式的地壳缩短,在高原内部表现为正断层应力模式的拉张作用,也说明了帕米尔高原地区的构造形变模式并不是由于边界的走滑断裂导致的应变分异或者块体挤出,而是由于印度板块向北推挤导致帕米尔高原与天山造山带的不均一径向逆冲.
4 结论本文选择经度66°E—78°E,纬度36°N—42°N的区域进行GPS应变、地震应变率与震源应力场的分析.基于收集的234个GPS站点速度与560个震源机制解,分别利用Shen等(2015)的方法基于GPS站点空间分布与插值点的距离选择最佳加权获得GPS应变场的分布,与Kostrov(1974)的方法得到区域内的地震应变率分布,以及Hardebeck和Michael(2006)方法得到研究区域内震源应力场的分布,并联合SKS各项异性的结果具体分析帕米尔高原区域的构造形变特征,我们得到以下结论:
(1) 帕米尔高原地区及其附近区域包括塔吉克盆地、塔里木盆地以及南天山等区域主要以是WNW-ESE或者N-S挤压为主,而在帕米尔高原内部还伴有近ENE-WSW或者近E-W的拉张.在两侧盆地区域应力方向存在明显的不一致,应力方向在塔里木盆地几乎与帕米尔高原的应力状态保持一致,但在塔吉克盆地区域应力方向发生明显顺时针偏转.这说明两侧盆地与帕米尔高原的接触作用模式不同,可能与两侧盆地刚性块体强度的差异有关.
(2) 安德森断层参数Aϕ显示帕米尔高原北缘与西侧区域主要以逆断层应力模式的地壳缩短为主,而在高原内部主要以正断层应力模式的拉张作用为主.这与GPS应变主要集中在主帕米尔断裂与阿莱谷地附近,而在高原内部应变较低是一致的.考虑区域应力应变的分布以及喀喇昆仑断裂北缘较低的滑动速率,说明地壳挤压缩短可能是帕米尔高原主要的的构造变形特征,并不支持由于边界走滑断裂导致的应变分异或者块体挤出的模式.
(3) 应变结果显示主挤压应变方向从帕米尔北部NNW-SSE方向到天山北部的近N-S方向的转换,并且在帕米尔高原两侧盆地都存在不同程度的旋转变形,以及应力结果在帕米尔高原周围与内部显示对应的逆断层与正断层应力状态,同时对比帕米尔高原两侧壳幔变形的特征,支持不对称的径向逆冲可能是是帕米尔高原构造变形的主要成因机制.
综上所述,GPS应变、震源应力场以及地震应变场反映的结果并不支持喀喇昆仑向北扩展的模式,并且喀喇昆仑北端显示的滑动速率较小也与该模式是矛盾的,而应力应变场的方向在帕米尔高原的两侧也与同造山弯曲的模式是矛盾的,在我们的结果中最大主压应力(应变)方向呈现的近似NNW方向,基本上垂直于帕米尔高原的弧形构造带,并且在高原两侧塔吉克盆地与塔里木盆地表现出的不一致的应力状态以及壳幔变形特征,都支持不对称的径向逆冲模式可能是帕米尔高原现今构造变形特征的主要成因机制.
致谢 文中所有图形都由GMT(Wessel et al., 2013)绘图软件完成.感谢审稿专家的指导与建议.
Blayney T, Najman Y, Dupont-Nivet G, et al. 2016. Indentation of the Pamirs with respect to the northern margin of Tibet:constraints from the Tarim Basin sedimentary record. Tectonics, 35(10): 2345-2369. DOI:10.1002/2016TC004222 |
Burtman V S, Molnar P. 1993. Geological and Geophysical Evidence for Deep Subduction of Continental Crust Beneath the Pamir. Boulder, Colo.: Geological Society of America, 281: 1-76.
|
Chatelain J L, Roecker S W, Hatzfeld D, et al. 1980. Microearthquake seismicity and fault plane solutions in the Hindu Kush Region and their tectonic implications. Journal of Geophysical Research:Solid Earth, 85(B3): 1365-1387. DOI:10.1029/JB085iB03p01365 |
Chen H L, Chen S Q, Lin X B. 2014. A review of the cenozoic tectonic evolution of pamir syntax. Advances in Earth Science (in Chinese), 29(8): 890-902. DOI:10.1867/j.isn.101-816.2014.08.0890 |
Chen J, Li T, Li W Q, et al. 2011. Late cenozoic and present tectonic deformation in the pamir salient, Northwestern China. Seismology and Geology (in Chinese), 33(2): 241-259. |
Cowgill E. 2010. Cenozoic right-slip faulting along the eastern margin of the Pamir salient, northwestern China. GSA Bulletin, 122(1-2): 145-161. DOI:10.1130/B26520.1 |
Ducea M N, Lutkov V, Minaev V T, et al. 2003. Building the Pamirs:The view from the underside. Geology, 31(10): 849-852. DOI:10.1130/G19707.1 |
Fan G W, Ni J F, Wallace T C. 1994. Active tectonics of the Pamirs and Karakorum. Journal of Geophysical Research:Solid Earth, 99(B4): 7131-7160. DOI:10.1029/93jb02970 |
Feld C, Haberland C, Schurr B, et al. 2015. Seismotectonic study of the Fergana Region (Southern Kyrgyzstan):distribution and kinematics of local seismicity. Earth, Planets and Space, 67(1): 1-13. DOI:10.1186/s40623-015-0195-1 |
Frohlich C. 1992. Triangle diagrams:ternary graphs to display similarity and diversity of earthquake focal mechanisms. Physics of the Earth and Planetary Interiors, 75(1-3): 193-198. DOI:10.1016/0031-9201(92)90130-N |
Fu B H, Ninomiya Y, Guo J M. 2010. Slip partitioning in the northeast Pamir-Tian Shan convergence zone. Tectonophysics, 483(3-4): 344-364. DOI:10.1016/j.tecto.2009.11.003 |
Hardebeck J L, Michael A J. 2006. Damped regional-scale stress inversions:methodology and examples for southern California and the Coalinga aftershock sequence. Journal of Geophysical Research:Solid Earth, 111(B11): B11310. DOI:10.1029/2005JB004144 |
Ischuk A, Bendick R, Rybin A, et al. 2013. Kinematics of the Pamir and Hindu Kush regions from GPS geodesy. Journal of Geophysical Research:Solid Earth, 118(5): 2408-2416. DOI:10.1002/jgrb.50185 |
Jay Michael A. 1987. Use of focal mechanisms to determine stress:a control study. Journal of Geophysical Research:Solid Earth, 92(B1): 357-368. DOI:10.1029/JB092iB01p00357 |
Khan P K. 2003. Stress state, seismicity and subduction geometries of the descending lithosphere below the hindukush and pamir. Gondwana Research, 6(4): 867-877. DOI:10.1016/S1342-937X(05)71031-5 |
Kostrov V. 1974. Seismic moment and energy of earthquakes, and seismic flow of rock. Izv. Acad. Sci. USSR Phys. Solid Earth, Engl. Transl, 1: 23-44. |
Koulakov I, Sobolev S V. 2006. A tomographic image of Indian lithosphere break-off beneath the Pamir-Hindukush region. Geophysical Journal International, 164(2): 425-440. DOI:10.1111/j.1365-246X.2005.02841.x |
Kufner S K, Eken T, Tilmann F, et al. 2018a. Seismic anisotropy beneath the pamir and the hindu kush:evidence for contributions from crust, mantle lithosphere, and asthenosphere. Journal of Geophysical Research:Solid Earth, 123(12): 10727-710748. DOI:10.1029/2018JB015926 |
Kufner S K, Schurr B, Ratschbacher L, et al. 2018b. Seismotectonics of the tajik basin and surrounding mountain ranges. Tectonics, 37(8): 2404-2424. DOI:10.1029/2017TC004812 |
Lukk A A, Yunga S L, Shevchenko V I, et al. 1995. Earthquake focal mechanisms, deformation state, and seismotectonics of the Pamir-Tien Shan region, Central Asia. Journal of Geophysical Research:Solid Earth, 100(B10): 20321-20343. DOI:10.1029/95JB02158 |
Lund B, Townend J. 2007. Calculating horizontal stress orientations with full or partial knowledge of the tectonic stress tensor. Geophysical Journal International, 170(3): 1328-1335. DOI:10.1111/j.1365-246X.2007.03468.x |
Molnar P, Ghose S. 2000. Seismic moments of major earthquakes and the rate of shortening across the Tien Shan. Geophysical Research Letters, 27: 2377-2380. DOI:10.1029/2000GL011637 |
Mazzotti S, James T S, Henton J, et al. 2005. GPS crustal strain, postglacial rebound, and seismic hazard in eastern North America:The Saint Lawrence valley example. Journal of Geophysical Research:Solid Earth, 110(B11): B11301. DOI:10.1029/2004JB003590 |
Mechie J, Yuan X, Schurr B, et al. 2012. Crustal and uppermost mantle velocity structure along a profile across the Pamir and southern Tien Shan as derived from project TIPAGE wide-angle seismic data. Geophysical Journal International, 188(2): 385-407. DOI:10.1111/j.1365-246X.2011.05278.x |
Michael A J. 1984. Determination of stress from slip data:faults and folds. Journal of Geophysical Research:Solid Earth, 89(B13): 11517-11526. DOI:10.1029/JB089iB13p11517 |
Middleton T A, Parsons B, Walker R T. 2018. Comparison of seismic and geodetic strain rates at the margins of the Ordos Plateau, northern China. Geophysical Journal International, 212(2): 988-1009. DOI:10.1093/gji/ggx446 |
Mohadjer S, Bendick R, Ischuk A, et al. 2010. Partitioning of India-Eurasia convergence in the Pamir-Hindu Kush from GPS measurements. Geophysical Research Letters, 37(4): L04305. DOI:10.1029/2009gl041737 |
Murphy M A, Yin A, Kapp P, et al. 2000. Southward propagation of the Karakoram fault system, southwest Tibet:Timing and magnitude of slip. Geology, 28(5): 451-454. DOI:10.1130/0091-7613(2000)28<451:SPOTKF>2.0.CO;2 |
Pan Z Y, He J K, Li J. 2018. Contemporary crustal deformation within the pamir plateau constrained by geodetic observations and focal mechanism solutions. Pure and Applied Geophysics, 175(10): 3463-3484. DOI:10.1007/s00024-018-1872-3 |
Perry M, Kakar N, Ischuk A, et al. 2019. Little geodetic evidence for localized indian subduction in the Pamir-Hindu Kush of Central Asia. Geophysical Research Letters, 46(1): 109-118. DOI:10.1029/2018GL080065 |
Qiao X J, Yu P F, Nie Z S, et al. 2017. The crustal deformation revealed by gps and insar in the northwest corner of the Tarim Basin, Northwestern China. Pure and Applied Geophysics, 174(3): 1405-1423. DOI:10.1007/s00024-017-1473-6 |
Reigber C, Michel G W, Galas R, et al. 2001. New space geodetic constraints on the distribution of deformation in Central Asia. Earth and Planetary Science Letters, 191(1-2): 157-165. DOI:10.1016/S0012-821X(01)00414-9 |
Robinson A C, Yin A, Manning C E, et al. 2004. Tectonic evolution of the northeastern Pamir:Constraints from the northern portion of the Cenozoic Kongur Shan extensional system, western China. GSA Bulletin, 116(7-8): 953-973. DOI:10.1130/b25375.1 |
Robinson A C, Yin A, Manning C E, et al. 2007. Cenozoic evolution of the eastern Pamir:Implications for strain-accommodation mechanisms at the western end of the Himalayan-Tibetan orogen. GSA Bulletin, 119(7-8): 882-896. DOI:10.1130/b25981.1 |
Robinson A C. 2015. Mesozoic tectonics of the Gondwanan terranes of the Pamir plateau. Journal of Asian Earth Sciences, 102: 170-179. DOI:10.1016/j.jseaes.2014.09.012 |
Robinson A C, Owen L A, Chen J, et al. 2015. No late Quaternary strike-slip motion along the northern Karakoram fault. Earth and Planetary Science Letters, 409: 290-298. DOI:10.1016/j.epsl.2014.11.011 |
Schneider F M, Yuan X, Schurr B, et al. 2013. Seismic imaging of subducting continental lower crust beneath the Pamir. Earth and Planetary Science Letters, 375: 101-112. DOI:10.1016/j.epsl.2013.05.015 |
Schurr B, Ratschbacher L, Sippl C, et al. 2014. Seismotectonics of the pamir. Tectonics, 33(8): 1501-1518. DOI:10.1002/2014TC003576 |
Schwab M, Ratschbacher L, Siebel W, et al. 2004. Assembly of the Pamirs:Age and origin of magmatic belts from the southern Tien Shan to the southern Pamirs and their relation to Tibet. Tectonics, 23(4): TC4002. DOI:10.1029/2003TC001583 |
Shen Z K, Wang M, Zeng Y H, et al. 2015. Optimal interpolation of spatially discretized geodetic data. Bulletin of the Seismological Society of America, 105(4): 2117-2127. DOI:10.1785/0120140247 |
Simpson R W. 1997. Quantifying Anderson's fault types. Journal of Geophysical Research:Solid Earth, 102(B8): 17909-17919. DOI:10.1029/97JB01274 |
Sobel E R, Chen J, Schoenbohm L M, et al. 2013. Oceanic-style subduction controls late Cenozoic deformation of the Northern Pamir orogen. Earth and Planetary Science Letters, 363: 204-218. DOI:10.1016/j.epsl.2012.12.009 |
Strecker M R, Frisch W, Hamburger M W, et al. 1995. Quaternary Deformation in the Eastern Pamirs, Tajikistan and Kyrgyzstan. Tectonics, 14(5): 1061-1079. DOI:10.1029/95TC00927 |
Tang L L, Zhao C P, Wang H T. 2012. Study on the source characteristics of the 2008 MS 6.8 Wuqia, Xinjiang earthquake sequence and the stress field on the northeastern boundary of Pamir. Chinese Journal of Geophysics, 55(4): 1228-1239. |
Verma R K, Sekhar C C. 1985. Seismotectonics and focal mechanisms of earthquakes from Pamir-Hindukush regions. Tectonophysics, 112(1-4): 297-324. DOI:10.1016/0040-1951(85)90184-2 |
Wüstefeld A, Bokelmann G, Barruol G, et al. 2009. Identifying global seismic anisotropy patterns by correlating shear-wave splitting and surface-wave data. Physics of the Earth and Planetary Interiors, 176(3-4): 198-212. DOI:10.1016/j.pepi.2009.05.006 |
Ward S N. 1998. On the consistency of earthquake moment rates, geological fault data, and space geodetic strain:the United States. Geophysical Journal International, 134(1): 172-186. DOI:10.1046/j.1365-246x.1998.00556.x |
Wessel P, Smith W H F, Scharroo R, et al. 2013. Generic mapping tools:improved version released. Eos, Transactions American Geophysical Union, 94(45): 409-410. DOI:10.1002/2013EO450001 |
Wright T J, Parsons B, England P C, et al. 2004. InSAR observations of low slip rates on the major faults of western Tibet. Science, 305(5681): 236-239. DOI:10.1126/science.1096388 |
Yin A, Robinson A C, Manning C E. 2001. Oroclinal bending and slab-break-off causing coeval east-west extension and east-west contraction in the pamir-nanga parbat syntaxis in the past 10 m.y.. Eos, Transactions American Geophysical Union, 82: F1124. |
Zhao B, Huang Y, Zhang C H, et al. 2015. Crustal deformation on the Chinese mainland during 1998-2014 based on GPS data. Geodesy and Geodynamics, 6(1): 7-15. DOI:10.1016/j.geog.2014.12.006 |
Zhou Y, He J K, Oimahmadov I, et al. 2016. Present-day crustal motion around the Pamir Plateau from GPS measurements. Gondwana Research, 35: 144-154. DOI:10.1016/j.gr.2016.03.011 |
Zoback M L, Zoback M D, Adams J, et al. 1989. Global patterns of tectonic stress. Nature, 341(6240): 291-298. DOI:10.1038/341291a0 |
Zoback M L. 1992. First-and second-order patterns of stress in the lithosphere:The World Stress Map Project. Journal of Geophysical Research:Solid Earth, 97(B8): 11703-11728. DOI:10.1029/92JB00132 |
Zubovich A V, Wang X Q, Scherba Y G, et al. 2010. GPS velocity field for the Tien Shan and surrounding regions. Tectonics, 29(6): TC6014. DOI:10.1029/2010TC002772 |
陈汉林, 陈沈强, 林秀斌. 2014. 帕米尔弧形构造带新生代构造演化研究进展. 地球科学进展, 29(8): 890-902. DOI:10.1867/j.isn.101-816.2014.08.0890 |
陈杰, 李涛, 李文巧, 等. 2011. 帕米尔构造结及邻区的晚新生代构造与现今变形. 地震地质, 33(2): 241-259. DOI:10.3969/j.issn.0253-4967.2011.02.001 |
唐兰兰, 赵翠萍, 王海涛. 2012. 2008年新疆乌恰6. 8级地震序列震源特征及帕米尔东北缘应力场研究.地球物理学报, 55(4): 1228-1239. |