2. 北京大学理论与应用地球物理研究所, 北京 100871
2. Institute of Theoretical and Applied Geophysics, Peking University, Beijing 100871, China
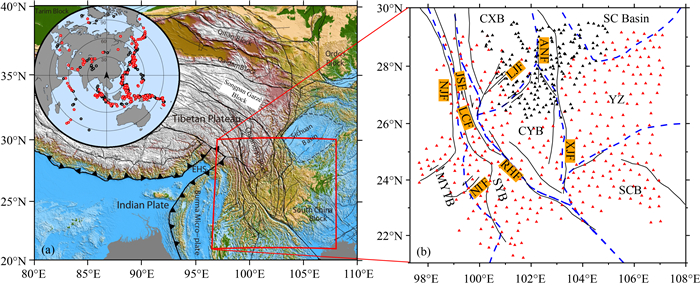
由于印度板块与欧亚板块持续的碰撞和挤压作用, 青藏高原东南缘成为高原物质侧向挤出的前沿地带(Tapponnier and Molnar, 1976; Tapponnier et al.2001;Yin and Harrison, 2000).自新生代以来,青藏高原东南缘先后经历了多期构造演化, 现今时期仍在围绕东喜马拉雅构造结作顺时针旋转运动(图 1a).这里深大断裂发育、地壳变形强烈、地震活动频繁, 一直是研究青藏高原演化机制和深部动力学过程的热点地区, 深受地球科学家的关注.
地震各向异性是研究地球深部变形的有效方法之一, 它存在于地球的不同深度范围内,能够反映地球内部介质变形特征(Crampin, 1981).地质年代尺度的岩石圈变形和软流圈活动会导致地壳和地幔物质的重新排列,比如地壳内部黑云母、角闪石以及上地幔橄榄岩晶体的优势排列等,都会产生地震各向异性,是研究地球深部动力过程的重要依据(Silver and Chan, 1991).太龄雪和高原等(2015)利用剪切波分裂系统分析方法(SAM方法)研究发现云南地区中上地壳的剪切波偏振方向PAZ(Polarization)整体显示出NNE向和NE向的优势取向,大部分台站的PAZ与构造应力场方向一致,但是部分断裂带附近台站的PAZ受到断裂的影响.黎源和雷建设(2012)和Lei等(2014)研究了青藏高原东缘上地幔顶部Pn波各向异性结构,认为在云南地区26°N以南地壳与上地幔顶部形变表现为耦合现象而上地幔顶部至岩石圈内部存在解耦现象.孙长青等(2013)和Cai等(2016)利用接收函数方法研究了川滇地区地壳内部的各向异性,认为青藏高原东南缘地壳的各向异性主要来源于下地壳.青藏高原东南缘及周边地区的SKS分裂研究能够获得上地幔各向异性图像,发现研究区的各向异性具有明显的南北分区特征,北部的快波方向为近NS向,而南部主要表现为近EW向(Flesch et al., 2005; Lev et al., 2006; Wang et al., 2008; 常利军等, 2015;Huang et al., 2015a).王椿镛等(2007)通过比较SKS分裂结果和地表GPS变形场认为研究区的岩石圈变形以纯剪切变形为主且地壳与上地幔是耦合变形,Cai等(2016)通过对比Pms和SKS分裂结果,推测研究区南部地壳与地幔是变形解耦的.这些研究结果对理解青藏高原东南缘的壳幔变形机制和深部动力学问题提供了重要基础,但由于受研究方法的限制,不同结果之间还存在一定分歧,其中一个重要原因就是难以对各向异性的深度进行很好的约束.例如,Pms只能揭示地壳内部的各向异性,Pn波各向异性只能反映上地幔顶部的各向异性特征,SKS难以给出各向异性的具体深度.
瑞利面波具有频散特征,不同周期的面波反映了不同深度的速度结构特征,进而能够获得具有较高纵向分辨率的各向异性分布(Debayle et al., 2005).通过分析不同周期的地震面波频散资料,有助于加强对壳幔不同深度变形特征的认识.苏伟等(2008)用面波层析成像方法研究整个青藏高原地壳上地幔方位各向异性,发现云南地区地壳和地幔岩石圈方位各向异性的强度均小于2%,认为SKS分裂时间应主要归因于软流圈.Yao等(2010)的研究结果发现青藏高原东南部地区地壳各向异性对剪切波各向异性存在一定贡献,不能简单的认为SKS各向异性主要来自上地幔.易桂喜等(2010)用地震面波方位各向异性研究中国大陆岩石圈形变特征,认为青藏高原东缘地区地壳与上地幔似乎不存在垂直连贯变形特征,Legendre等(2015)认为整个青藏高原东部壳幔都是解耦变形的.鲁来玉等(2014)基于背景噪声互相关函数的成像技术获得了8~45 s面波群速度方位各向异性研究结果,支持云南地区壳幔解耦的观点.然而,由于受观测资料或研究方法的限制,这些结果在不同程度上存在空间分辨率(Legendre et al., 2015)或长周期面波获取(鲁来玉等, 2014)等方面的不足.
本文利用川西密集流动地震台阵(Liu et al., 2014)和中国地震科学探测台阵I期两个大型台阵记录的高质量地震面波资料,使用近年来新发展的基于程函方程的面波层析成像方法(Lin et al., 2009, 2011;Jin and Gaherty, 2015;钟世军等, 2017)获取该地区比以往研究结果分辨率更高、周期更长的面波相速度方位各向异性分布图像,可为青藏高原东南缘深部结构和动力学过程研究提供更可靠的新信息.
1 数据和方法 1.1 数据资料根据本文的研究区域,我们收集了2006年10月至2009年7月“川西台阵”南部190个台站(图 1b中黑色台站)和2011年1月至2014年7月“中国地震科学探测台阵I期”350个台站(图 1b中红色台站)观测记录到的垂直分量远震波形数据.为获取清晰的地震面波信号,在进行地震事件挑选时需要满足以下条件:(1)地震事件到台阵中心的距离为15°~90°,以确保体波和面波能有效分离;(2)面波发育、信噪比高、震级介于5.0级和7.5级之间、震源深度小于50 km.然后,再对挑选出的地震波形进行预处理,包括去均值、去倾斜、去仪器响应和数据重采样等,最终选取了416个远震事件(图 1a)波形记录用于本研究.
|
图 1 青藏高原东南缘构造背景和台站分布 (a)研究区构造背景图(据邓起东等, 2002).红色线框是本文研究区域,插图中红色和黑色圆圈代表两个台阵选取的地震事件; (b)台站分布图.黑色实线是断层,蓝色虚线是板块边界.红色和黑色三角分别表示中国地震科学探测台阵I期和川西台阵的台站.NJF:怒江断裂; LCF:澜沧江断裂; JSF:金沙江断裂; RHF:红河断裂; NTF:南汀河断裂; LJF:丽江—小金河断裂; ANF:安宁河断裂; XJF:小江断裂. CXB:川西北次级地块; CYB:滇中块体; SYB:印支块体; MYTB:滇缅泰块体; SC Basin:四川盆地; SCB:华夏块体; YZ:扬子块体. Fig. 1 Tectonic map of the southeast Tibetan Plateau and location of stations (a) Geologic setting of this study area (from Deng et al., 2002).The area studied in this paper is showed by red box. Inset shows epicenters of events for two seismic arrays; (b) Location of stations. Black lines show main faults, while blue dashed lines denote the boundary of the blocks. Red and black triangles represent the stations of Chinarray Phase I and Western Sichuan array respectively. NJF:Nujiang fault; LCF:Lancangjiang fault; JSF:Jinshajing fault; RHF:Red River Fault; NTF:Nantinghe fault; LJF:Lijiang-xiaojinhe fault; ANF:Anninghe fault; XJF:Xiaojiang fault. CXB:Chuanxibei block; CYB: Central Yunnan sub-block; SYB:Southern Yunnan sub-block; MYTB:Burma Thai block; SC Basin:Sichuan Basin; SCB:Cathaysia blcok; YZ: Yangtze block. |
将研究区域划分为0.25°×0.25°网格,采用Jin和Gaherty(2015)基于程函方程的方法研究获取青藏高原东南缘的瑞利面波相速度和方位各向异性特征.该方法利用Gee和Jordan(1992)提出的广义地震数据泛函分析方法,应用高斯小波来拟合台站间的互相关波形,提取包含相速度延迟时间在内的频散参数.与传统双台法需要的地震面波大圆路径假设不同,该方法考虑到复杂介质可能会引起面波传播路径的弯曲现象,通过直接测量不同周期面波的走时场,求解相速度及方位各向异性分布.处理流程分为三步:首先,应用包含五参数的高斯小波来拟合经过窄带滤波后的台站间互相关波形,获取邻近台站对的相位延迟时间:

|
(1) |
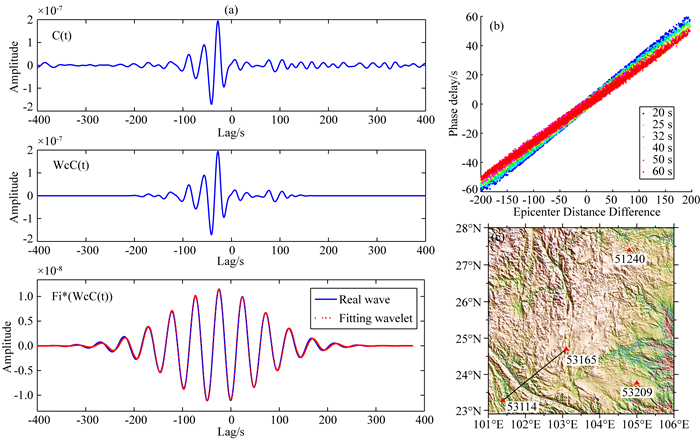
Fi(ωi)为中心频率为ωi的零相位高斯窄带滤波器,C(t)为互相关函数,WC是隔离互相关函数主要能量的汉宁窗.五个参数A、σ、ω、tg和tp,分别代表幅度、窄带波形的半带宽、窄带波形的中心频率、群延迟及相延迟,Ga为高斯函数.图 2a、2b分别给出了台站53114和53165间互相关波形拟合结果及单个事件计算的相延迟时间分布.然后,利用测量得到的相延迟时间分布,通过程函方程计算观测区域内的面波相速度分布,不同地震事件计算得到的相速度对区域内各网格节点进行加权平均,获得最终的面波相速度成像结果.
|
图 2 互相关拟合及相延迟分布 (a1)原始互相关计算结果; (a2)窗函数截取互相关结果; (a3)小波拟合结果; (b)不同颜色表示不同周期的相延迟时间; (c)红色三角形代表台站,黑色线条表示一个台站对. Fig. 2 The cross-correlation fitting and distribution diagram of phase delays (a1) The original cross correlogram; (a2) The windowed cross-correlogram; (a3) The narrow-band filtered cross-correlogram with the five-parameter wavelet fitting; (b) Crosses with different color represent the measurements of relative phase delays at different periods; (c) Red triangles represent stations, black line represents a pair. |
最后,根据来自不同方位地震事件的面波成像结果求解方位各向异性.一阶近似下,弱各向异性介质中的面波相速度对方位的依赖关系(Smith and Dahlen, 1973)可表示为

|
(2) |
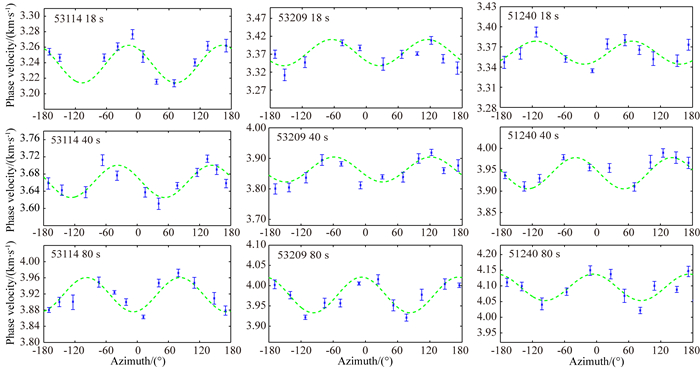
其中θ是方位角,T为周期,C0是各向同性介质的速度,A1和A2是方位各向异性参数,
|
图 3 三个台站附近不同周期的方位各向异性 Fig. 3 Examples of azimuthal anisotropy for Rayleigh waves near three stations |
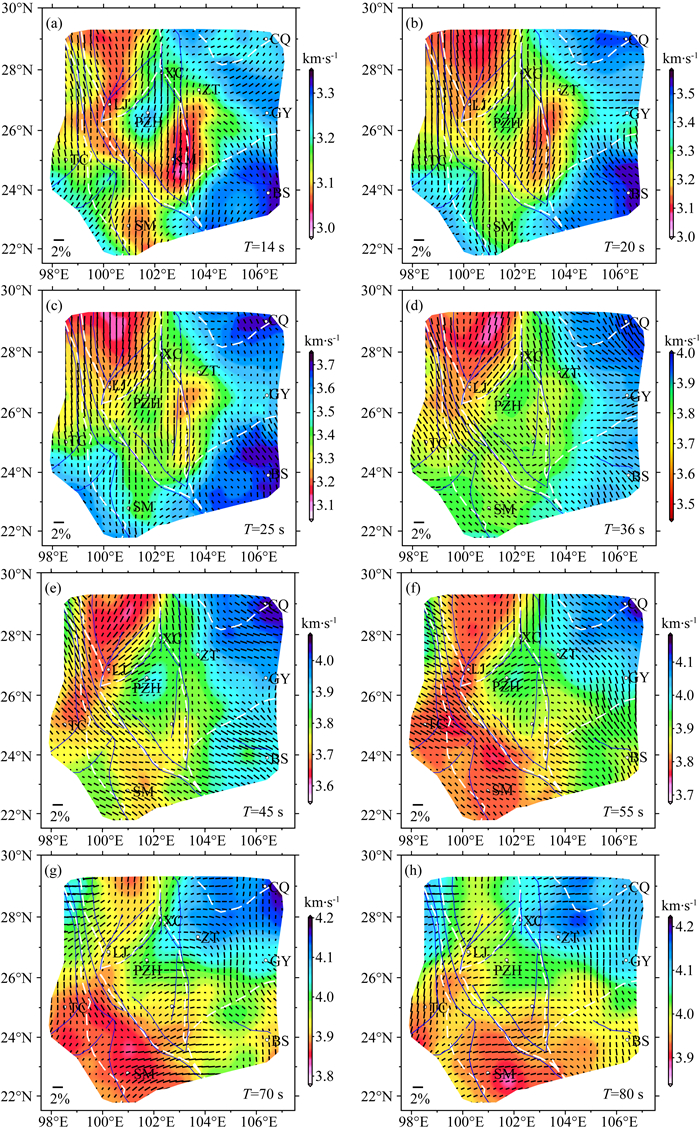
应用程函方程面波层析成像方法,我们获得了青藏高原东南缘14~80 s周期范围内的瑞利面波相速度和各向异性分布图像(图 4).瑞利面波相速度主要对S速度比较敏感,通过计算面波相速度对横波速度的敏感核有助于分析相速度分布图反映的深度.由于研究区地壳厚度分布极不均匀,莫霍面深度起伏范围为30~60 km(图 5),为了更好的分析整个研究区的壳幔各向异性,我们分别计算了地壳厚度为30 km、40 km、50 km和60 km情况下的敏感核(图 6),地壳内部速度模型参考Wang等(2014)的研究结果,上地幔采用AK135模型.一般说来,基阶瑞利波相速度对大约1/3波长深度处的S波速度结构最为敏感,短周期相速度的敏感深度较浅、垂向分辨率较高,中长周期的敏感深度较深,但在垂向上分辨率会逐渐降低.
|
图 4 周期为14~80 s面波相速度和方位各向异性分布 白色虚线为板块边界, 蓝色实线为主要断裂.黑色短线代表各向异性快波方向, 其长度代表各向异性强度的大小. TC腾冲; PZH攀枝花; SM思茅; XC西昌; ZT昭通; KM昆明; CQ重庆; GY贵阳; BS百色; LJ丽江. Fig. 4 The Rayleigh wave phase velocity and azimuthal anisotropy map at 14~80 s Blue lines show main faults, while white dashed lines denote the boundary of the blocks. The directions of short lines denote the direction of the fast waves, while the lengths of short lines denote the strength of the anisotropy. TC Tengchong; PZH Panzhihua; SM Simao; XC Xichang; ZT Zhaotong; KM Kunming; CQ Chonqing; GY Guiyang; BS Baise; LJ Lijiang. |

|
图 5 地壳厚度分布(Wang et al., 2017) 红色虚线将整个研究区划分为西北部、东北部、西南部、东南部. Fig. 5 The distributions of the crustal thickness (Wang et al., 2017) The red dotted line divides the entire study area into NW、NE、SW and SE. |

|
图 6 基于不同地壳厚度的不同周期基阶瑞利面波相速度对S波速度随深度变化的的敏感曲线 (a)、(b)、(c)和(d)分别代表地壳厚度为30 km、40 km、50 km和60 km的敏感核. Fig. 6 Depth sensitivity kernels to the shear wave velocity for fundamental Rayleigh wave phase velocity at different periods for different crustal thicknesses (30 km、40 km、50 km、60 km) |
周期14~20 s的相速度揭示了地壳厚度30~40 km区域的中下地壳和地壳厚度50~60 km区域的中上地壳S波速度结构变化特征,四川盆地南部、华夏块体和攀枝花地区显示出高速异常特征.其中,攀枝花地区的高速异常非常明显,背景噪声成像(鲁来玉等, 2014;范莉苹等, 2015)和近震P波走时层析成像(吴建平等, 2012)亦发现类似的现象.显著的低速异常出现在松潘甘孜块体南部、思茅盆地及红河断裂带和小江断裂带附近.各向异性结果显示,研究区内的各向异性横向分布极不均匀,南汀河断裂带附近各向异性快波方向与断裂带平行呈NE-SW向,四川盆地及周边的各向异性幅值较小,方向多为NE-SW和NEE-SWW向,和王琼等(2015)的结果较为接近,与盆地的东南边界近乎平行,小江断裂东侧的华夏块体则呈NW-SE向.低速异常区的各向异性快波方向多为NS向,例如金沙江断裂和澜沧江断裂北段附近、安宁河断裂和小江断裂附近,且大致平行于断裂带走滑方向.红河断裂附近的快波方向呈NS向,与断裂带走向呈现较大夹角,这与Yao等(2010)的结果是一致的.
周期25~36 s的相速度分布图反映了地壳厚度30~40 km区域的莫霍面附近和地壳厚度50~60 km区域的中下地壳的S波速度结构变化情况,研究区东南部和东北部高速异常更加突出,显示了扬子块体和华夏块体坚硬稳定的特征.小江断裂带的低速区域异常逐渐减弱,攀枝花地区的高速异常逐渐消失,而川西北次级块体由于巨厚的地壳影响仍显示为大范围的低速异常.各向异性的快波方向特征与短周期相比也有较大的变化,安宁河断裂带东侧的快波方向由NEE-SWW向转变成NNW-SSE向,西侧地区仍为NS向,丽江—小金河断裂附近的快波方向开始转变为明显的NE-SW向.西南部尤其是红河断裂带附近,各向异性由NS向转为NW-SE向且强度较大,与鲁来玉等(2014)周期46 s的面波群速度各向异性特征基本一致,小江断裂带附近的NS向特征逐渐消失,而华夏块体的快波方向始终呈NW-SE向.
周期45~55 s的相速度图像征反映了西北部的青藏高原莫霍面附近及其他区域上地幔的S波速度结构特征,四川盆地的高速异常愈加明显,与稳定块体的特征相一致.华夏块体的高速异常特征开始减弱,川西北次级块体仍呈现低速分布,西南部的滇缅泰块体和印支块体的低速异常开始凸显.各向异性结果显示, 红河断裂带附近及其西南侧地区快波优势方向开始由NW-NE向转为NWW-SEE向,接近于SKS各向异性特征.安宁河断裂西侧的川西北次级块体各向异性开始减弱,四川盆地附近的各向异性则始终呈NW-NE向.
长周期70~80 s的相速度主要对120 km深度附近的S波速度比较敏感变化,四川盆地附近依然为高速异常特征,西南部低速异常特征非常突出,在研究区西部边界附近快波方向主要呈现NNE-SSW和NS向.滇缅泰块体、印支块体和滇中块体南部的各向异性特征开始由NWW-SEE向转成EW向和NEE-SWW向,来自于SKS分裂的结果也显示整个云南南部地区快波优势方向为近EW向(王椿镛等, 2007;Huang et al., 2015a; 常利军等, 2016),考虑到该地区深部鲜明的低速异常特征以及80 s周期相速度反映的深度已超出岩石圈深度范围,暗示着该区软流圈尺度内可能存在剧烈的热运动;104°E以东的华夏块体,面波各向异性较弱且快波方向主要为NS向,这与Legendre等(2015)的结果比较接近.
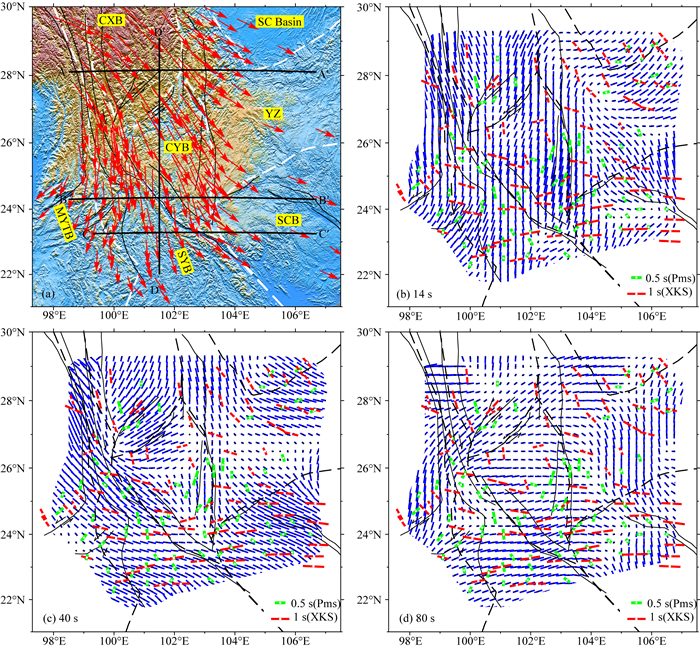
3 讨论在周期14~20 s的相速度各向异性分布图中可以看出,研究区中上地壳各向异性快波方向与大多数断裂带的走向具有较好的一致性,例如安宁河断裂、澜沧江断裂、小江断裂、南汀河断裂等.研究表明,岩石中矿物和熔体的定向排列均可以产生较强的壳内各向异性(Barruol and Mainprice, 1993;Katz et al., 2006;石玉涛等, 2013).Cai等(2016)认为研究区内断裂带的走滑运动引起的地壳变形造成了矿物与熔融体沿断裂带走向分布,产生了与断裂带走向相平行的各向异性快波方向.但在红河断裂带中段及澜沧江断裂带南段附近各向异性快波方向表现为近NS向(图 7b),与断裂走向明显不同,面波群速度反演得到的方位各向异性也表现出近乎同样的特征(鲁来玉等,2014).尤其是红河断裂带,作为一条切割了莫霍面的重要板块边界(王夫运等, 2014),并没有导致壳内各向异性方向与断裂带走向相平行.利用震源机制等资料获得的构造应力场(许忠淮, 2001;吴建平等, 2004;Xu et al., 2016)以及基于GPS观测资料的形变研究等显示(Jin et al., 2019),红河断裂带中段附近的最大主应力为近NS向与面波各向异性方向基本一致.通常认为中上地壳的各向异性与裂隙分布有关(Crampin and Peacock, 2008;Rabbel and Mooney, 1996), 其次也可能受到断裂带的影响,不过影响范围有限(Gao et al., 2011).在构造主压应力的作用下会导致垂直主压应力方向上的裂隙闭合,平行主压应力方向的裂隙扩张,致使沿主压应力方向的波速增加.短周期内的面波各向异性方向,在横跨红河断裂带附近与断裂带走向存在较大夹角,表明红河断裂带附近中上地壳可能没有产生沿断层走向的矿物优势排列,而是与区域构造应力场作用有关.
|
图 7 研究区各向异性综合对比和剖面位置 (a)地表的GPS速度场(相对于欧亚板块)(Zhang et al., 2004;Gan et al., 2007),黑色实线代表四条剖面位置; (b—d)给出了不同周期(14 s, 40 s, 80 s) Rayleigh面波方位各向异性与接收函数各向异性(Sun et al., 2012;Chen et al., 2013;Cai et al., 2016)和XKS各向异性的对比(常利军等, 2015;Huang et al., 2015a). Fig. 7 Comparison of anisotropy and position of four profiles (a) GPS velocity field relative to the stable Eurasia (Zhang et al., 2004; Gan et al., 2007), black dash lines are four profiles. (b—d) are comparison among Rayleigh wave anisotropy from different period (14 s, 40 s, 80 s), receiver function anisotropy (Sun et al., 2012;Chen et al., 2013; Cai et al., 2016) and XKS anisotropy (Chang et al., 2015; Huang et al., 2015a). |
前人在研究青藏高原隆升和扩展的动力学机制时提出地壳流变形模式,认为青藏高原中下地壳存在部分熔融或含水物质的黏滞性流体并向高原外部流动(Royden et al., 1997, 2008;Clark and Royden, 2000;Bai et al., 2010;Liu et al., 2014).Bai等(2010)通过大地电磁测深研究,提出在青藏高原及东南缘地区沿鲜水河—小江断裂带和班公湖—怒江断裂带西侧分别存在一条中下地壳的通道流,然而由于大地电磁测深分辨率以及观测剖面分布的限制,对这一模式仍然存在争议(Chen et al., 2013;王苏等, 2015).Ko和Jung(2015)认为在差应力和温度较高的青藏高原地区,下地壳的各向异性方向与下地壳流的方向基本一致,因此通过研究下地壳各向异性特征可以分析是否存在下地壳流.
从周期25~45 s的面波各向异性分布特征可以看出,在澜沧江—红河断裂附近及以西地区,中下地壳的各向异性的快波方向大致与断裂带走向平行,我们推测可能是由中下地壳的地壳流引起的.在川滇菱形块体内部中下地壳各向异性的大小和方向存在较大的横向差异.北部地区不同周期的相速度各向异性快波方向以NS向为主(图 7b),与块体的南向挤出方向相一致;在丽江—小金河断裂带附近随着面波周期的增加,各向异性快波方向从NS向逐步转变为NE-SW向(图 7c),并与断裂带大致平行;在丽江—小金河断裂以南地区,攀枝花附近表现为相速度高值区和各向异性较弱的特征.在小江断裂带附近,除了小于25 s周期的面波存在明显的各向异性外,在较大周期各向异性较弱.根据上述特征,我们推测在川滇菱形块体北部存在明显的下地壳流,其流动方向与块体向南的挤出方向基本一致,该地壳流在中部由于受到攀枝花附近的高速、高强度坚硬块体(熊绍柏等, 1993;吴建平等, 2013;范莉苹等, 2015;郑晨等, 2016)的阻挡,其前缘向西南方向流动与西部从北向南的下地壳流相汇合,中部地区由于坚硬块体的存在,下地壳没有明显的通道流.在小江断裂带附近同样在一定程度上受北部高速块体的阻挡,但考虑到小江断裂带附近25 s周期存在弱低速异常和南北向各向异性,我们推测该地区可能仅存在较弱的地壳流,这一认识与大地电磁测深推测的结果(Bai et al., 2010)存在一定的差异.
在红河断裂带及其以西地区,周期30~60 s范围的面波各向异性快波方向与红河断裂带大致平行(图 8c).红河断裂带是印度—欧亚板块碰撞与演化过程中发育的大型走滑断裂带, 新生代以来经历了早期左旋剪切和晚期右旋剪切的演化历史,该断裂带的左旋走滑变形主要发生在渐新世至中新世早期(32~17 Ma),位移量大于500 km,调节了印支地块向SE方向的构造挤出,约16 Ma以来红河断裂带从左旋剪切转为右旋走滑变形(Replumaz et al., 2001; Gilley et al., 2003; 张岳桥和李海龙, 2016).我们推测,红河断裂带附近及其以西地区周期30~60 s的面波各向异性快波方向与渐新世至中新世早期印支地块向南东方向的挤出密切相关.块体在挤出过程中由于受到东构造节附近的挤压以及块体挤出运动的影响,造成各向异性方向大致平行于构造边界,这与青藏高原东部地区SKS各向异性方向与大型走滑断裂带大致平行的现象基本一致(Wang et al., 2008;鲁来玉等, 2014; Chang et al., 2015).

|
图 8 面波相速度和方位各向异性沿图 7a中的四个剖面在不同周期的分布情况 红色三角形代表地表断层的位置. Fig. 8 The azimuth anisotropy along four profiles showed in Fig. 7a at different periods The red triangles represent the location of the faults. |
不同深度的介质各向异性特征对研究地球内部动力学过程具有重要意义.前人曾利用SKS资料获得了研究区内壳幔各向异性的分析结果,但是由于SKS分裂获得的各向异性很难对来源深度进行可靠的分析(Savage, 1999),致使对结果的解释存在不同程度的分歧(Lev et al., 2006; Sol et al., 2007; 常利军等, 2015;Huang et al., 2015a;Wei et al., 2016;朱涛等, 2018).在大尺度的构造运动发生的区域,SKS分裂和面波各向异性方向有较好的一致性(Montagner et al., 2000).本文中14~80 s周期的面波各向异性能够较好的反映地壳至150 km深度的介质各向异性特征,可以对研究区SKS各向异性来源深度提供有效的约束.
研究区西北部的青藏高原,中短周期的面波方位各向异性(图 8a、d)接近NS向与剪切波分裂的快波方向大致相同(图 7b),各向异性强度较高接近2%,这反映了厚度高达60 km的地壳其各向异性对SKS的贡献是不容小觑的,如果仅将剪切波的分裂时间归因于地幔各向异性可能是不合理的.该区的岩石圈厚度约为100~120 km(An and Shi, 2006;Pasyanos et al., 2014),前人研究也认为SKS各向异性主要是由岩石圈变形产生的(Lev et al., 2006; 常利军等, 2015).东北部的四川盆地南缘,周期14~20 s的方位各向异性(图 8a)以NE-SW和NEE-SWW向为主,近震剪切波分裂(太龄雪和高原等, 2015)与接收函数转换波Pms的结果(Sun et al., 2012)也显示出相同的地壳各向异性特征(图 7b),这与地表川东褶皱带(Li et al., 2015;Xiong et al., 2016)的NE-SW走向基本一致(图 7a),我们认为这一地区的各向异性与NE-SW向的褶皱变形导致地壳内部矿物的定向排列或高角度的地层定向分布有关.周期25s之后方位各向异性转为NW-SE向,与SKS的快波方向基本一致(图 7c),可以确定该区的SKS各向异性与地壳无关,主要来自上地幔介质,与西侧的青藏高原存在明显差异.
26°N以南地区SKS各向异性快波方向大致呈现近EW分布,分裂延迟时间介于0.6~1.3 s且自西向东逐渐递增,腾冲附近平均延迟时间为0.7 s,印支块体平均为1 s,最东部的华夏块体可达1.2 s(常利军等, 2015).Kong等(2018)认为东西向SKS各向异性可能是俯冲的印度板块回撤导致的.前人通过一阶Fresnel带(Alsina and Snieder, 1995)的推断,认为研究区南部SKS各向异性层分布在60~160 km之间的上地幔(常利军等,2015).Shi等(2012)的结果也显示,该区域平均SKS延迟时间为0.55~1.65 s,主要各向异性层大约在55~165 km.我们的结果表明在104°E以西区域,小于36 s周期的面波各向异性方向(图 8b、c、d)主要表现为NS向或NW-SE向,与SKS分裂获得的快波方向存在较大差异,说明剪切波分裂结果与壳内各向异性明显不同.但在36 s周期之后方位各向异性转为近NW-SE、NWW-SEE和EW向,与SKS快波方向接近(图 8c,d).已有的研究表明,该地区的岩石圈厚度大约为60~80 km(An and Shi, 2006;Pasyanos et al., 2014),这一深度与36 s周期的面波相速度主要敏感深度范围基本一致,表明该区SKS的各向异性可能主要来源于莫霍面以下的岩石圈和软流圈,与前人的推断比较接近.
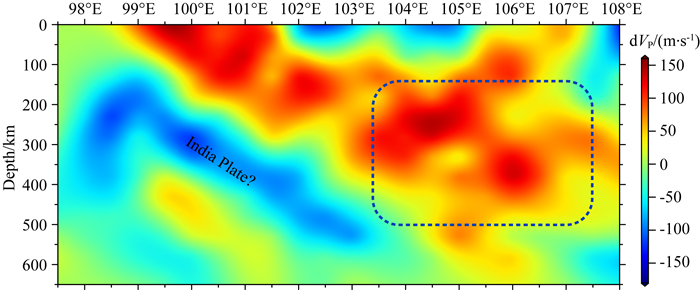
104°E以东的华夏块体,周期14~36 s的各向异性(图 8b、c)相对较弱,周期45~55 s的面波各向异性快波方向以NW-SE向为主,与SKS各向异性EW向的快波方向存在明显差异,70 s以上周期的面波各向异性较弱且快波方向主要为NW-SE和NS向.由此可见,面波相速度各向异性观测结果与EW向的SKS各向异性方向存在明显差异,考虑到14~80 s周期的面波相速度主要反映了深度小于150 km的介质波速特性,因此我们认为该区分裂延迟时间达1.2 s东西向的SKS各向异性主要来源深度应该超过150 km.远震体波走时层析成像研究揭示,研究区上地幔低速异常存在西部浅,东部逐渐变深的趋势(胡家富等, 2008;Yang et al., 2014;范莉苹, 2014;Huang et al., 2015b;Hu and Wang, 2018)且东部低速异常的厚度及深度均明显大于西部地区(图 9).从面波相速度分布图看,该区80 s周期开始出现低速异常,与体波走时层析成像的结果具有一致性.Fu等(2017)利用双平面波法反演青藏高原东南缘的横波速度,结果也显示104°E以东的华夏块体明显的低速层出现在100 km深度以下.因此我们认为,东部华夏块体长周期面波方位各向异性与SKS各向异性的差异,是由于导致剪切波各向异性的低速异常体在东部地区变深,小于80 s周期的面波无法反映如此大深度介质特性引起的,SKS分裂延迟时间东部大于西部与东部低速异常体的厚度较大有关.图 9中虚线框所示区域,或许才是华夏块体SKS分裂延迟时间达1.2 s的来源深度.
|
图 9 沿23°N远震P波速度结构垂直剖面(范莉苹,2014) Fig. 9 Vertical profile of the teleseismic P-wave velocity structure of 23°N (Fan, 2014) |
本文使用程函方程面波层析成像方法,收集了研究区内布设的540个地震台站记录到的垂直分量远震波形数据,经过互相关、计算共筛选出416个地震事件,采用0.25°×0.25°的网格划分,最终获得了周期14~80 s的高分辨率相速度及方位各向异性分布图像,并结合构造区应力场、Pms各向异性、SKS分裂等研究成果,对青藏高原东南缘壳幔变形和深部动力学机制进行了分析研究,主要结论如下:
在构造变形极为复杂的青藏高原东南缘地区,中上地壳的面波方位各向异性分布与断裂带和区域构造应力场的作用均密切相关,断裂带的走滑运动造成了矿物与熔融体沿断裂带走向的分布以及构造主压应力的作用导致中上地壳裂隙的闭合与扩张等是导致这一现象的主要原因.
在川滇菱形块体北部存在明显的下地壳流,其流动方向与块体向南的挤出方向基本一致,但在中部由于受到攀枝花高速、高强度坚硬块体的阻挡,其流动向西南向偏转;中部地区由于坚硬块体的存在,下地壳没有明显的通道流;小江断裂带附近,可能仅存在较弱的地壳流.红河断裂带附近及其以西地区周期30~60 s各向异性快波方向与该断裂带大致平行,推测与渐新世至中新世早期印支地块向SE方向挤出密切相关.
研究区西北部地壳各向异性较强,对SKS分裂的贡献不容忽视,四川盆地南缘壳内各向异性快波方向以NE-SW和NEE-SWW向为主与该区地壳的早期构造变形有关,同时也说明该区SKS分裂揭示的NW-SE向各向异性主要来自上地幔介质;在研究区南部,尽管从西至东SKS各向异性向快波方向均为近EW向,但各向异性的来源深度存在明显差异.不同周期的面波各向异性分布结果揭示,104°E以西地区的剪切波各向异性来源于较浅的上地幔,104°E以东地区SKS各向异性来源深度明显大于西部地区,至少在150 km以下.结合远震体波层析成像的结果,我们认为东部SKS分裂延迟时间长于西部可能是东部低速异常体的厚度大于西部导致的.
致谢 感谢“中国地震科学探测台阵数据中心”为本文提供观测资料.感谢两位审稿人对本文提出的重要修改意见和建议.
Alsina D, Snieder R. 2010. Small-scale sublithospheric continental mantle deformation:constraints from SKS splitting observations. Geophysical Journal of the Royal Astronomical Society, 123(2): 431-448. |
An M J, Shi Y L. 2006. Lithospheric thickness of the Chinese continent. Physics of the Earth and Planetary Interiors, 159(3-4): 257-266. DOI:10.1016/j.pepi.2006.08.002 |
Bai D H, Unsworth M J, Meju M A, et al. 2010. Crustal deformation of the Tibetan plateau revealed by magnetotelluric imaging. Nature Geoscience, 3(5): 358-362. DOI:10.1038/NGEO830 |
Barruol G, Mainprice D. 1993. A quantitative evaluation of the contribution of crustal rocks to the shear-wave splitting of teleseismic SKS waves. Physics of the Earth and Planetary Interiors, 78(3-4): 281-300. DOI:10.1016/0031-9201(93)90161-2 |
Cai Y, Wu J P, Fang L H, et al. 2016. Crustal anisotropy and deformation of the southeastern margin of the Tibetan Plateau revealed by Pms splitting. Journal of Asian Earth Sciences, 121: 120-126. DOI:10.1016/j.jseaes.2016.02.005 |
Chang L J, Ding Z F, Wang C Y. 2015. Upper mantle anisotropy beneath the northern segment of the north-south tectonic belt in China. Chinese Journal of Geophysics (in Chinese), 58(11): 4052-4067. DOI:10.6038/cjg20161109 |
Chang L J, Flesch L M, Wang C Y, et al. 2015. Vertical coherence of deformation in lithosphere in the eastern Himalayan syntaxis using GPS, Quaternary fault slip rates, and shear wave splitting data. Geophysical Research Letters, 42(14): 5813-5819. DOI:10.1002/2015GL064568 |
Chen Y, Zhang Z J, Sun C Q, et al. 2013. Crustal anisotropy from Moho converted Ps wave splitting analysis and geodynamic implications beneath the eastern margin of Tibet and surrounding regions. Gondwana Research, 24(3-4): 946-957. DOI:10.1016/j.gr.2012.04.003 |
Clark M K, Royden L H. 2000. Topographic ooze:Building the eastern margin of Tibet by lower crustal flow. Geology, 28(8): 703-706. DOI:10.1130/0091-7613(2000)28〈703:TOBTEM〉2.0.CO;2 |
Crampin S. 1981. A review of wave motion in anisotropic and cracked elastic-media. Wave Motion, 3(4): 343-391. DOI:10.1016/0165-2125(81)90026-3 |
Crampin S, Peacock S. 2008. A review of the current understanding of seismic shear-wave splitting in the Earth's crust and common fallacies in interpretation. Wave Motion, 45(6): 675-722. DOI:10.1016/j.wavemoti.2008.01.003 |
Debayle E, Kennett B, Priestley K. 2005. Global azimuthal seismic anisotropy and the unique plate-motion deformation of Australia. Nature, 433(7025): 509-512. DOI:10.1038/nature03247 |
Deng Q D, Zhang P Z, Ran Y K, et al. 2003. Basic characteristics of active tectonics of China. Science in China Series D:Earth Sciences, 46(4): 356-372. |
Fan L P. 2014. The velocity structure of the crust and mantle beneath the east margin of the Tibetan Plateau[Ph. D. thesis] (in Chinese). Beijing: Institute of Geophysics, China Earthquake Administration.
|
Fan L P, Wu J P, Fang L H, et al. 2015. The characteristic of Rayleigh wave group velocities in the southeastern margin of the Tibetan Plateau and its tectonic implications. Chinese Journal of Geophysics (in Chinese), 58(5): 1555-1567. DOI:10.6038/cjg20150509 |
Flesch L M, Holt W E, Silver P G, et al. 2005. Constraining the extent of crust-mantle coupling in central Asia using GPS, geologic, and shear wave splitting data. Earth and Planetary Science Letters, 238(1-2): 248-268. DOI:10.1016/j.epsl.2005.06.023 |
Fu Y Y, Gao Y, Li A B, et al. 2017. Lithospheric structure of the southeastern margin of the Tibetan Plateau from Rayleigh wave tomography. Journal of Geophysical Research:Solid Earth, 122(6): 4631-4644. DOI:10.1002/2016JB013096 |
Gan W J, Zhang P Z, Shen Z K, et al. 2007. Present-day crustal motion within the Tibetan Plateau inferred from GPS measurements. Journal of Geophysical Research:Solid Earth, 112(B8): B08416. DOI:10.1029/2005jb004120 |
Gao Y, Wu J, Fukao Y, et al. 2011. Shear wave splitting in the crust in North China:stress, faults and tectonic implications. Geophysical Journal International, 187(2): 642-654. DOI:10.1111/j.1365-246X.2011.05200.x |
Gee L S, Jordan T H. 1992. Generalized seismological data functionals. Geophysical Journal International, 111(2): 363-390. DOI:10.1111/j.1365-246X.1992.tb00584.x |
Gilley L D, Harrison T M, Leloup P H, et al. 2003. Direct dating of left-lateral deformation along the Red River shear zone, China and Vietnam. Journal of Geophysical Research:Solid Earth, 108(B2): 2127. DOI:10.1029/2001JB001726 |
Hu J F, Hu Y L, Xia J Y, et al. 2008. Crust-mantle velocity structure of s wave and dynamic process beneath burma arc and its adjacent regions. Chinese Journal of Geophysics (in Chinese), 51(1): 140-148. |
Hu Y P, Wang Z. 2018. Plate interactions, crustal deformation and magmatism along the eastern margins of the Tibetan Plateau. Tectonophysics, 740-741: 10-26. DOI:10.1016/j.tecto.2018.05.011 |
Huang Z C, Wang L S, Xu M J, et al. 2015a. Teleseismic shear-wave splitting in SE Tibet:Insight into complex crust and upper-mantle deformation. Earth and Planetary Science Letters, 432: 354-362. DOI:10.1016/j.epsl.2015.10.027 |
Huang Z C, Zhao D P, Wang L S. 2015b. P wave tomography and anisotropy beneath Southeast Asia:insight into mantle dynamics. Journal of Geophysical Research:Solid Earth, 120(7): 5154-5174. DOI:10.1002/2015JB012098 |
Jin G, Gaherty J B. 2015. Surface wave phase-velocity tomography based on multichannel cross-correlation. Geophysical Journal International, 201(3): 1383-1398. DOI:10.1093/gji/ggv079 |
Jin H L, Gao Y, Su X N, et al. 2019. Contemporary crustal tectonic movement in the southern Sichuan-Yunnan block based on dense GPS observation data. Earth and Planetary Physics, 3(1): 53-61. DOI:10.26464/epp2019006 |
Katz R F, Spiegelman M, Holtzman B. 2006. The dynamics of melt and shear localization in partially molten aggregates. Nature, 442(7103): 676-679. DOI:10.1038/nature05039 |
Ko B, Jung H. 2015. Crystal preferred orientation of an amphibole experimentally deformed by simple shear. Nature Communications, 6: 6586. DOI:10.1038/ncomms7586 |
Kong F S, Wu J, Liu l, et al. 2018. Azimuthal anisotropy and mantle flow underneath the southeastern Tibetan Plateau and northern Indochina Peninsula revealed by shear wave splitting analyses. Tectonophsics, 747: 68-78. |
Legendre C P, Deschamps F, Zhao L, et al. 2015. Rayleigh-wave dispersion reveals crust-mantle decoupling beneath eastern Tibet. Scientific Reports, 5: 16644. DOI:10.1038/srep16644 |
Lei J S, Li Y, Xie F R, et al. 2014. Pn anisotropic tomography and dynamics under eastern Tibetan plateau. Journal of Geophysical Research:Solid Earth, 119(3): 2174-2198. DOI:10.1002/2013JB010847 |
Lev E, Long M D, Van Der Hilst R. 2006. Seismic anisotropy in Eastern Tibet from shear wave splitting reveals changes in lithospheric deformation. Earth and Planetary Science Letters, 251(3-4): 293-304. DOI:10.1016/j.epsl.2006.09.018 |
Li C X, He D F, Sun Y P, et al. 2015. Structural characteristic and origin of intra-continental fold belt in the eastern Sichuan basin, South China Block. Journal of Asian Earth Sciences, 111: 206-221. DOI:10.1016/j.jseaes.2015.07.027 |
Li Y, Lei J S. 2012. Velocity and anisotropy structure of the uppermost mantle under the eastern Tibetan plateau inferred from Pn tomography. Chinese Journal of Geophysics (in Chinese), 55(11): 3615-3624. DOI:10.6038/j.issn.0001-5733.2012.11.010 |
Lin F C, Ritzwoller M H, Snieder R. 2009. Eikonal tomography:surface wave tomography by phase front tracking across a regional broad-band seismic array. Geophysical Journal International, 177(3): 1091-1110. DOI:10.1111/j.1365-246X.2009.04105.x |
Lin F C, Ritzwoller M H. 2011. Helmholtz surface wave tomography for isotropic and azimuthally anisotropic structure. Geophysical Journal International, 186(3): 1104-1120. DOI:10.1111/j.1365-246X.2011.05070.x |
Liu Q Y, Van Der Hilst R D, Li Y, et al. 2014. Eastward expansion of the Tibetan Plateau by crustal flow and strain partitioning across faults. Nature Geoscience, 7(5): 361-365. DOI:10.1038/ngeo2130 |
Lu L Y, He Z Q, Ding Z F, et al. 2014. Azimuth anisotropy and velocity heterogeneity of Yunnan area based on seismic ambient noise. Chinese Journal of Geophysics (in Chinese), 57(3): 822-836. DOI:10.6038/cjg20140312 |
Montagner J P, Griot-Pommera D A, Lavé J. 2000. How to relate body wave and surface wave anisotropy?. Journal of Geophysical Research:Solid Earth, 105(B8): 19015-19027. DOI:10.1029/2000JB900015 |
Pasyanos M E, Masters T G, Laske G, et al. 2014. LITHO1.0:An updated crust and lithospheric model of the Earth. Journal of Geophysical Research:Solid Earth, 119(3): 2153-2173. DOI:10.1002/2013JB010626 |
Rabbel W, Mooney W D. 1996. Seismic anisotropy of the crystalline crust:what does it tell us?. Terra Nova, 8(1): 16-21. DOI:10.1111/j.1365-3121.1996.tb00721.x |
Replumaz A, Lacassin R, Tapponnier P, et al. 2001. Large river offsets and Plio-Quaternary dextral slip rate on the Red River fault (Yunnan, China). Journal of Geophysical Research:Solid Earth, 106(B1): 819-836. DOI:10.1029/2000JB900135 |
Royden L H, Burchfiel B C, King R W, et al. 1997. Surface deformation and lower crustal flow in eastern Tibet. Science, 276(5313): 788-790. DOI:10.1126/science.276.5313.788 |
Royden L H, Burchfiel B C, Van Der Hilst R D. 2008. The geological evolution of the Tibetan Plateau. Science, 321(5892): 1054-1058. DOI:10.1126/science.1155371 |
Savage M K. 1999. Seismic anisotropy and mantle deformation:What have we learned from shear wave splitting?. Reviews of Geophysics, 37(1): 65-106. |
Shi Y T, Gao Y, Su J R, et al. 2012. Shear-wave splitting beneath Yunnan area of southwest China. Earthquake Science, 25(1): 25-34. DOI:10.1007/s11589-012-0828-4 |
Shi Y T, Gao Y, Zhang Y J, et al. 2013. Shear-wave splitting in the crust in Eastern Songpan-Garzê block, Sichuan-Yunnan block and Western Sichuan Basin. Chinese Journal of Geophysics (in Chinese), 56(2): 481-494. DOI:10.6038/cjg20130212 |
Silver P G, Chan W W. 1991. Shear wave splitting and subcontinental mantle deformation. Journal of Geophysical Research:Solid Earth, 96(B10): 16429-16454. DOI:10.1029/91JB00899 |
Smith M L, Dahlen F A. 1973. The azimuthal dependence of Love and Rayleigh wave propagation in a slightly anisotropic medium. Journal of Geophysical Research:Solid Earth, 78(17): 3321-3333. DOI:10.1029/JB078i017p03321 |
Sol S, Meltzer A, Bürgmann R, et al. 2007. Geodynamics of the southeastern Tibetan Plateau from seismic anisotropy and geodesy. Geology, 35(6): 563-566. DOI:10.1130/G23408A.1 |
Su W, Wang C Y, Huang Z X. 2008. Azimuthal anisotropy of Rayleigh waves beneath the Tibetan Plateau and adjacent areas. Science in China Series D:Earth Sciences, 51(12): 1717-1725. DOI:10.1007/s11430-008-0137-x |
Sun C Q, Lei J S, Li C, et al. 2013. Crustal anisotropy beneath the Yunnan region and dynamic implications. Chinese Journal of Geophysics (in Chinese), 56(12): 4095-4105. DOI:10.6038/cjg20131214 |
Sun Y, Niu F L, Liu H F, et al. 2012. Crustal structure and deformation of the SE Tibetan plateau revealed by receiver function data. Earth and Planetary Science Letters, 349-350: 186-197. DOI:10.1016/j.epsl.2012.07.007 |
Tai L X, Gao Y, L G, et al. 2015. Crustal seismic anisotropy in the southeastern margin of Tibetan Plateau by ChinArray data:shear-wave splitting from temporary observations of the first phase. Chinese Journal of Geophysics (in Chinese), 58(11): 4079-4091. DOI:10.6038/cjg20151116 |
Tapponnier P, Molnar P. 1976. Slip-line field theory and large-scale continental tectonics. Nature, 264(5584): 319-324. DOI:10.1038/264319a0 |
Tapponnier P, Xu Z Q, Roger F, et al. 2001. Oblique stepwise rise and growth of the Tibet plateau. Science, 294(5547): 1671-1677. DOI:10.1126/science.105978 |
Wang C Y, Chang L J, Lv Z Y, et al. 2007. Seismic anisotropy of upper mantle in eastern Tibetan Plateau and related crust-mantle coupling pattern. Science in China Series D:Earth Sciences, 50(8): 1150-1160. DOI:10.1007/s11430-007-0053-5 |
Wang C Y, Flesch L M, Silver P G, et al. 2008. Evidence for mechanically coupled lithosphere in central Asia and resulting implications. Geology, 36(5): 363-366. DOI:10.1130/G24450A.1 |
Wang F Y, Pan S Z, Liu L, et al. 2014. Wide angle seismic exploration of Yuxi-Lincang profile-The research of crustal structure of the red river fault zone and southern Yunnan. Chinese Journal of Geophysics (in Chinese), 57(10): 3247-3258. DOI:10.6038/cjg20141013 |
Wang Q, Gao Y, Shi Y T. 2015. Rayleigh wave azimuthal anisotropy on the southeastern front of the Tibetan Plateau from seismic ambient noise. Chinese Journal of Geophysics (in Chinese), 58(11): 4068-4078. DOI:10.6038/cjg20151115 |
Wang S, Xu X Y, Hu J F. 2015. Review on the study of crustal structure and geodynamic models for the southeast margin of the Tibetan Plateau. Chinese Journal of Geophysics (in Chinese), 58(11): 4235-4253. DOI:10.6038/cjg20151129 |
Wang W L, Wu J P, Fang L H, et al. 2014. S wave velocity structure in southwest China from surface wave tomography and receiver functions. Journal of Geophysical Research:Solid Earth, 119(2): 1061-1078. DOI:10.1002/2013jb010317 |
Wang W L, Wu J P, Fang L H, et al. 2017. Crustal thickness and Poisson's ratio in southwest China based on data from dense seismic arrays. Journal of Geophysical Research:Solid Earth, 122(9): 7219-7235. DOI:10.1002/2017JB013978 |
Wei W, Zhao D P, Xu J D, et al. 2016. Depth variations of P-wave azimuthal anisotropy beneath Mainland China. Scientific Reports, 6: 29614. DOI:10.1038/srep29614 |
Wu J P, Ming Y H, Wang C Y. 2004. Source mechanism of small-to-moderate earthquakes and tectonic stress field in Yunnan province. Acta Seismologica Sinica (in Chinese), 26(5): 457-465. |
Wu J P, Yang T, Wang W L, et al. 2013. Three dimensional P-wave velocity structure around xiaojiang fault system and its tectonic implications. Chinese Journal of Geophysics (in Chinese), 56(7): 2257-2267. DOI:10.6038/cjg20130713 |
Xiong S B, Zheng Y, Yin Z X, et al. 1993. The 2-D structure and it's tectonic implications of the crust in the Lijiang-Pan-Zhihua-Zhehai region. ChineseActa Geophysica Sinica (in Chinese), 36(4): 434-444. |
Xiong X S, Gao R, Wang H Y, et al. 2016. Frozen subduction in the Yangtze block:insights from the deep seismic profiling and gravity anomaly in east Sichuan fold belt. Earthquake Science, 29(2): 61-70. DOI:10.1007/s11589-016-0140-9 |
Xu Z G, Huang Z C, Wang L S, et al. 2016. Crustal stress field in Yunnan:implication for crust-mantle coupling. Earthquake Science, 29(2): 105-115. DOI:10.1007/s11589-016-0146-3 |
Xu Z H. 2001. A present-day tectonic stress map for eastern Asia region. Acta Seismologica Sinica (in Chinese), 23(5): 492-501. |
Yang T, Wu J P, Fang L H, et al. 2014. Complex structure beneath the southeastern Tibetan Plateau from teleseismic P-wave tomography. Bulletin of the Seismological Society of America, 104(3): 1056-1069. DOI:10.1785/0120130029 |
Yao H J, Van Der Hilst R D, Montagner J P. 2010. Heterogeneity and anisotropy of the lithosphere of SE Tibet from surface wave array tomography. Journal of Geophysical Research:Solid Earth, 115(B12): B12307. DOI:10.1029/2009jb007142 |
Yi G X, Yao H J, Zhu J S, et al. 2010. Lithospheric deformation of continental china from rayleigh wave azimuthal anisotropy. Chinese Journal of Geophysics (in Chinese), 53(2): 256-268. DOI:10.3969/j.issn.0001-5733.2010.02.004 |
Yin A, Harrison T M. 2000. Geologic evolution of the Himalayan-Tibetan orogen. Annual Review of Earth and Planetary Sciences, 28: 211-280. DOI:10.1146/annurev.earth.28.1.211 |
Zhang P Z, Shen Z K, Wang M, et al. 2004. Continuous deformation of the Tibetan Plateau from global positioning system data. Geology, 32(9): 80-812. DOI:10.1130/G20554 |
Zhang Y Q, Li H L. 2016. Late Cenozoic tectonic events in east Tibetan Plateau and extrusion-related orogenic system. Geology in China (in Chinese), 43(6): 1829-1852. |
Zheng C, Ding Z F, Song X D. 2016. Joint inversion of surface wave dispersion and receiver functions for crustal and uppermost mantle structure in Southeast Tibetan Plateau. Chinese Journal of Geophysics (in Chinese), 59(9): 3223-3236. DOI:10.6038/cjg20160908 |
Zhong S J, Wu J P, Fang L H, et al. 2017. Surface wave Eikonal tomography in and around the northeastern margin of the Tibetan plateau. Chinese Journal of Geophysics (in Chinese), 60(6): 2304-2314. DOI:10.6038/cjg20170622 |
Zhu T. 2018. The depth of shear wave splitting anisotropy in the Yunnan region inferred from mantle convection simulation. Chinese Journal of Geophysics (in Chinese), 61(3): 948-962. DOI:10.6038/cjg2018L0137 |
常利军, 丁志峰, 王椿镛. 2015. 南北构造带北段上地幔各向异性特征. 地球物理学报, 58(11): 4052-4067. DOI:10.6038/cjg20161109 |
邓起东, 张培震, 冉勇康, 等. 2002. 中国活动构造基本特征. 中国科学(D辑), 32(12): 1020-1030. |
范莉苹. 2014.青藏高原东缘壳幔速度结构研究[博士论文].北京: 中国地震局地球物理研究所.
|
范莉苹, 吴建平, 房立华, 等. 2015. 青藏高原东南缘瑞利波群速度分布特征及其构造意义探讨. 地球物理学报, 58(5): 1555-1567. DOI:10.6038/cjg20150509 |
胡家富, 胡毅力, 夏静瑜, 等. 2008. 缅甸弧及邻区的壳幔S波速度结构与动力学过程. 地球物理学报, 51(1): 140-148. DOI:10.3321/j.issn:0001-5733.2008.01.018 |
黎源, 雷建设. 2012. 青藏高原东缘上地幔顶部Pn波速度结构及各向异性研究. 地球物理学报, 55(11): 3615-3624. DOI:10.6038/j.issn.0001-5733.2012.11.010 |
鲁来玉, 何正勤, 丁志峰, 等. 2014. 基于背景噪声研究云南地区面波速度非均匀性和方位各向异性. 地球物理学报, 57(3): 822-836. DOI:10.6038/cjg20140312 |
石玉涛, 高原, 张永久, 等. 2013. 松潘-甘孜地块东部、川滇地块北部与四川盆地西部的地壳剪切波分裂. 地球物理学报, 56(2): 481-494. DOI:10.6038/cjg20130212 |
苏伟, 王椿镛, 黄忠贤. 2008. 青藏高原及邻区的Rayleigh面波的方位各向异性. 中国科学D辑:地球科学, 38(6): 674-682. |
孙长青, 雷建设, 李聪, 等. 2013. 云南地区地壳各向异性及其动力学意义. 地球物理学报, 56(12): 4095-4105. DOI:10.6038/cjg20131214 |
太龄雪, 高原, 刘庚. 2015. 利用中国地震科学台阵研究青藏高原东南缘地壳各向异性:第一期观测资料的剪切波分裂特征. 地球物理学报, 58(11): 4079-4091. DOI:10.6038/cjg20151116 |
王椿镛, 常利军, 吕智勇, 等. 2007. 青藏高原东部上地幔各向异性及相关的壳幔耦合型式. 中国科学D辑, 37(4): 495-503. |
王夫运, 潘素珍, 刘兰, 等. 2014. 玉溪-临沧剖面宽角地震探测-红河断裂带及滇南地壳结构研究. 地球物理学报, 57(10): 3247-3258. DOI:10.6038/cjg20141013 |
王琼, 高原, 石玉涛. 2015. 青藏高原东南缘基于背景噪声的Rayleigh面波方位各向异性研究. 地球物理学报, 58(11): 4068-4078. DOI:10.6038/cjg20151115 |
王苏, 徐晓雅, 胡家富. 2015. 青藏高原东南缘的地壳结构与动力学模式研究综述. 地球物理学报, 58(11): 4235-4253. DOI:10.6038/cjg20151129 |
吴建平, 明跃红, 王椿镛. 2004. 云南地区中小地震震源机制及构造应力场研究. 地震学报, 26(5): 457-465. DOI:10.3321/j.issn:0253-3782.2004.05.001 |
吴建平, 杨婷, 王未来, 等. 2013. 小江断裂带周边地区三维P波速度结构及其构造意义. 地球物理学报, 56(7): 2257-2267. DOI:10.6038/cjg20130713 |
熊绍柏, 郑晔, 尹周勋, 等. 1993. 丽江-攀枝花-者海地带二维地壳结构及其构造意义. 地球物理学报, 36(4): 434-444. DOI:10.3321/j.issn:0001-5733.1993.04.004 |
许忠淮. 2001. 东亚地区现今构造应力图的编制. 地震学报, 23(5): 492-501. DOI:10.3321/j.issn:0253-3782.2001.05.005 |
易桂喜, 姚华建, 朱介寿, 等. 2010. 用Rayleigh面波方位各向异性研究中国大陆岩石圈形变特征. 地球物理学报, 53(2): 256-268. DOI:10.3969/j.issn.0001-5733.2010.02.004 |
张岳桥, 李海龙. 2016. 青藏高原东部晚新生代重大构造事件与挤出造山构造体系. 中国地质, 43(6): 1829-1852. |
郑晨, 丁志峰, 宋晓东. 2016. 利用面波频散与接收函数联合反演青藏高原东南缘地壳上地幔速度结构. 地球物理学报, 59(9): 3223-3236. DOI:10.6038/cjg20160908 |
钟世军, 吴建平, 房立华, 等. 2017. 青藏高原东北缘及周边地区基于程函方程的面波层析成像. 地球物理学报, 60(6): 2304-2314. DOI:10.6038/cjg20170622 |
朱涛. 2018. 基于地幔动力学模拟推断云南地区剪切波各向异性源的深度. 地球物理学报, 61(3): 948-962. DOI:10.6038/cjg2018L0137 |
 2020, Vol. 63


