 2020, Vol. 63


2. 中国地震局第二监测中心, 西安 710054
2. Second Monitoring and Application Center, China Earthquake Administration, Xi'an 710054, China
大约50 Ma以来,印度与欧亚板块的碰撞及持续挤压造成了青藏高原的强烈隆升,使之成为全球最高、最大和最年轻的高原(Molnar and Tapponnier, 1978).大陆板块的碰撞挤压不仅导致了青藏高原的形成,还对高原周边的构造格局和气候环境等产生了重大影响(Manabe and Broccoli, 1990; Harrison et al., 1992; Molnar et al., 1993; Kutzbach et al., 1993).目前普遍认为青藏高原的生长不仅表现为高原的隆升,还表现在其面积和体积的扩张,且高原向北和东北扩张的趋势也得到了广泛一致的认识(An et al., 2001;Mulch and Chamberlain, 2006;Rowley and Currie, 2006).
青藏高原东北缘地处阿拉善块体,鄂尔多斯块体与青藏高原的交汇处(图 1a),是高原的重要组成部分,也是高原向大陆内部扩张生长的最前缘(张培震等,2006; 郑文俊等,2016).受印度板块的北向推挤,及鄂尔多斯和阿拉善块体的阻挡,青藏高原东北缘中-晚新生代以来构造变形强烈(雷启云等,2016).区域内主要发育3组断裂体系,包括近东西向-北东东向的大型走滑断裂带、北西西向的逆冲断裂带,以及北北西向的右旋走滑断裂带(郑文俊等,2016).现有活动构造研究表明,青藏高原东北缘的扩展方式主要是通过上述一系列北西西向褶皱和逆冲断裂进行的,且认为高原扩展前缘已到达阿拉善块体南缘,而在东北缘弧形构造带区域,以三关口—牛首山断裂为主的扩展边界也已形成(Zheng et al., 2013; 郑文俊等,2016).其次,区域内强震活动频繁,已发过多次7级以上的大地震(图 1a).现今GPS观测和地震震源机制研究显示,青藏高原东北缘正经历着强烈的北东向缩短变形(张培震等,2002;周荣军等,2006).

|
图 1 (a) 研究区块体构造图;(b)台站分布图 (a)中黑色粗线为块体边界线,黑色细线代表主要断裂,包括,F1:祁连山北缘断裂,F2:贺兰山断裂,F3:西秦岭北缘断裂,F4:六盘山断裂,F5:海原断裂,F6:天景山断裂,F7:阿尔金断裂,F8:东昆仑断裂,F9:龙门山断裂;红色圆形代表历史地震(1920—2018年),圆形的半径与震级的对应关系见图右侧,图片背景色表示高程,色标尺如图右侧所示;(b)中红色三角形代表CMG-3ESP地震计,蓝色三角形代表CMG-3T地震计,黑色圆点代表台站WT11,黑色粗虚线为本文构建的四条虚拟地震剖面.中间小图中红色方框表示研究区位置,红色五角星代表用于约束地壳厚度的地震事件震中位置. Fig. 1 (a) Tectonic setting of the study region; (b) Locations of seismic stations (a) The black thick lines represent boundaries of tectonic blocks, black thin lines represent faults. F1: North Qilian Fault, F2: Helanshan Fault, F3: Western Qinling Fault, F4: Liupan-shan Fault, F5: Haiyuan Fault, F6: Tianjingshan Fault, F7: Altyn Tagh Fault, F8: Eastern Kunlun Fault, F9: Longmenshan Fault. Red circles represent historical earthquakes(1920—2018), the corresponding relationship between radius of the circle and the magnitude is shown on the right. The background color represents the elevation, and the color bar is shown on the right; (b) The red triangles represent seismic stations of CMG-3ESP, the blue triangles represent seismic stations of CMG-3T, and the black dot marks the station WT11. Black dashed lines are the virtual seismic profiles. In the middle figure, the red box shows the study region, red star represents the epicenter of the seismic event used in this study. |
青藏高原东北缘由于其复杂的构造环境及强烈的地震活动,长期以来一直是地学研究的重点地区.自20世纪60年代以来,地学家已经在青藏高原东北缘地区进行了若干人工地震剖面的探测(张少泉等,1985;李清河等,1991;李松林等,2002;Zhang et al., 2011;郭文斌等,2016;李文辉等,2017),其中包括近些年来实施的玛沁—兰州—靖边剖面(李松林等,2002)、六盘山断裂带剖面(李文辉等,2017)以及玛多—共和—雅布赖剖面(郭文斌等,2016)等.除深地震探测外,从天然地震中提取接收函数是目前获取台站下方地壳厚度比较有效的方法之一.但该方法受限于台站的分布和密度,为此常通过布设密集宽频带流动地震台站来获取高分辨的地壳结构.目前,深地震测深和接收函数研究都显示青藏高原东北缘地区地壳要厚,但对地壳增厚的前缘位置以及增厚机制的认识仍存诸多争议(Liu et al., 2006; Pan and Niu, 2011; 沈旭章等,2013;刘启民等,2014; 李文辉等,2017;Wang et al., 2017; 王兴臣等, 2017; Xu et al., 2018).比如,不同的接收函数研究获得的青藏高原东北缘地区地壳增厚的前缘位置形态特征还存有较大差异(Wang et al., 2017; Xu et al., 2018).此外,需要提出的是,在一些相对复杂的构造区域,例如Moho界面发生急剧变化的地区,采用接收函数H-κ扫描法对地壳厚度常会产生一些不合理的估算(危自根等,2016).
除上述两种方法外,虚拟地震测深法(Virtual Deep Seismic Sounding,简称VDSS方法)也是约束地壳厚度的一种有效方法(Tseng et al., 2009).近年来该方法已被广泛应用于对藏南(Tseng et al., 2009)和川滇地区(亢豆等,2017;魏晓拙等,2018)、华北克拉通(Yu et al., 2012),以及美国西部(Yu et al., 2016)地壳结构的研究中.
本文利用“中国地震科学台阵探测”项目在南北地震带北段记录到的波形资料,采用VDSS方法对青藏高原东北缘及周边地区的地壳厚度进行研究,以期为研究青藏高原东北向扩展的前缘位置,以及扩展的动力学模式等提供地球物理学依据.
1 数据与方法2013年至2016年,中国地震局地球物理研究所作为牵头单位实施“中国地震科学台阵探测(ChinArray)”项目,在南北地震带北段开展了大型密集流动台阵的观测.该台阵共包括676个宽频带流动地震台,台间距约30 km,台站具体位置见图 1b.从图 1b中我们可以看到,上述台阵较好的覆盖了青藏高原东北缘地区,包括祁连和秦岭造山带,以及周边的阿拉善和鄂尔多斯地块.
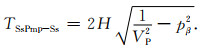
VDSS方法是利用远震S波入射至地表激发的下行P波在Moho界面反射的震相SsPmp(图 2)与直达S波之间的到时差来约束地壳厚度(Tseng et al., 2009;刘震等, 2015).如果用H和pβ分别表示地壳厚度和射线参数,VP为地壳的平均P波速度,则SsPmp与直达S波的到时差TSsPmp可以表示为

|
图 2 Ss,Sp,SsPmp震相射线路径示意图 Fig. 2 Sketch showing ray paths of Ss, Sp, and SsPmp |
|
(1) |
由式(1)可知,当给定合适的地壳平均P波速度,地壳厚度H可通过SsPmp震相与S波的到时差获得.
当震中距小于50°,远震S波经地表反射转换的P波在Moho界面发生全反射时,台站接收的SsPmp震相能量较强,因而能够在地震记录中清晰地识别(刘震等,2015).与接收函数方法相比,高信噪比的SsPmp震相使得虚拟地震测深方法不需要对数据进行反褶积,避免了反褶积过程中的不稳定因素影响(Yu et al., 2012).但VDSS方法要求采用深源地震事件约束地壳厚度,因此相比于接收函数方法,可用的地震事件要少.
为利用VDSS方法,我们从上述ChinArray台阵记录的远震目录中筛选震级大于5.7,震中距在30°到50°之间,震源深度深,且高信噪比的地震事件.选取30°~50°的远震事件,一方面是为避免上地幔速度间断面产生的三重震相的干扰,另一方面又须满足SsPmp震相在Moho界面须达到全反射的要求.深地震事件的选取主要是用来排除浅部结构的干扰.本文最终选取了菲律宾南部发生的一个深地震事件(见表 1),台阵观测记录的震中距范围为29.1°~42.1°.该地震事件震源时间函数相对简单,且大多台站的波形记录具有较高的信噪比,因而便于SsPmp震相的识别.我们将原始波形记录的南北、东西分量旋转至径向和切向方向,并进行频率范围为0.05~0.5 Hz的带通滤波.为保证波形质量,我们手动剔除了一些P波初至不清晰的台站记录,最后共挑选出508个台站用于约束研究区的地壳厚度.
|
|
表 1 本文所选的地震事件信息 Table 1 Information of the seismic event used in this study |
目前,VDSS方法常采用波形模拟SsPmp与S波震相之间的到时差来约束地壳厚度.频率波数法(F-K方法)(Zhu and Rivera, 2002)是一种针对均匀分层介质模型计算理论地震图的方法,目前被广泛应用于波形模拟研究工作中.在本文研究中,对每一个台站,我们选取地壳厚度在30~70 km的范围内进行扫描,并利用F-K方法计算相应的理论地震图.然后,通过计算一定时窗范围内观测资料与理论地震图之间的相关系数,判断波形的拟合程度,从而求取最佳地壳厚度模型.此外,本文计算理论地震图使用的震源机制解来自Harvard给出的CMT目录(Dziewonski et al., 1981; Ekström and Dziewonski, 1985),震源时间函数根据远震记录进行估计,震源深度通过远震记录中初至波与深度震相(pP和sP)之间的到时差来进行校正.本文对接收台站下方的垂向与径向分量同时进行波形模拟,因而在一定程度上大大提高了结果的可靠性.
以往的波形模拟测试研究显示,地壳内小尺度结构的横向变化(Tseng et al., 2009),包括地壳厚度的变化,基本不会造成SsPmp震相波形的变化(刘震,2015).为此,本文在计算理论地震图过程中,以IASP91模型为参考,将其地壳模型简化为单层模型.根据前人对研究区地壳速度结构的研究成果(许忠淮等,2003;Liu et al., 2006;Jia et al., 2010;王帅军等,2019),我们取地壳平均P波速度(VP)为6.3 km·s-1,Pn波速度设置为8.1 km·s-1.
考虑到青藏高原东北缘及周边地区的地壳平均P波速度,在6.3 km·s-1基础上有±0.2 km·s-1的横向变化(董兴朋和滕吉文,2018),本文测试了不同的VP对研究结果的影响.图 3是对WT11台站(台站位置见图 1b)进行VP扰动测试的结果.测试结果显示,VP±0.2 km·s-1的变化使得地壳厚度产生约3.2 km的扰动,该扰动基本不会对本文结论产生影响,因此我们认为,地壳平均P波速度取6.3 km·s-1对于青藏高原东北缘地壳厚度的约束基本合适.

|
图 3 地壳平均P波速度变化对地壳厚度的扰动测试 左侧纵坐标为本测试中地壳平均P波速度VP的变化范围,右侧纵坐标表示通过波形模拟所得各VP值对应的地壳厚度,黑色波形是WT11台站的观测记录,红色波形为各VP值对应下的达到最佳拟合的理论地震图,(a)为垂向分量,(b)为径向分量,直达S波在0时刻对齐,SsPmp震相在图中已标出. Fig. 3 Test of crustal thickness by VP variation Vertical coordinate on left is VP, vertical coordinate on right is the crust thickness corresponding to each VP obtained by waveform simulation, the black waveform is the observation of WT11, red waveform is the best fit synthetic. (a) is the vertical component, (b) is the radial component, the direct S-waves are aligned at time 0, and the SsPmp phase is marked in the figure. |
另一方面,当研究区地形与Moho界面起伏剧烈,若台站位于倾斜界面上方,平层假设下的波形拟合得到的结果会与实际情况有所差异(Yu et al., 2012).当Moho界面倾斜约10°时,会对结果产生约±3 km的影响(亢豆等,2017),这基本也不会影响本文结论.
2 结果图 4是采用VDSS波形模拟方法获取台站下方地壳厚度的一个示例.以WT11台站为例,图 4a是该台站观测资料与最佳地壳厚度模型计算的理论地震图的对比图.由图 4a可知,WT11台站垂向与径向分量波形拟合均较好,其对应的相关系数分别为0.83和0.97.图 4b、c分别是是垂向与径向分量波形拟合相关系数随地壳厚度的变化图.从该图中可以看到,两个不同分量波形模拟获得的地壳厚度具有很好的一致性,均为45.5 km.

|
图 4 WT11台站波形模拟结果 (a)径向与垂向分量波形模拟结果图(黑色:观测波形;红色:最佳地壳厚度模型计算的理论地震图);(b)和(c)分别为径向与垂向分量观测资料与理论地震图的相关系数随地壳厚度变化图(图中红色正方形为相关系数最大值点). Fig. 4 Waveform modeling results of station WT11 (a) Waveform modeling result of radial and vertical components (black: observed seismogram; Red: synthetic seismogram calculated by the best crustal thickness model); (b) and (c) are the correlation coefficients between the observed and synthetic seismogram of radial and vertical components varying with the crustal thickness (red squares are the maximum points of the correlation coefficients). |
利用VDSS方法,我们得到了青藏高原东北缘及其周边地区地壳厚度的分布.为比较不同块体间地壳厚度的差异,我们穿过不同块体构建了四条虚拟地震剖面(图 5~8),各剖面位置见图 1b.在每条剖面中我们均给出了垂向与径向分量虚拟地震剖面图.图 5展示的是沿AA′的虚拟地震剖面图.由图 5可以看到,SsPmp震相能量强,沿整个剖面,在垂向与径向分量虚拟地震剖面图上均可连续追踪到.其次,与径向分量相比,垂向分量虚拟地震剖面上SsPmp震相更容易识别.与此同时,不同分量虚拟地震剖面所得到的地壳厚度变化趋势具有很好的一致性,即,剖面由东向西地壳增厚趋势明显,鄂尔多斯块体下方约40 km,阿拉善块体约为50 km左右,向西进入祁连山地块下方,地壳迅速增厚达60 km以上.

|
图 5 沿AA′的虚拟地震剖面 (a)和(b)分别为垂向与径向分量剖面结果.剖面图中,从上至下依次为高程,观测波形,理论地震图和地壳厚度,其中直达S波在零时刻对齐,红色倒三角是通过波形拟合得到的SsPmp震相的到时,空心倒三角为ScP震相理论到时.剖面穿过的块体名称分别为,QL:祁连造山带,WQ:西秦岭造山带,AL:阿拉善块体,OR:鄂尔多斯块体,断裂名称同图 1a. Fig. 5 Virtual seismic profiles of AA′ (a) and (b) are the profile results of radial and vertical components. Elevation, observation waveform, synthetic and crustal thickness are shown from top to bottom, direct S-waves are aligned at time zero, red inverted triangles mark the arrival time of SsPmp obtained by waveform modeling, open inverted triangles mark the theoretical arrival time of ScP. QL: Qilian orogenic belt, WQ: Western Qinling orogenic belt, AL: Alxa Block, OR: Ordos Block. Fault names are same as Fig. 1a. |

|
图 6 沿BB′的虚拟地震剖面(图中标注同图 5) Fig. 6 Virtual seismic profiles of BB′(The mark in the figure is the same as that in Fig. 5) |

|
图 7 沿CC′的虚拟地震剖面(图中标注同图 5) (a)和(b)中图中阴影部分标明六盘山断裂带下方SsPmp震相,该位置对应的地壳厚度通过拟合到时较早的SsPmp震相获得. Fig. 7 Virtual seismic profiles of CC′(The mark in the figure is the same as that in Fig. 5) The shaded parts in (a) and (b) mark the SsPmp phase beneath the Liupan-shan fault, the crustal thickness at this part obtained by fitting the SsPmp phase arrived earlier. |

|
图 8 沿DD′的虚拟地震剖面(图中标注同图 5) Fig. 8 Virtual seismic profiles of DD′ (The mark in the figure is the same as that in Fig. 5) |
图 6是沿BB′的虚拟地震剖面,该剖面由东向西依次穿过鄂尔多斯块体中部、阿拉善块体南部,以及祁连造山带中部.由于受ScP震相的影响,BB′垂向分量虚拟地震剖面较复杂.例如位于106°N附近的一些台站下方,IASP91模型计算的ScP震相与S直达波同时到达,发生震相重叠.另一种情况是ScP震相可能与S直达波之后的SsPmp震相发生重叠.在波形发生重叠,难以有效识别S直达波或SsPmp震相的情况下,可能会导致地壳厚度估算不确定性增加.在这种情况下,地壳厚度主要通过径向分量剖面波形模拟的结果来获得.BB′剖面结果显示,鄂尔多斯中部地块下方Moho界面约为50 km深,阿拉善块体下方约为45 km,然后向西缓慢加深,到祁连山北缘下方Moho埋深约在60 km左右.
图 7是沿CC′的虚拟地震剖面.该剖面自东向西主要穿过鄂尔多斯块体南部、祁连造山带东部和西秦岭造山带西部.与AA′剖面类似,CC′剖面中紧邻S直达波之后的SsPmp震相振幅大,且在垂向分量剖面上更容易识别.值得注意的是,CC′剖面中六盘山断裂带附近的台站下方,在S直达波之后5~10 s的窗口范围内,出现两个相邻震相,且这两个震相振幅几乎相当(图 7阴影部分).通过波形模拟结果显示,这两个震相所对应的Moho界面的深度分别为37 km和57 km.据此,我们推测六盘山断裂带附近可能存在双Moho界面特征.在CC′剖面中,除六盘山断裂带外,鄂尔多斯地块、祁连地块和西秦岭地块台站下方的SsPmp震相均比较简单.由CC′剖面波形模拟结果(图 7)可知,鄂尔多斯块体南部地壳厚度为45~50 km,祁连造山带地壳厚度从东到西由45 km逐渐加深到55 km左右,西秦岭造山带下方地壳最厚,达60 km.
DD′剖面沿108°E从北到南依次穿过银川—河套盆地、鄂尔多斯和秦岭地块,和四川盆地(图 8).由图 8可以看到,该剖面垂向分量上SsPmp震相较清晰,且不受其他复杂震相的干扰.该剖面结果最明显的特征之一是鄂尔多斯块体下方,Moho界面在南北方向上呈现中央下凹的形态特征,即块体南北两侧地壳厚度要薄,约为40~45 km,而中央地区地壳厚度达50 km.
整个研究区SsPmp震相反射点处的Moho面埋深分布见图 9b、c.总体来看,研究区内地壳厚度变化剧烈.其中,在祁连和西秦岭地块内,地壳由东向西增厚趋势比较明显,即约以103°E为界,东部地区地壳厚度为45~50 km,而西部地区则厚达55 km以上.紧邻祁连造山带的阿拉善南缘地块,地壳也明显增厚,已经逼近55 km,而阿拉善块体内部地壳厚度仅为45~50 km.与其他地块相比,鄂尔多斯地块下方地壳相对要薄,但整体而言,鄂尔多斯地块地壳呈现南北薄(40~45 km)、中央厚(约50 km)的形态特征.

|
图 9 (a) 用于约束地壳厚度的台站分布(红色三角形)和SsPmp震相在Moho界面上反射点的分布图(黑色圆点);(b) SsPmp震相反射点处Moho界面深度图;(c)通过插值得到的整个研究区地壳厚度分布图,其中,六盘山断裂带附近通过拟合到时较早的SsPmp震相获得地壳厚度;(d)为接收函数H-κ方法得到的地壳厚度分布(Wang et al., 2017) Fig. 9 (a) Seismic station used to constrain the crustal thickness (red triangle) and reflection point distribution of SsPmp phase at Moho (black dots); (b) The Moho depth distribution at the reflection point of SsPmp phase; (c) The crustal thickness distribution in the study region by interpolation. Near the Liupan-shan fault, crustal thickness is obtained by fitting the SsPmp phase arrived earlier; (d) Crustal thickness obtained by the H-κ stacking method (Wang et al., 2017) |
利用VDSS方法获取的地壳厚度与已有的接收函数扫描法得到的结果基本一致(图 9c、d),即祁连和西秦岭造山带西部地区地壳已明显增厚,而周边地区,如阿拉善和鄂尔多斯地块,则相对要薄(刘启民等,2014;Wang et al., 2014, 2017; Li et al., 2017; 王兴臣等, 2017; Xu et al., 2018).同时,接收函数研究显示,祁连和西秦岭地块下方地壳平均泊松要低(0.22~0.25).如此低的泊松比可能意味着地壳组分以长英质为主(李永华等, 2006; 王兴臣等, 2017).其次,最近的人工地震测深玛多—共和—门源—雅布赖的剖面显示,祁连块体下方地壳底部P波速度较低(≤6.6 km·s-1),暗示该区高速下地壳的缺失(嘉世旭,私人交流).祁连地块下方,地壳中长英质组分增加、铁镁质组分减少,以及高速下地壳的缺失可用来支持地壳均一缩短增厚说(England and Housman, 1986).该模型认为青藏高原的地壳增厚主要是由于地壳和岩石圈均匀缩短引起的.因此一种可能是在地壳缩短和增厚同时,岩石圈地幔也发生增厚缩短.冷的岩石圈地幔会诱发对流失稳,最终导致岩石圈的部分或全部拆沉,从而造成研究区下地壳铁镁质岩石层的缺失(张培震等,2006).
在祁连造山带与阿拉善块体交界地区,我们发现地壳的增厚越过祁连山北缘断裂,已延伸至阿拉善地块南缘.这与活动构造研究能很好的吻合(Zheng et al., 2013; 郑文俊等,2016; 雷启云等,2016).比如,郑文俊等(2016)对合黎山(河西走廊中段)隆升时间的研究显示,青藏高原的北向生长在早更新世早期便到达阿拉善块体南缘一带.张宁等(2016)通过野外地质调查和卫星影像研究认为河西走廊西北侧的黑山断裂,与其在走向上相连的金塔南山断裂、磴磴山断裂共同构成青藏高原北东向扩展的最前缘.这些观测资料均表明青藏高原北东向扩张的前缘越过祁连山北缘断裂已到达阿拉善块体南缘.
其次,本文结果显示六盘山断裂带地壳结构较复杂,具有双重Moho界面特征.这在之前的接收函数研究中也有提及到.例如,Shen等(2017)的P波接收函数结果显示六盘山造山带下Moho深度周围出现明显的双层复杂结构,上层埋深约在40 km,而下层约在60 km.这与本文所估算的六盘山断裂带下方的双重Moho界面深度也较为一致,但比人工地震测深的要深.比如,李文辉等(2017)在青藏高原东北缘—六盘山断裂带—鄂尔多斯地块的宽角反射和折射地震剖面发现,六盘山断裂带下方Moho发生重叠,上层呈拱形,埋深约在36.5 km,下层总体较平在48 km左右.关于六盘山Moho界面重叠,一些研究认为是由于鄂尔多斯块体对青藏高原横向扩张的强阻挡所造成的(Shen et al., 2017),也有研究认为与鄂尔多斯下地壳挤入青藏高原东北缘地壳有关(李文辉等,2017).上述不同方法所揭示的六盘山断裂带地壳结构的差异和动力学机制仍然有待于进一步研究.
与此同时,本文VDSS方法得到鄂尔多斯地块下方地壳厚度呈现南北薄(40~45 km)、中央厚(约50 km)的形态特征.这与Yu等(2012)采用VDSS方法得到的结果较为一致.从DD′剖面(图 8)可以看到,该地区波形拟合度较高,所得地壳厚度结果较为可靠.鄂尔多斯地块地壳厚度的不均匀性在最近的接收函数研究中也观测到.但与本文观测结果不同,接收函数研究显示鄂尔多斯地块地壳南厚(约45 km)北薄(约40 km)(图 9d,Wang et al., 2017).鄂尔多斯块体下方,虚拟地震测深法与接收函数两种不同方法得到的地壳厚度的结果差异仍需后续研究进一步确认.
4 结论本文利用“中国地震科学台阵探测”项目二期在南北地震带北段布设的密集流动台阵资料,采用虚拟地震测深方法,获得了青藏高原东北缘及周边地区地壳厚度的分布.结果显示,研究区地壳厚度变化剧烈.以103°E为界,祁连和西秦岭地块内东西两侧地壳厚度差异明显,东部地区为45~50 km,西部地区则超过55 km.与祁连造山带相接的阿拉善块体南部边界地区地壳厚度大约逼近55 km,而阿拉善块体内部约为45~50 km.与阿拉善块体不同,鄂尔多斯块体地壳则表现为南北薄,中央厚的形态特征.此外,在六盘山断裂带附近观测到地壳存在双Moho界面特征.结合其他研究结果,我们认为青藏高原东北缘地壳增厚方式以均匀缩短增厚为主,且其向北东扩展的前缘已越过祁连山北缘断裂,进入阿拉善块体南缘.
致谢 感谢所有参与中国地震科学台阵探测(ChinArray)项目的规划者和实施者,感谢中国地震局地球物理研究所“中国地震科学台阵数据中心”为本研究提供了地震波形数据(喜马拉雅地震科学台阵,2011).感谢评审专家对本文提出的宝贵意见.
An Z S, Kutzbach J E, Prell W L, et al. 2001. Evolution of Asian monsoons and phased uplift of the Himalaya-Tibetan Plateau since Late Miocene times. Nature, 411(6833): 62-66. DOI:10.1038/35075035 |
Dong X P, Teng J W. 2018. Traveltime tomography using teleseismic P wave in the northeastern Tibetan plateau. Chinese Journal of Geophysics (in Chinese), 61(5): 2066-2074. DOI:10.6038/cjg2018K0214 |
Dziewonski A M, Chou T A, Woodhouse J H. 1981. Determination of earthquake source parameters from waveform data for studies of global and regional seismicity. Journal of Geophysical Research, 86(B4): 2825-2852. DOI:10.1029/JB086iB04p02825 |
Ekström G, Dziewonski A M. 1985. Centroid-moment tensor solutions for 35 earthquakes in western North America (1977-1983). Bulletin of the Seismological Society of America, 75(1): 23-39. |
England P, Housman G. 1986. Finite strain calculations of continental deformation:2. Comparison with the India-Asia collision zone. Journal of Geophysical Research, 91(B3): 3664-3676. DOI:10.1029/JB091iB03p03664 |
Guo W B, Jia S X, Duan Y H, et al. 2016. A study on the basement tectonic units in the northeast margin of Tibetan plateau-the result of Maduo-Gonghe-Yabrai reflaction profile. Chinese Journal of Geophysics (in Chinese), 59(10): 3627-3636. DOI:10.6038/cjg20161010 |
Harrison T M, Copeland P, Kidd W S F, et al. 1992. Raising Tibet. Science, 255(5052): 1663-1670. DOI:10.1126/science.255.5052.1663 |
Jia S X, Zhang X K, Zhao J R, et al. 2010. Deep seismic sounding data reveal the crustal structures beneath Zoigê basin and its surrounding folded orogenic belts. Science China Earth Sciences, 53(2): 203-212. DOI:10.1007/s11430-009-0166-0 |
Kang D, Yu C Q, Chen J H, et al. 2017. Study on the crustal structure in Sichuan-Yunnan region based on virtual deep seismic sounding method. Acta Scientiarum Naturalium Universitatis Pekinensis, 53(5): 825-832. DOI:10.13209/j.0479-8023.2017.042 |
Kutzbach J E, Prell W L, Ruddiman W F. 1993. Sensitivity of Eurasian Climate to surface uplift of the Tibetan Plateau. The Journal of Geology, 101(2): 177-190. DOI:10.1086/648215 |
Lei Q Y, Zhang P Z, Zheng W J, et al. 2016. Dextral strike-slip of Sanguankou-Niushoushan fault zone and extension of arc tectonic belt in the northeastern margin of the Tibet Plateau. Science China Earth Sciences, 59(5): 1025-1040. DOI:10.1007/s11430-016-5272-1 |
Li Q H, Guo J K, Zhou M D, et al. 1991. The velocity structure of Chengxian-Xiji profile. Northwestern Seismological Journal (in Chinese), 13(Supplement): 37-43. |
Li S L, Zhang X K, Zhang C K, et al. 2002. A preliminary study on the crustal velocity structure of Maqin-Lanzhou-Jingbian by means of deep seismic sounding profile. Chinese Journal of Geophysics (in Chinese), 45(2): 210-217. DOI:10.3321/j.issn:0001-5733.2002.02.007 |
Li W H, Gao R, Wang H Y, et al. 2017. Crustal structure beneath the Liupanshan fault zone and adjacent regions. Chinese Journal of Geophysics (in Chinese), 60(6): 2265-2278. DOI:10.6038/cjg20170619 |
Li Y H, Wang X C, Zhang R Q, et al. 2017. Crustal structure across the NE Tibetan Plateau and Ordos Block from the joint inversion of receiver functions and Rayleigh-wave dispersions. Tectonophysics, 705: 33-41. DOI:10.1016/j.tecto.2017.03.020 |
Li Y H, Wu Q J, An Z H, et al. 2006. The Poisson ratio and crustal structure across the NE Tibetan Plateau determined from receiver functions. Chinese Journal of Geophysics (in Chinese), 49(5): 1359-1368. DOI:10.3321/j.issn:0001-5733.2006.05.015 |
Liu M J, Mooney W D, Li S L, et al. 2006. Crustal structure of the northeastern margin of the Tibetan plateau from the Songpan-Ganzi terrane to the Ordos basin. Tectonophysics, 420(1-2): 253-266. DOI:10.1016/j.tecto.2006.01.025 |
Liu Q M, Zhao J M, Lu F, et al. 2014. Crustal structure of northeastern margin of the Tibetan Plateau by receiver function inversion. Science China Earth Sciences, 57(4): 741-750. DOI:10.1007/s11430-013-4772-5 |
Liu Z. 2015. The Method of Virtual Deep Seismic Sounding and its implications in the study of crustal thickness beneath the Qinling orogenic belt and adjacent regions[Ph. D. thesis] (in Chinese). Beijing: University of Chinese Academy of Science.
|
Liu Z, Tian X B, Zhu G H, et al. 2015. Probing the Moho interface using SsPmp waves. Chinese Journal of Geophysics (in Chinese), 58(10): 3571-3582. DOI:10.6038/cjg20151012 |
Manabe S, Broccoli A J. 1990. Mountains and arid climates of middle latitudes. Science, 247(4939): 192-195. DOI:10.1126/science.247.4939.192 |
Molnar P, England P, Martinod J. 1993. Mantle dynamics, uplift of the Tibetan Plateau, and the Indian monsoon. Reviews of Geophysics, 31(4): 357-396. DOI:10.1029/93RG02030 |
Molnar P, Tapponnier P. 1978. Active tectonics of Tibet. Journal of Geophysical Research, 83(B11): 5361-5375. DOI:10.1029/JB083iB11p05361 |
Mulch A, Chamberlain C P. 2006. The rise and growth of Tibet. Nature, 439(7077): 670-671. DOI:10.1038/439670a |
Pan S Z, Niu F L. 2011. Large contrasts in crustal structure and composition between the Ordos plateau and the NE Tibetan plateau from receiver function analysis. Earth and Planetary Science Letters, 303(3-4): 291-298. DOI:10.1016/j.epsl.2011.01.007 |
Rowley D B, Currie B S. 2006. Palaeo-altimetry of the Late Eocene to Miocene Lunpola basin, Central Tibet. Nature, 439(7077): 677-681. DOI:10.1038/nature04506 |
Shen X Z, Liu M, Gao Y, et al. 2017. Lithospheric structure across the northeastern margin of the Tibetan Plateau:Implications for the plateau's lateral growth. Earth and Planetary Science Letters, 459: 80-92. DOI:10.1016/j.epsl.2016.11.027 |
Shen X Z, Zhou Y Z, Zhang Y S, et al. 2013. Geodynamic significance of the crust structure beneath the northeastern margin of Tibet. Progress in Geophysics (in Chinese), 28(5): 2273-2282. DOI:10.6038/pg20130509 |
Tseng T L, Chen W P, Nowack R L. 2009. Northward thinning of Tibetan crust revealed by virtual seismic profiles. Geophysical Research Letters, 36(24): L24304. DOI:10.1029/2009GL040457 |
Wang C Y, Sandvol E, Zhu L, et al. 2014. Lateral variation of crustal structure in the Ordos block and surrounding regions, North China, and its tectonic implications. Earth and Planetary Science Letters, 387: 198-211. DOI:10.1016/j.epsl.2013.11.033 |
Wang S J, Liu B J, Tian X F, et al. 2019. Crustal P-wave velocity structure in the northeastern margin of the Qinghai-Tibetan Plateau and insights into crustal deformation. Science China Earth Sciences, 61(2): 1221-1237. DOI:10.1007/s11430-017-9227-7 |
Wang W L, Wu J P, Fang L H, et al. 2017. Sedimentary and crustal thicknesses and Poisson's ratios for the NE Tibetan Plateau and its adjacent regions based on dense seismic arrays. Earth and Planetary Science Letters, 462: 76-85. DOI:10.1016/j.epsl.2016.12.040 |
Wang X C, Ding Z F, Wu Y, et al. 2017. Crustal thicknesses and Poisson's ratios beneath the northern section of the north-south seismic belt and surrounding areas in China. Chinese Journal of Geophysics (in Chinese), 60(6): 2080-2090. DOI:10.6038/cjg20170605 |
Wei X Z, Jiang M M, Chen L, et al. 2018. New VDSS method based on dense linear array and its applications. Progress in Geophysics (in Chinese), 33(3): 986-992. DOI:10.6038/pg2018BB0201 |
Wei Z G, Chu R S, Chen L, et al. 2016. Analysis of H-k stacking of receiver functions beneath crust with complex structure:taking the Anatolia Plate as an example. Chinese Journal of Geophysics (in Chinese), 59(11): 4048-4062. DOI:10.6038/cjg20161110 |
Xu X M, Niu F L, Ding Z F, et al. 2018. Complicated crustal deformation beneath the NE margin of the Tibetan plateau and its adjacent areas revealed by multi-station receiver-function gathering. Earth and Planetary Science Letters, 497: 204-216. DOI:10.1016/j.epsl.2018.06.010 |
Xu Z H, Wang S Y, Pei S P. 2003. Lateral variation of Pn velocity beneath northeastern marginal region of Qingzang plateau. Acta Seismologica Sinica (in Chinese), 25(1): 24-31. |
Yu C Q, Chen W P, Ning J Y, et al. 2012. Thick crust beneath the Ordos plateau:implications for instability of the North China Craton. Earth and Planetary Science Letters, 357-358: 366-375. DOI:10.1016/j.epsl.2012.09.027 |
Yu C Q, Chen W P, van der Hilst R D. 2016. Constraints on residual topography and crustal properties in the western United States from virtual deep seismic sounding. Journal of Geophysical Research:Solid Earth, 121(8): 5917-5930. DOI:10.1002/2016JB013046 |
Zhang N, Zheng W J, Liu X W, et al. 2016. Kinematics characteristics of Heishan fault in the Western Hexi corridor and its implications for regional tectonic transformation. Journal of Earth Sciences and Environment (in Chinese), 38(2): 245-257. |
Zhang P Z, Wang Q, Ma Z J. 2002. GPS velocity field and active crustal deformation in and around the Qinghai-Tibet plateau. Earth Science Frontiers (in Chinese), 9(2): 442-450. |
Zhang P Z, Zheng D W, Yin G M, et al. 2006. Discussion on late Cenozoic growth and rise of northeastern margin of the Tibetan Plateau. Quaternary Sciences (in Chinese), 26(1): 5-13. |
Zhang R Q, Wu Q J, Li Y H, et al. 2011. Differential patterns of SH and P wave velocity structures in the transition zone beneath northwestern Tibet. Science China Earth Sciences, 41(5): 1511-1562. DOI:10.1007/s11430-011-4228-8 |
Zhang S Q, Wu L J, Guo J M, et al. 1985. An interpretation of the DSS data Menyuan-Pingliang-Weinan profile in West China. Acta Geophysica Sinica (in Chinese), 28(5): 460-472. |
Zhang Z J, Klemperer S, Bai Z M, et al. 2011. Crustal structure of the Paleozoic Kunlun orogeny from an active-source seismic profile between Moba and Guide in East Tibet, China. Gondwana Research, 19(4): 994-1007. DOI:10.1016/j.gr.2010.09.008 |
Zheng W J, Zhang P Z, Ge W P, et al. 2013. Late Quaternary slip rate of the South Heli Shan Fault (Northern Hexi corridor, NW China) and its implications for northeastward growth of the Tibetan Plateau. Tectonics, 32(2): 271-293. DOI:10.1002/tect.20022 |
Zheng W J, Yuan D Y, Zhang P Z, et al. 2016. Tectonic geometry and kinematic dissipation of the active faults in the northeastern Tibetan plateau and their implications for understanding northeastward growth of the plateau. Quaternary Sciences (in Chinese), 36(4): 775-788. DOI:10.11928/j.issn.1001-7410.2016.04.01 |
Zhou R J, Li Y, Densmore A L, et al. 2006. Active tectonics of the eastern margin of the Tibet plateau. Journal of Mineralogy and Petrology (in Chinese), 26(2): 40-51. |
Zhu L P, Rivera L A. 2002. A note on the dynamic and static displacements from a point source in multilayered media. Geophysical Journal International, 148(3): 619-627. DOI:10.1046/j.1365-246X.2002.01610.x |
董兴朋, 滕吉文. 2018. 青藏高原东北缘远震P波走时层析成像研究. 地球物理学报, 61(5): 2066-2074. DOI:10.6038/cjg2018K0214 |
郭文斌, 嘉世旭, 段永红, 等. 2016. 青藏高原东北缘基底结构研究——玛多-共和-雅布赖剖面上地壳地震折射探测. 地球物理学报, 59(10): 3627-3636. DOI:10.6038/cjg20161010 |
亢豆, 俞春泉, 陈九辉, 等. 2017. 川滇地区地壳结构的虚拟地表震源反射测深法研究. 北京大学学报, 53(5): 825-832. DOI:10.13209/j.0479-8023.2017.042 |
雷启云, 张培震, 郑文俊, 等. 2016. 青藏高原东北缘三关口-牛首山断裂的右旋走滑与弧形构造带扩展. 中国科学:地球科学, 46(5): 691-705. DOI:10.1360/N072015-00254 |
李清河, 郭建康, 周民都, 等. 1991. 成县-西吉剖面地壳速度结构. 西北地震学报, 13(增刊): 37-43. |
李松林, 张先康, 张成科, 等. 2002. 玛沁-兰州-靖边地震测深剖面地壳速度结构的初步研究. 地球物理学报, 45(2): 210-217. DOI:10.3321/j.issn:0001-5733.2002.02.007 |
李文辉, 高锐, 王海燕, 等. 2017. 六盘山断裂带及其邻区地壳结构. 地球物理学报, 60(6): 2265-2278. DOI:10.6038/cjg20170619 |
李永华, 吴庆举, 安张辉, 等. 2006. 青藏高原东北缘地壳S波速度结构与泊松比及其意义. 地球物理学报, 49(5): 1359-1368. DOI:10.3321/j.issn:0001-5733.2006.05.015 |
刘启民, 赵俊猛, 卢芳, 等. 2014. 用接收函数方法反演青藏高原东北缘地壳结构. 中国科学:地球科学, 44(4): 668-679. DOI:10.1007/s11430-013-4772-5 |
刘震. 2015.虚拟地震测深方法研究及其在秦岭造山带和邻区地壳厚度研究中的应用[博士论文].北京: 中国科学院大学.
|
刘震, 田小波, 朱高华, 等. 2015. SsPmp震相地壳探测方法. 地球物理学报, 58(10): 3571-3582. DOI:10.6038/cjg20151012 |
沈旭章, 周元泽, 张元生, 等. 2013. 青藏高原东北缘地壳结构变化的地球动力学意义. 地球物理学进展, 28(5): 2273-2282. DOI:10.6038/pg20130509 |
王帅军, 刘保金, 田晓峰, 等. 2019. 青藏高原东北缘地壳P波速度结构及其对地壳变形研究的启示. 中国科学:地球科学, 49(2): 368-382. |
王兴臣, 丁志峰, 武岩, 等. 2017. 中国南北地震带北段及其周缘地壳厚度与泊松比研究. 地球物理学报, 60(6): 2080-2090. DOI:10.6038/cjg20170605 |
魏晓拙, 姜明明, 陈凌, 等. 2018. 一种基于密集线性台阵的虚拟地震测深新方法及其应用. 地球物理学进展, 33(3): 986-992. DOI:10.6038/pg2018BB0201 |
危自根, 储日升, 陈凌, 等. 2016. 复杂地壳接收函数H-k叠加——以安纳托利亚板块为例. 地球物理学报, 59(11): 4048-4062. DOI:10.6038/cjg20161110 |
许忠淮, 汪素云, 裴顺平. 2003. 青藏高原东北缘地区Pn波速度的横向变化. 地震学报, 25(1): 24-31. |
张宁, 郑文俊, 刘兴旺, 等. 2016. 河西走廊西端黑山断裂运动学特征及其在构造转换中的意义. 地球科学与环境学报, 38(2): 245-257. |
张培震, 王琪, 马宗晋. 2002. 青藏高原现今构造变形特征与GPS速度场. 地学前缘, 9(2): 442-450. |
张培震, 郑德文, 尹功明, 等. 2006. 有关青藏高原东北缘晚新生代扩展与隆升的讨论. 第四纪研究, 26(1): 5-13. |
张少泉, 武利军, 郭建明, 等. 1985. 中国西部地区门源-平凉-渭南地震测深剖面资料的分析解释. 地球物理学报, 28(5): 460-472. |
郑文俊, 袁道阳, 张培震, 等. 2016. 青藏高原东北缘活动构造几何图像、运动转换与高原扩展. 第四纪研究, 36(4): 775-788. DOI:10.11928/j.issn.1001-7410.2016.04.01 |
周荣军, 李勇, Densmore A L, 等. 2006. 青藏高原东缘活动构造. 矿物岩石, 26(2): 40-51. |