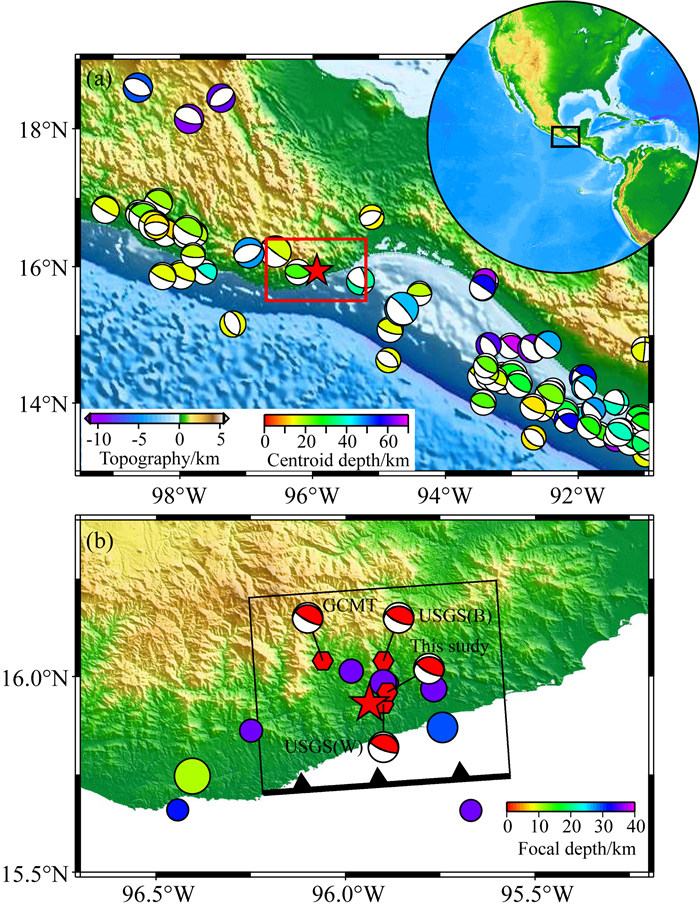
根据美国地质调查局(USGS)测定,2020年6月23日15时29分(UTC)(北京时间2020年6月23日23时29分),于墨西哥南部瓦哈卡州海陆交接地带发生一次MW7.4地震,震中位于15.9163°N,95.9533°W,震源深度20.0 km(图 1).此次地震造成10人死亡,20余人受伤(https://earthquake.usgs.gov/earthquakes/eventpage/us6000ah9t/impact).地震不久,美国地质调查局(USGS)和全球矩心矩张量组(GCMT)发布了这次地震的矩心矩张量解(表 1,图 1),USGS还发布了破裂过程的初步结果(https://earthquake.usgs.gov/earthquakes/eventpage/us6000ah9t/finite-fault),似乎表明这次地震的持续时间比较短.根据USGS发布的地震目录(https://earthquake.usgs.gov/earthquakes/search/),在主震发生后的48小时内发生了9次较大余震,最大一次震级达MW5.4,且有5次事件的震源深达35 km(图 1).
|
图 1 2020年墨西哥MW7.4地震主震、主震后2天内余震(M≥4.0)、构造环境以及1976年以来历史地震活动(Ekström et al., 2012) (a)主震(五角星)、构造环境与历史地震(沙滩球).红色方框表明图(b)的范围. (b)有限断层反演的初始模型(黑色方框,带齿边为上边)、较大余震(颜色填充的圆)以及主震的矩心(六边形)和震源机制解(沙滩球). Fig. 1 The 2020 MW7.4 Mexico earthquake, the large aftershocks (M≥ 4.0) in the first 2 days after the mainshock, the tectonic settings and historical seismicity since 1976 (Ekström et al., 2012) (a) The mainshock (star), the tectonic settings and the historical seismicity (beach-balls). The red frame indicates the area shown in subplot (b). (b) The initial model of the finite fault inversion (black frame, where the teeth indicate the upper side), the aftershocks (color-filled circles) and the centroid locations (hexgons) and focal mechanism solutions (beach-balls) of the mainshock. |
|
|
表 1 墨西哥MW7.4地震矩心矩张量解的比较 Table 1 Comparison of the centroid moment tensor solutions for the MW7.4 Mexico earthquake |
为了对此次破坏性地震的震源获得比较全面的认识,我们收集了震中距在30°~90°范围内全球地震台网(Global Seismograph Network, 缩写为:GSN)与国际数字地震台网联盟(International Federation of Digital Seismograph Networks, 缩写为:FDSN)记录的长周期和宽频带记录,利用我们自主研发的方法和软件反演分析了这次地震的矩心矩张量解、视震源时间函数以及时空破裂过程,揭示了这次地震震源的主要特征.
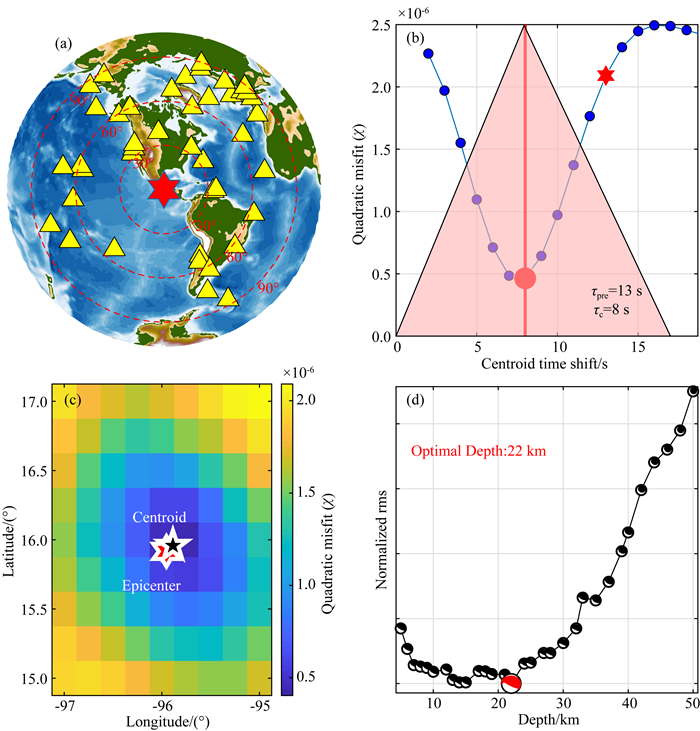
1 矩心矩张量反演类似于美国地质调查局(USGS)和全球矩心矩张量组(GCMT)的工作(Dziewonski et al., 1981; Kanamori and Rivera, 2008; Ekström et al., 2012; Duputel et al., 2012),我们从30°~90°震中距范围内GSN与FDSN的台站中按噪声水平、台站分布逐级筛选了42个台站的长周期垂直分量(LHZ)数据(图 2a),基于ak135模型(Kennett et al., 1995; Montagner and Kennett, 1996)、利用广义反透射系数法计算格林函数(Wang, 1999),采用我们自主研发的反演程序(张喆和许力生,2020a; 张喆等,2020b)对0.01~0.05 Hz频带内的位移数据进行反演,得到了这次地震的矩心矩张量解(表 1,图 2),并进一步计算得到了相应的最佳双力偶解(表 2).我们的反演程序可在时间域剔出仪器响应,避免了频率域可能由于奇异值造成的结果不稳定以及可能的面波限幅对体波的影响,反演可以采用速度记录,也可以采用位移记录,并可进行多种震相(如:W-震相、长周期面波和地幔波等)的联合反演.
|
图 2 矩心矩张量反演 (a)矩心矩张量反演所用台站(三角形);(b)矩心时间的搜索,红色六角星表示根据震级预估的半持续时间(τpre)、红色圆圈为网格搜索得到的矩心时间(τc);(c)矩心震中的搜索;(d)矩心深度的搜索. Fig. 2 Inversion of the centroid moment tensor (a) Stations used by the centroid moment tensor inversion (triangles); (b) Search for the centroid time; The red hexagram represents the half-duration time (τpre) estimated from the magnitude while the red circle is the centroid time (τc) obtained by the grid search; (c) Search for the centroid epicenter; (d) Search for the centroid depth. |
|
|
表 2 墨西哥MW7.4地震最佳双偶解比较 Table 2 Comparison of the best double-couple solutions for the MW7.4 Mexico earthquake |
根据反演结果,矩心时间为8 s (图 2b),矩心震中在95.89°W, 15.96°N(图 2c),矩心深度为22 km(图 2d),标量地震为1.24×10²⁰N·m,相当于MW7.4.为了检验反演结果的可靠性,我们利用反演结果计算了合成波形,并与观测波形进行了对比(图 3).大多数台站的相关系数都在0.90以上,二者的平均相关系数达到0.93,均方根误差为1.33×10⁻⁵m.

|
图 3 观测(OBS)波形与基于矩心矩张量解的合成(SYN)波形的比较 每幅子图左侧从上至下依次为台站名、震中距和方位角,右侧从上至下依次为相关系数和震相名.波形滤波频带为0.01~0.05 Hz.合成波形与观测波形的相关系数最大值、最小值、平均值以及中值分别为0.99、0.70、0.92和0.93. Fig. 3 Comparison of the observed waveforms (OBS) and the synthetics (SYN) predicted with the centroid moment tensor solution On the left side of each subplot are station code, epicentral distance and station-azimuth, respectively, and on the right side are the correlation coefficient and phase name, respectively. A frequency band of 0.01~0.05 Hz is used. The maximum, minimum, mean and median values of the correlation coefficients between the synthetic and observed waveforms are 0.99, 0.70, 0.92 and 0.93, respectively. |
与GCMT的结果相比,我们得到矩心位置在GCMT结果的东南方向~20 km,矩心深度非常接近,矩心时间几乎一致.与USGS的W-震相反演结果相比,矩心位置和矩心深度都非常接近,但矩心时间差别比较明显,二者相差5.2 s.与USGS的体波反演结果相比,我们得到的矩心位置略微偏南,但我们的矩心深度22 km,远远小于USGS的32 km.值得强调的是,尽管矩心位置和矩心时间具有或多或少的差异,但矩心矩张量解和最佳双力偶解彼此之间差别很小(表 1,表 2).
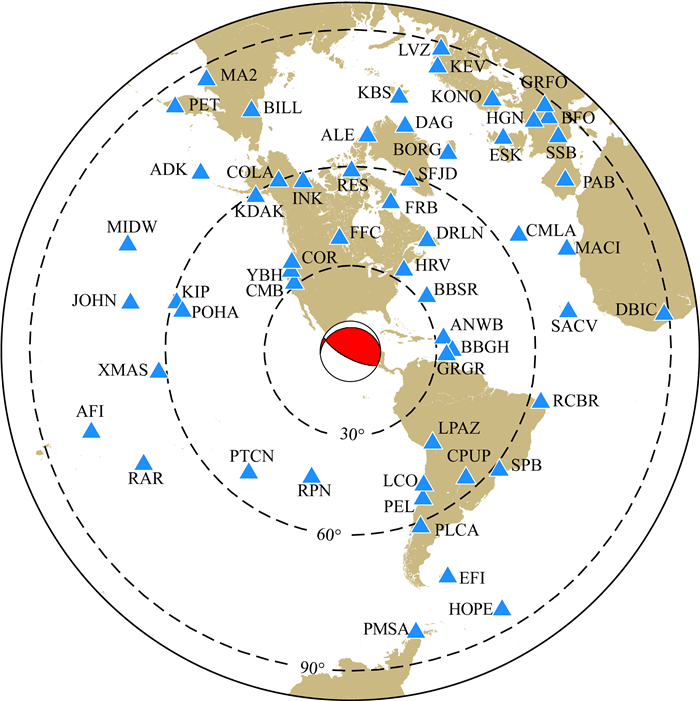
2 视震源时间函数分析视震源时间函数分析是认识地震破裂总体特征的重要途径之一(如, Ammon et al., 2006a, 2006b; Lay et al., 2009),因此,根据数据的信噪比水平、台间距和方位分布的均匀性,我们从GSN和FDSN台网选取了震中距在30°~90°范围内的57个宽频带地震台(图 4)的波形数据,基于本研究得到的矩心位置和震源机制解,采用ak135速度模型(Kennett et al., 1995; Montagner and Kennett, 1996)和反透射系数法(Wang, 1999)计算格林函数,并利用PLD(Projected Landweber Deconvolution,投影兰德维布反卷积)方法(Bertero et al., 1997; Lanza et al., 1999; 张勇等, 2009)在0.02~0.1 Hz频带范围内提取了这些台站的P波视震源时间函数.该方法在操作过程中便于添加因果约束和非负约束,且因在频率域和时间域之间交替进行而计算效率得到极大提升(Bertero et al., 1997; 许力生等,2014;张旭和许力生,2015;张旭等,2016).
|
图 4 主震震中(红色沙滩球)与用于震源时间函数提取和破裂过程反演的台站(蓝色三角形) Fig. 4 The mainshock epicenter (red beach-ball) and the stations (blue triangle) used in the retrieval of apparent source time functions (ASTFs) and the inversion of rupture process |
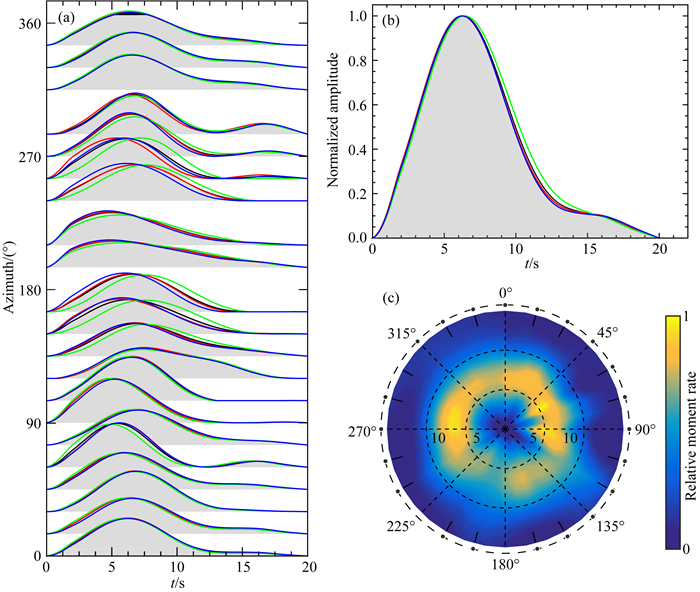
为了尽量减小个别视震源时间函数对于总体破裂特征分析的影响,我们将360°范围以等间隔分割成24个区间,为每个区间计算了平均视震源时间函数(图 5a).如此一来,这些分段平均的视震源时间函数可以几乎均匀地覆盖所有方位.为了对视震源时间函数和破裂方向的总体特征有所了解,我们计算了视震源时间函数的总平均(图 5b),并把依赖于方位的震源时间函数“面积归一化”之后投射到极坐标框架下(图 5c).总平均视震源时间函数表明这次地震的总持续时间不超过20 s,大约在14 s左右大部分能量已被释放.极坐标框架下的视震源时间函数展示了两个“相对高光”的方位,一个在60°左右,另一个在270°左右,这表明了这次地震的两个破裂优势方向.
|
图 5 视震源时间函数及其分析 (a)依赖于方位的视震源时间函数;(b)振幅归一化的平均视震源时间函数;(c)面积归一化的视震源时间函数在极坐标中的分析.这里径向和切向分别表示时间和方位.注意:子图(a)和(b)中红线、绿线和蓝线分别表示基于本研究所得震源机制解、GCMT震源机制解以及USGS体波震源机制解提取的视震源时间函数,灰色区域展示平均视震源时间函数. Fig. 5 The ASTFs and its analysis (a) The azimuth-dependent ASTFs; (b) The amplitude-normalized average ASTF; (c) The area-normalized azimuth-dependent ASTFs projected onto the polar coordinate frame, where radial and tangential directions are time and azimuth, respectively. Note: in subplots (a) and (b), the red, green, and blue lines indicate the ASTFs retrieved with the focal mechanisms from this study, GCMT solution, and USGS body wave solution, respectively. The gray-shaded areas indicate the ASTFs averaged over the three results. |
需要说明的是,为了了解计算格林函数时采用的震源机制的不确定性对视震源事件函数的形状的影响,我们还基于GCMT震源机制解和USGS体波震源机制解提取了视震源时间函数,并经相同的处理过程后展示于图 5,由此可见震源机制的差别对视震源时间函数并没有实质性影响.
为了检验视震源时间函数的可靠性,基于提取到的视震源时间函数我们计算了合成波形,并与观测波形进行了对比(图 6),可以看出合成波形可以很好地解释观测波形,平均相关系数达到0.96.

|
图 6 观测波形与基于视震源时间函数的合成波形的比较(参见图 3) 波形滤波频带为0.02~0.10 Hz.合成波形与观测波形的相关系数最大值、最小值、平均值以及中值分别为0.99、0.87、0.96和0.98. Fig. 6 Comparison of the observed waveforms (OBS) and the synthetics (SYN) calculated with the retrieved ASTFs (also see Fig. 3) A frequency band of 0.02~0.10 Hz is used. The maximum, minimum, mean and median values of the correlation coefficients between the synthetic and observed waveforms are 0.99, 0.87, 0.96, and 0.98, respectively. |
一个地震的矩心矩张量揭示了地震能量释放的时空“焦点”、能量释放方式以及能量释放的“粗略”持续时间,视震源时间函数则展示地震能量随时间的变化和破裂传播的“粗略”优势方向,而有限断层的时空破裂过程则反映地震断层破裂传播和滑动强弱的时空“细节”.为此,在矩心矩张量反演和视震源时间函数分析的基础上,我们还从那57个宽频带台(图 4)的P波波形中反演了时空破裂过程.不同于视震源时间函数的提取,时空破裂过程的反演采用了0.02~0.2 Hz的频率范围.计算格林函数时采用的速度模型和方法与上面完全相同(Kennett et al., 1995; Montagner and Kennett, 1996; Wang, 1999).
需要说明的是,震源破裂过程的远场波形反演通常采用P波、S波和面波,但不同类型的波形在反演中发挥的作用不同.P波周期短,振幅相对较小,面波周期大,振幅相对较大.周期短意味着分辨能力强,但反演结果对数据比较敏感;周期长意味着分辨能力弱,但反演结果对数据比较迟钝,即所谓“稳健”.振幅小意味着对反演结果贡献小,振幅大意味着对反演结果的贡献大,因此,在平权联合反演时,振幅较小的数据发挥的作用较小,振幅较大的数据发挥的作用较大.所以,如何使用数据需要根据具体问题或具体目的.2020年墨西哥MW7.4地震属于一般性大地震,USGS初步结果表明破裂面积不大,破裂过程似乎相对简单,因此,使用周期较短的P波数据才有可能揭示其破裂复杂性.况且,如图 4所示,具有高信噪比波形数据足够多,台站分布也足够好,因此无需融合其他更长周期的波形数据.
时空破裂过程反演所需的初始模型是根据本研究所得矩心矩张量解和余震空间展布建立的.如图 1b所示,沿走向266°拓展70 km,沿倾向22°拓展60 km,并将其离散为5 km × 5 km的子断层.
时空破裂过程反演时采用的方法仍然是多年来我们自主研发的方法(Zhang et al., 2012).这种方法无需预先设定子断层震源时间函数形状,同时允许子断层的滑动方向在总体的滑动方向附近(±45°)发生变化.反过来,每个子断层的震源时间函数成为反演的直接产物.不过,为了提高反演结果的稳定性,通常需要通过试算的方式设定最大破裂速度和子断层最大上升时间.另外,通常需要时间域和空间域的光滑约束(Yagi et al., 2004; Zhang et al., 2012)以及标量地震矩最小约束(Hartzell and Heaton, 1983; Antolik and Dreger, 2003; Zhang et al., 2012).时间域光滑约束用于抑制子断层震源时间函数的过高频率,空间域光滑约束用于消除相邻子断层间位错的不连续性,而标量地震矩最小约束则用于消除过低频率的滑动成分.另外,考虑到已有的理论和观测研究表明,绝大部分地震的破裂速度是震源处S波速度的0.85倍左右,少量地震的破裂速度大于S波速度,但不超过P波速度(Lay and Wallace, 1995),由于远场波形反演结果对破裂速度并不敏感,因此反演采用的最大破裂速度值通常根据经验,在瑞利波速度和P波速度之间进行尝试设定.在本反演中,经过尝试设定的最大破裂速度为3.0 km·s-1,与此相对应的子断层最大上升时间为8 s.的确,不同的破裂速度会导致滑动范围的些许差异,但一个在S波速周围变化的破裂速度通常不会改变主要破裂特征(如, Lay et al., 2010; Gusman et al., 2015).
图 7展示了时空破裂过程的反演结果.震源时间函数(图 7a)表明,此次地震持续时间不超过20 s,释放总标量地震矩1.6×10²⁰ N·m,相当于矩震级MW7.4,然而在前14 s释放了90%的标量地震矩.同震滑动分布(图 7b)清楚地表明,此次地震主要包含一个凹凸体,走向和倾向方向的尺度相当,均为30~35 km左右,但在滑动方向尺度较大.整个凹凸体总体斜向上错动,最大滑动量高达8.1 m,基于滑动分布结果估计的矩心深度为21.7 km,和矩心矩张量反演的结果非常接近.滑动速率时空变化快照(图 7c)显示,破裂在空间上呈现沿着滑动方向的对称扩展.破裂开始向四周传播,大约在7 s左右,向深部的扩展减弱,浅部较强,随后在滑动方向的双侧破裂占主导地位,但在滑动方向较深的一侧滑动率更大.这样的破裂扩展方式与视震源时间函数揭示的破裂优势方向非常吻合(图 5c).

|
图 7 主震破裂过程反演结果 (a)地震矩率函数;(b)同震滑动分布;(c)滑动速率快照. Fig. 7 The inverted results of the mainshock rupture process (a) Moment rate function; (b) Coseismic slip pattern; (c) Snapshots of the slip rate. |
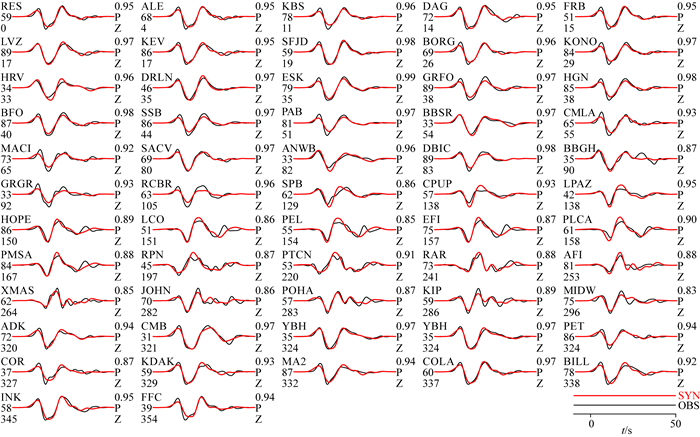
为了评价反演结果对观测数据的解释程度,我们利用反演结果计算了相应的合成数据,并与观测数据进行了对比(图 8).可以看出,观测数据的到时和振幅均可得到较好的拟合,平均相关系数为0.93.
|
图 8 观测波形与基于反演所得破裂过程的合成波形的比较(参看图 3) 波形滤波频带为0.02~0.20 Hz.合成波形与观测波形的相关系数最大值、最小值、平均值以及中值分别为0.99、0.83、0.93和0.95. Fig. 8 Comparison of the observed waveforms and the synthetics calculated with the inverted rupture process (also see Fig. 3) A frequency band of 0.02~0.20 Hz is used. The maximum, minimum, mean and median values of the correlation coefficients between the synthetic and observed waveforms are 0.99, 0.83, 0.93, and 0.95, respectively. |
地震事件的震源机制解是震源破裂过程反演的基础,为了对基于长周期波形资料反演得到的断层参数的不确定性有所了解,我们也利用与求解视震源时间函数和时空破裂过程相同的宽频带数据反演了这次地震的矩心矩张量解(表 3),并求解了最佳双力偶解得到了相应的断层面参数(表 4).反演过程在三个频段进行,从不同频段得到的结果并不相同,彼此之间的差异客观上展示了反演结果的不确定性.不同的结果对观测资料的解释程度也不同(表 5),从观测波形和合成波形的总体相关系数(Entire)、不同台站波形相关系数的平均值(Average)、中间值(Median)、最大值(Maximum)和最小值(Minimum)可以看出,随着频率的升高,观测波形和合成波形的相关度逐渐下降.我们知道,一个地震的单点震源机制解是对整体事件断层运动方式的近似,反映地震大小的标量地震矩是震源谱的零频极限,因此从相对低频的波形数据得到的结果更可取.对比基于低频段(0.01~0.05 Hz)反演得到的两个结果(表 2,表 4)以及观测波形与合成波形的相关度参数(图 3,表 5),我们仍然有理由采用基于长周期波形资料的反演结果.
|
|
表 3 墨西哥MW7.4地震矩心矩张量解宽频带波形反演结果比较 Table 3 Comparison of the centroid moment tensor solutions for the MW7.4 Mexico earthquake from the broadband waveform inversion |
|
|
表 4 墨西哥MW7.4地震最佳双偶解宽频带波形反演结果比较 Table 4 Comparison of the best double-couple solutions for the MW7.4 Mexico earthquake from the broadband waveform inversion |
|
|
表 5 宽频带波形反演的观测波形和合成波形相关系数参数对比 Table 5 Comparison of the parameters of the correlation coefficients between the observed broadband waveform data and the corresponding synthetic data |
2020年6月23日墨西哥南部瓦哈卡州发生的MW7.4地震,虽然震中位于大陆一侧,但实际上是一次北美大陆板块和太平洋板块相互作用的结果.根据美国地质调查局测定的震源深度,起始破裂点位于20 km深处,而美国地质调查局、gCMT组以及本研究通过波形反演确定的矩心深度在20~32 km之间,而本研究通过矩心矩张量反演确定的22 km和有限断层反演确定的21.7 km,与gCMT组和美国地质调查局利用W震相反演确定的结果都比较一致(表 1),因此20 km左右的矩心深度更可取.虽然,不同的研究机构利用不同的资料确定的矩心震中位置不同,但彼此之间差别很小,因此,本研究反演得到的矩心位置15.96°N, 95.89°W可视为这次地震的矩心震中.
这次地震虽然震级高达MW7.4,但持续时间较短.除美国地质调查局基于W震相确定的矩心时间为13.2 s(持续时间约26.4 s左右)外,根据gCMT组和本研究基于长周期波形资料确定的矩心时间(图 2),以及本研究基于宽频带波形资料提取的视震源时间函数的持续时间(图 5)和基于宽频带波形资料的时空破裂过程反演确定的震源时间函数的持续时间(图 7),这次地震的持续时间均在15 s左右.
根据当地的历史地震活动,发生在这个海陆碰撞带的地震的震源机制以逆冲断层为主,也伴有一定量的正断层(图 1).根据美国地质调查局、gCMT组以及本研究的结果,2020年6月23日发生的这次MW7.4地震以逆冲为主,但左旋滑动分量也不可忽视,因此是一次海底板块向大陆板块的斜插事件.
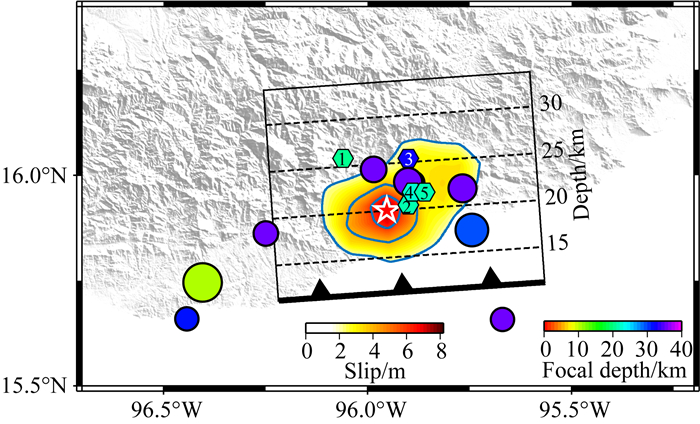
根据本研究视震源时间函数的分析(图 5),这次地震破裂具有强弱不同的两个优势方向,一个方位在60°左右,另一个在270°左右.另据有限断层的时空破裂过程反演结果(图 7),破裂在滑动方向呈现双侧传播,这两个方向在地表的投影与视震源时间函数揭示的方向非常吻合,因此这次地震是一次在滑动方向的双侧破裂.根据有限断层反演结果,这次地震的滑动分布并不复杂,仅涉及到一个凹凸体的破裂和错动,滑动最大点几乎是破裂起始点,最大滑动量达8.1 m.凹凸体在走向和倾向方向的破裂尺度相当,但在滑动方向较大.与USGS的反演结果相比,地震持续时间和最大滑动量均较为相似,但USGS反演所得的滑动呈现近乎圆盘形分布,这可能是由于采用了更长周期的数据或者过度的空间光滑而造成的.这次地震滑动的深度范围在15~26 km之间,但根据美国地质调查局测定,在深达35 km的深度还有较大余震发生(图 9).我们注意到,主震破裂区域仅仅占余震分布范围的小部分(图 9),似乎还存在较大的未破裂的区域.出现这种现象有两种可能,一是已经有很多余震发生,但我们能够得到和展示的只是较大的余震;二是在那些较大余震和主震之间存在地震“障碍体”,这需要更详细的观测和分析.
|
图 9 反演所得的滑动分布在地表的投影以及矩心和主震后2天以内的余震(M≥4.0)的分布 黑色的虚线表示断层面的深度,带数字的六边形代表矩心位置:1—gCMT;2—USGS(W);3—USGS(B);4—来自本研究矩心矩张量;5—来自有限断层反演(参看图 1、图 7和表 1). Fig. 9 Map view of the inverted slip distribution projected onto the ground surface and the distributions of the centroid and large aftershocks (M≥4.0) in the first 2 days after the mainshock The discontinued lines indicate the depths, and the numbered hexagons show the centroid locations: 1—gCMT, 2—USGS(W), 3—USGS(B), 4—centroid moment tensor inversion in this study, 5—finite fault inversion in this study (also see Fig. 1, Fig. 7 and Table 1). |
墨西哥南部大陆海岸线总体是北西—东南方向,但2020年6月23日墨西哥南部瓦哈卡州MW7.4地震却发生在一段海湾的转折点(图 1).沿此海陆碰撞带已经有大量中强地震发生,且以浅倾角逆冲事件为主,这说明海洋板块以浅倾角向大陆板块俯冲.纵观碰撞带中强地震的分布,如图 1所示,在2020年6月23日墨西哥南部瓦哈卡州MW7.4地震及其东南的大部分湾区的地震较少,说明在历史上这一地段的应力释放相对较少,这次浅倾角地震的发生似乎表明湾区的应力积累已开始释放,板块已开始进一步活动.
根据以上分析,2020年6月23日发生在墨西哥南部瓦哈卡州的MW7.4地震的矩心震中位于15.96°N,95.89°W,矩心深度约22 km,持续时间15 s左右,释放地震矩1.24×10²⁰N·m,相当于矩震级MW7.4.破裂过程相对简单,仅有一个凹凸体错动,最大位错达8.1 m,位于21 km深处.凹凸体破裂主要沿断层的滑动方向双侧扩展,导致约60°和270°的两个优势破裂方位.这次地震是北美大陆板块和太平洋海底板块相互作用的结果.海底板块朝着大约60°左右的方位运动,以大约22°的倾角插入大陆板块,造成一个凹凸体错动,形成了这次地震.
Ammon C J, Kanamori H, Lay T, et al. 2006a. The 17 July 2006 Java tsunami earthquake. Geophysical Research Letters, 33(24): 194-199. DOI:10.1029/2006GL028005 |
Ammon C J, Velasco A A, Lay T. 2006b. Rapid estimation of first-order rupture characteristics for large earthquakes using surface waves:2004 Sumatra-Andaman earthquake. Geophysical Research Letters, 33(14): L14314. DOI:10.1029/2006GL026303 |
Antolik M, Dreger D S. 2003. Rupture process of the 26 January 2001 MW7.6 Bhuj, India, earthquake from teleseismic broadband data. Bulletin of the Seismological Society of America, 93(3): 1235-1248. DOI:10.1785/0120020142 |
Bertero M, Bindi D, Boccacci P, et al. 1997. Application of the projected Landweber method to the estimation of the source time function in seismology. Inverse Problems, 13(2): 465-486. DOI:10.1088/0266-5611/13/2/017 |
Duputel Z, Rivera L, Kanamori H, et al. 2012. W phase source inversion for moderate to large earthquakes (1990-2010). Geophysical Journal International, 189(2): 1125-1147. DOI:10.1111/j.1365-246X.2012.05419.x |
Dziewonski A M, Chou T A, Woodhouse J H. 1981. Determination of earthquake source parameters from waveform data for studies of global and regional seismicity. Journal of Geophysical Research:Solid Earth, 86(B4): 2825-2852. DOI:10.1029/JB086iB04p02825 |
Ekström G, Nettles M, Dziewoński A M. 2012. The global CMT project 2004-2010:Centroid-moment tensors for 13, 017 earthquakes. Physics of the Earth and Planetary Interiors, 200-201: 1-9. DOI:10.1016/j.pepi.2012.04.002 |
Gusman A R, Murotani S, Satake K, et al. 2015. Fault slip distribution of the 2014 Iquique, Chile, earthquake estimated from ocean-wide tsunami waveforms and GPS data. Geophysical Research Letters, 42(4): 1053-1060. DOI:10.1002/2014GL062604 |
Hartzell S H, Heaton T H. 1983. Inversion of strong ground motion and teleseismic waveform data for the fault rupture history of the 1979 Imperial Valley, California, earthquake. Bulletin of the Seismological Society of America, 73(6A): 1553-1583. |
Kanamori H, Rivera L. 2008. Source inversion of W phase:speeding up seismic tsunami warning. Geophysical Journal International, 175(1): 222-238. DOI:10.1111/j.1365-246X.2008.03887.x |
Kennett B L N, Engdahl E R, Buland R. 1995. Constraints on seismic velocities in the Earth from traveltimes. Geophysical Journal International, 122(1): 108-124. DOI:10.1111/j.1365-246X.1995.tb03540.x |
Lanza V, Spallarossa D, Cattaneo M, et al. 1999. Source parameters of small events using constrained deconvolution with empirical Green's functions. Geophysical Journal International, 137(3): 651-662. DOI:10.1046/j.1365-246x.1999.00809.x |
Lay T, Wallace T. 1995. Modern Global Seismology. San Diego, California: Academic Press: 1-521.
|
Lay T, Kanamori H, Ammon C J, et al. 2009. The 2006-2007 Kuril Islands great earthquake sequence. Journal of Geophysical Research:Solid Earth, 114(B11): B11308. DOI:10.1029/2008JB006280 |
Lay T, Ammon C J, Hutko A R, et al. 2010. Effects of kinematic constraints on teleseismic finite-source rupture inversions:great peruvian earthquakes of 23 June 2001 and 15 August 2007. Bulletin of the Seismological Society of America, 100(3): 969-994. DOI:10.1785/0120090274 |
Montagner J P, Kennett B L N. 1996. How to reconcile body-wave and normal-mode reference earth models. Geophysical Journal International, 125(1): 229-248. DOI:10.1111/j.1365-246X.1996.tb06548.x |
Wang R J. 1999. A simple orthonormalization method for stable and efficient computation of Green's functions. Bulletin of the Seismological Society of America, 89(3): 733-741. |
Xu L S, Zhang X, Yan C, et al. 2014. Analysis of the Love waves for the source complexity of the Ludian MS6.5 earthquake. Chinese Journal of Geophysics (in Chinese), 57(9): 3006-3017. DOI:10.6038/cjg20140925 |
Yagi Y, Mikumo T, Pacheco J, et al. 2004. Source rupture process of the Tecomán, Colima, Mexico earthquake of 22 January 2003, determined by joint inversion of teleseismic body-wave and near-source data. Bulletin of the Seismological Society of America, 94(5): 1795-1807. DOI:10.1785/012003095 |
Zhang X, Xu L S. 2015. Inversion of the apparent source time functions for the rupture process of the Nepal MS8.1 earthquake.. Chinese Journal of Geophysics (in Chinese), 58(6): 1881-1890. DOI:10.6038/cjg20150604 |
Zhang X, Yan C, Xu L S. 2016. Analysis of the Love-waves for the rupture processes of the 2014 earthquake-doublet of Kangding, Sichuan. Chinese Journal of Geophysics (in Chinese), 59(7): 2453-2467. DOI:10.6038/cjg20160712 |
Zhang Y, Xu L S, Chen Y T. 2009. PLD method for retrieving apparent source time function and its application to the 2005 Kashmir MW7.6 earthquake. Chinese Journal of Geophysics (in Chinese), 52(3): 672-680. DOI:10.1002/cjg2.1389 |
Zhang Y, Feng W P, Chen Y T, et al. 2012. The 2009 L'Aquila MW6.3 earthquake:a new technique to locate the hypocentre in the joint inversion of earthquake rupture process. Geophysical Journal International, 191(3): 1417-1426. |
Zhang Z, Xu L S. 2020a. 2013 MW7.8 South Scotia Ridge earthquake:Focal mechanism inversion of the multi-point sources. Chinese Journal of Geophysics (in Chinese), 63(8): 2978-2998. DOI:10.6038/cjg2020O0017 |
Zhang Z, Liang H, Xu L S. 2020b. The centroid moment tensor solution of the 23 June 2020 MW7.4 Mexico earthquake. Acta Seismologica Sinica (in Chinese), 42(4): 1-5. |
许力生, 张旭, 严川, 等. 2014. 基于勒夫波的鲁甸MS6.5地震震源复杂性分析. 地球物理学报, 57(9): 3006-3017. DOI:10.6038/cjg20140925 |
张旭, 许力生. 2015. 利用视震源时间函数反演尼泊尔MS8.1地震破裂过程. 地球物理学报, 58(6): 1881-1890. DOI:10.6038/cjg20150604 |
张旭, 严川, 许力生. 2016. 2014年四川康定双震震源的勒夫波分析. 地球物理学报, 59(7): 2453-2467. DOI:10.6038/cjg20160712 |
张勇, 许力生, 陈运泰. 2009. 提取视震源时间函数的PLD方法及其对2005年克什米尔MW7.6地震的应用. 地球物理学报, 52(3): 672-680. |
张喆, 许力生. 2020a. 2013年南斯科舍海岭MW7.8地震的多点震源机制反演. 地球物理学报, 63(8): 2978-2998. DOI:10.6038/cjg2020O0017 |
张喆, 梁皓, 许力生. 2020b. 2020年6月23日墨西哥MW7.4地震矩心矩张量解. 地震学报, 42(4): 1-5. |
 2020, Vol. 63

