 2020, Vol. 63


2. 中国科学院大学, 北京 100049;
3. 天基空间环境探测北京市重点实验室, 北京 100190
2. University of Chinese Academy of Sciences, Beijing 100149, China;
3. Beijing Key Laboratory of Space Environment Exploration, Beijing 100190, China
地球磁场包括基本磁场和变化磁场两个部分.基本磁场是地磁场的主要部分,起源于固体地球内部,即内源场,比较稳定.变化磁场起源于地球磁层空间主要的电流体系(Wolf, 1995),因此也称为外源场.对外源场起主要贡献作用的电流系统,包括磁层顶电流、对称环电流、部分环电流、越尾电流以及场向电流(Yang et al., 2018).受太阳活动和行星际扰动的影响,这些磁层电流系统在不同时间尺度呈现出不同强度的扰动变化,地磁外源场随之不断扰动变化(Li et al., 2008, 2011, 2013, 2016, 2017; Yu et al., 2015, 2016).
目前,磁层粒子辐射的演化和地磁场扰动等重要科学问题的研究都依赖于地磁场模型.因此,地磁场模型能够在多大程度上描述真实的磁层磁场状态至关重要.从1975年Mead和Fairfield的开创性工作开始(Mead and Fairfield, 1975),在过去40多年里,全球已经开发了多个基于观测数据的地磁场经验模型,例如Tsyganenko及其团队发展的T82、T87、T89、T96、T02、TSK03、TS05(Tsyganenko and Usmanov, 1982, Tsyganenko, 1987, 1989, 1995, 1996, 2002a, 2002b, Tsyganenko et al., 2003, Tsyganenko and Sitnov, 2005)等.这些模型广泛应用于磁层各研究领域.
过去已有一些关于地磁场模型的比较研究(Peredo et al., 1993, Pulkkinen and Tsyganenko, 1996, Reeves et al., 1996, Spence et al., 1987, Stern, 1994, Thomsen et al., 1996, Walker, 1976),但是不包含最近十几年新发展的模型,而且主要关注的是地球同步轨道区域.例如,Huang等(Huang et al., 2008)定量评估了磁暴期间磁场经验模型T96、T02和TS05在地球同步轨道高度的性能,结果表明TS05模型能够很好地描述暴时内磁层磁场位型.McCollough等(McCollough et al., 2008)利用GOES卫星观测数据对the Office National d′Etudes et de Recherche Ae′rospatiales-De′partement Environnement Spatial (ONERA-DESP) libraries中常用外磁场经验模型进行了统计比较研究,结果表明在地球同步轨道高度,较新的模型性能表现更好(文章中最新的外磁场模型为TSK03),且在不同太阳活动周期、地磁活动水平和磁地方时呈现不同的变化.
本文利用VAP(2012—2018)和GOES15(2011—2017)的磁场观测数据,以国际地磁参考场(International Geomagnetic Reference Field,IGRF)为内源场,对比研究TS05、TA15、TA16三个较新的外磁场经验模型在外辐射带区域(3~6.6RE)内的性能表现.本研究成果将为磁层粒子动态演化机制、我国卫星(如风云系列卫星、北斗系列卫星)高能粒子探测数据在轨交叉定标,以及其他相关理论和应用研究提供磁场模型选择方面的支持.
1 磁场模型和数据 1.1 磁场模型本文对三个外磁场经验模型——TS05模型(Tsyganenko and Sitnov, 2005),TA15模型(Tsyganenko and Andreeva, 2015)和TA16模型(Tsyganenko and Andreeva, 2016)的性能进行定量分析研究,三个模型的场源、数据源、输入参数及限制由表 1给出.
|
|
表 1 TS05、TA15和TA16模型的比较 Table 1 The comparision of TS05, TA15 and TA16 |
 ,代表当下时刻前后15 min平均值,φ代表地磁轴倾角(rad),W1—W6以及B是太阳风-磁层耦合参数(
TS05模型是一个暴时外磁场经验模型.该模型采用简单的增长和衰减模型描述每个主要电流体系,假设每个电流体系都有其独立的弛豫时间尺度和宁静时本底强度,由观测数据分别推导出整个磁暴周期中各电流系统的时序变化.在这种方法中,各电流体系对磁场的贡献取决于整个磁暴期间磁层外部驱动的积分效应.
TA15模型是一个较新的磁层磁场经验模型,其与TS05模型类似,采用传统的模块化方法建模,但输入参数使用了太阳风参数和行星际磁场前半小时平均值,以保留太阳风和行星际磁场前半小时所包含的信息,并将空间范围扩展到了约60RE处.
TA16模型采用了新的径向基函数(Radial Basis Functions,RBF)建模方法,不考虑关于电流源几何位型的特殊假设,仅依靠航天器观测数据进行建模.该方法关键在于对整个建模空间进行网格划分,将外源场产生的磁场分解为环向和极向部分,并将相应的生成函数扩展为径向基函数的线性组合.这种方法为基于模块化原理的经验模型提供了一种可行且灵活得多的替代方法(Andreeva and Tsyganenko, 2016, Tsyganenko, 2013),并可以解决所观察到的磁场结构的精细细节,而传统模型几乎无法检测到.
1.2 数据磁场经验模型需要的太阳风参数及行星际磁场数据来自OMNI/OMNI2数据库(https://omniweb.gsfc.nasa.gov/).模型输入参数取决于所使用的磁场模型,通常包括地磁指数(Kp、Dst指数等)、太阳风参数(流速、动压、密度等)和行星际磁场分量、以及由观测数据推导得到的太阳风-磁层耦合参数(Tsyganenko and Sitnov, 2005, Tsyganenko and Andreeva, 2015, 2016).
VAP(2012—2018)和GOES-15(2011—2017)磁场观测数据和轨道数据来自戈达德航天飞行中心空间物理数据库(https://cdaweb.sci.gsfc.nasa.gov/).VAP于2012年8月30日发射,两艘飞船在几乎相同的椭圆轨道上飞行,覆盖整个辐射带区域(约1~6RE).VAP轨道的远地点高度约为30000 km,近地点高度约为500 km,轨道倾角为10°,轨道周期为9 h(Kletzing et al., 2013).GOES-15卫星是第4代美国地球静止轨道应用卫星,于2010年3月4日发射,定点于西经135°,轨道高度36000 km.
外磁场经验模型输出的是外磁场分量,为方便与观测磁场数据进行比较分析,本工作采用IGRF计算内源场,与各外源场模型输出结果叠加,得到模型的输出总磁场.本工作中,磁场及航天器位置坐标统一采用地心太阳磁层坐标系(Geocentric Solar Wind coordinate system, GSM).
2 评估方法
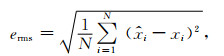
本文选择预测效率(Prediction Efficiency, PE)(Vassiliadis, 2007)作为模型评估的定量指标,其计算方法如公式(1)、(2)所示, 

|
(1) |
|
(2) |

|
(3) |
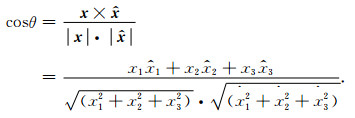
本文还计算了磁场观测数据和模型数据之间的夹角θ,以评估模型对磁场方向的描述能力,如公式(4),x代表观测磁场向量(x1、x2、x3为三个分量),

|
(4) |
图 1是3~6.5RE范围内各模型计算值与VAP观测数据比较结果,图 1(a、b)分别是PE和θ随Lm变化情况.由图 1a可以发现在3~4RE内PE基本接近1,主要是因为此范围内源场起主要作用,磁场较为稳定;5~6.5RE,PE随Lm值增大下降较为明显,这说明随着Lm值增大,磁层电流系统对地磁场的贡献逐渐增大.三个模型预测效率随Lm值变化趋势基本一致,相较而言TA16模型磁场与VAP观测磁场数据最为接近.由图 1b可以发现约3~5.7RE内,θ随着Lm值的增大而增大,三个模型θ值变化趋势基本一致;5.7~6.5RE内,θ值变化逐渐趋于平缓, 整体而言三个模型磁场数据与VAP观测磁场数据方向偏差在4°以内.

|
图 1 3~6.5RE范围内各模型计算值与VAP观测值比较结果. (a)PE随Lm变化;(b) θ随Lm变化 Fig. 1 The comparison between magnetic field model estimations and observations from VAP in the range of 3~6.5RE. (a) PE versus Lm; (b) θ versus Lm. The blue lines indicate TS05, the red lines indicate TA15, the orange lines indicate TA16 |
表 2是地球同步轨道高度各模型计算值与GOES-15观测数据比较结果.由表 2可以发现TS05模型的PE、CC在三个模型中最高,而θ最小,表明TS05模型与GOES15卫星磁场观测数据最为接近.
|
|
表 2 地球同步轨道高度各模型计算值与GOES-15观测数据比较结果 Table 2 the comparison between magnetic field model estimations and observations from GOES15 at geosynchronous orbit |
太阳和行星际环境的扰动会导致磁层电流系统剧烈变化,地磁外源场随之变化.本文以Kp指数作为地磁扰动水平指标,评估各模型在不同地磁扰动水平下的性能表现.Kp指数是13个地磁台站测量的3 h地磁场水平分量峰值变化平均值,其值范围在0~9之间,表征全球磁场变化.Dst指数是表征地磁活动水平的另一个常用指标,该指数主要与赤道环电流相关.因此,本文选择Kp指数表征地磁活动水平.
图 2是3~6.5RE范围内各模型计算值和VAP观测数据在不同地磁活动水平下PE比较结果,(a)—(c)图分别代表Kp∈[0, 1]、Kp=3、Kp=5.由图 2a可见,磁宁静时期,3~6RE范围内TS05模型PE略低于另外两个模型,这可能是因为TS05模型仅采用暴时观测数据作为建模数据,而另外两个模型的建模数据包括宁静期和磁暴期观测数据.由图 2b可见3~6RE内TA15模型的PE低于另外两个模型,这可能是TA15模型数据源中内磁层区域的数据量占比较少,对于磁扰时期环电流的建模还不够准确.Kp=5时,随着地磁扰动的增强,三个模型的PE随Lm值变化差异逐渐显著,PE随Lm值的下降速率相较于磁宁静时期更快,这主要是因为磁扰时期磁层电流系统变化剧烈,导致外磁场随之剧烈变化.在地磁扰动时期,TA16模型数据与VAP观测磁场数据最为接近.

|
图 2 3~6.5RE范围内各模型计算值和VAP观测数据在不同地磁活动水平下PE比较结果. (a)—(c)分别表示Kp∈[0, 1]、Kp=3和Kp=5 Fig. 2 The comparison of PE between magnetic field model estimations and observations from VAP under different geomagnetic disturbed levels in the range 3~6.5RE. (a)—(c) represent respectively Kp∈[0, 1], Kp=3 and Kp=5. The blue lines indicate TS05, the red lines indicate TA15, the orange lines indicate TA16 |
图 3是3~6.5RE范围内各模型计算值和VAP观测数据在不同地磁活动水平下θ比较结果,(a)—(c)图分别代表Kp∈[0, 1]、Kp=3、Kp=5.可以发现随着地磁扰动增强,相同Lm值情况下θ值在不断增大,表明模型方向预测偏差随着地磁扰动增强而增大,相较而言地磁扰动时期TA16模型与VAP观测磁场数据方向偏差最小.

|
图 3 3~6.5RE范围内各模型计算值和VAP观测数据在不同地磁活动水平下θ比较结果. (a)—(c)分别表示Kp∈[0, 1],Kp=3和Kp=5 Fig. 3 The comparison of θ between magnetic field model estimations and observations from VAP under different geomagnetic disturbed levels in the range 3~6.5RE. (a)—(c) represent respectively Kp∈[0, 1], Kp=3 and Kp=5. The blue lines indicate TS05, the red lines indicate TA15, the orange lines indicate TA16 |
图 4是地球同步轨道高度各模型计算值和GOES-15观测数据在不同地磁活动水平下的比较结果,图 4(a、b)分别是PE和θ随Kp变化情况.可以发现,Kp值在1~6内,各模型PE随Kp增大而下降,θ随Kp增大而增大,说明随着磁扰增强,三个模型与GOES-15卫星磁场观测数据偏差逐步增大.相较而言,TS05模型与GOES15卫星观测数据最为接近.

|
图 4 地球同步轨道高度各模型计算值和GOES-15在不同地磁活动水平下的比较结果. (a) PE随Kp变化;(b) θ随Kp变化 Fig. 4 The comparison between magnetic field model estimations and observations from GOES-15 under different geomagnetic disturbed levels at geosynchronous orbit. (a) PE versus Kp; (b) θ versus Kp. The blue lines indicate TS05, the red lines indicate TA15, the orange lines indicate TA16 |
磁层中各电流体系对外磁场的贡献随时间象限不同而各有差异,比如磁尾电流主要对夜侧磁场影响较大,磁层顶电流主要对日侧电流影响较大,部分环电流和场向电流对晨昏侧的磁场影响较大,因此也需要评估各模型在不同磁地方时(Magnetic Local Time,MLT)下的性能表现.
图 5是3~6.5RE范围内各模型计算值和VAP观测数据在不同MLT下PE比较结果,(a)—(d)图分别代表Lm值范围为3~4、4~5、5~6、6~6.5RE.由图 5a可以发现3~4RE时PE基本接近于1,说明此空间范围内主要是内源场,比较稳定.由图 5c和5d可以发现在5~6.5RE内,PE在MLT=12-21时的值小于MLT=0-9时的值,表现出晨昏不对称性.磁尾电流主要对夜侧的磁场产生贡献,部分环电流和场向电流主要影响晨、昏附近的外源磁场,TA15和TS05均采用分模块对不同磁层电流体系建模的方式,图 5的结果表明,TA15对黄昏附近磁层电流的描述更加接近实际情况.在外辐射带3~6.5RE内TA16模型的表现无明显的地方时变化,且在各时间象限上优于或大致相当于其余两个模型.这表明尽管TA16舍弃了之前对各电流体系分别模块化建模的方式,但对各主要电流体系对磁场贡献的结果有较好的描述.

|
图 5 3~6.5RE范围内各模型计算值和VAP观测数据在不同MLT下PE比较结果. (a)—(d)分别代表Lm值范围为3~4、4~5、5~6、6~6.5RE Fig. 5 The comparison of PE between magnetic field model estimations and observations from VAP along with different MLT in the range 3~6.5RE. (a)—(d) represent respectively the range of 3~4、4~5、5~6、6~6.5RE. The blue lines indicate TS05, the red lines indicate TA15, the orange lines indicate TA16 |
图 6是3~6.5RE内各模型计算值和VAP观测数据在不同MLT下θ比较结果,(a)—(d)图分别代表Lm值范围为3~4、4~5、5~6、6~6.5RE.可以发现,各模型夹角的变化趋势基本一致,随着Lm值的增大,夹角逐渐增大,且θ在6~12时的值比其他时间都小,表明不同Lm上的θ呈现出昼夜不对称性,模型与GOES15实测数据方向偏差在夜间更大.在外辐射带3~6.5RE内TA16模型数据与VAP的磁场实测数据方向偏差最小.

|
图 6 3~6.5RE范围内各模型计算值和VAP观测数据在不同MLT下θ比较结果. (a)—(d)分别代表Lm值范围为3~4、4~5、5~6、6~6.5RE Fig. 6 The comparison of θ between magnetic field model estimations and observations from VAP along with different MLT in the range 3~6.5RE. (a)—(d) represent respectively the range of 3~4、4~5、5~6、6~6.5RE. The blue lines indicate TS05, the red lines indicate TA15, the orange lines indicate TA16 |
图 7是地球同步轨道高度各模型计算值和GOES-15观测数据在不同MLT下的比较结果, 图 7(a、b)分别是PE和θ随MLT变化情况.可以发现,在地球同步轨道附近(Lm~6.6RE),PE在MLT=9-15时的值大于其他地方时区的值,呈现出昼夜不对称性.θ在MLT=6-12时的值小于其他地方时区的值,也呈现出昼夜不对称性.相较而言,TS05模型与GOES15模型实测数据随MLT变化趋势最为一致.

|
图 7 地球同步轨道高度各模型计算值和GOES-15观测数据在不同MLT下的比较结果. (a) PE随MLT变化;(b) θ随MLT变化 Fig. 7 The comparison between magnetic field model estimations and observations from GOES15 along with different MLT at geosynchronous orbit. (a) PE versus MLT (b) θ versus MLT. The blue lines indicate TS05, the red lines indicate TA15, the orange lines indicate TA16 |
本文利用2012—2018年VAP和2011—2017年GOES15卫星的磁场观测数据定量分析了TS05、TA15、TA16三个模型在外辐射带(3~6.6RE)不同空间范围(Lm)、不同地磁活动水平(Kp)以及不同磁地方时(MLT)下的性能表现,得到以下结论:
(1) PE随Lm值增大或地磁活动增强而下降,PE在Lm=5~6.5RE的区域具有晨昏不对称性,三个磁场模型可以较好地描述晨侧磁场的强度,但它们并不能很好地反映下午至昏侧的磁场的强度.在地球同步轨道附近(Lm~6.6RE),PE主要呈现昼夜不对称性,三个磁场模型可以很好地反映昼侧磁场大小,但是它们在夜侧的误差较大.
(2) θ随Lm值增大或地磁扰动的增强而增大,不同Lm上的θ主要呈现昼夜不对称性,三个磁场模型可以较好地描述昼侧磁力线的分布位型,但是它们在夜侧的误差较大.
(3) 在外辐射带Lm约为3~6.5RE空间范围内,TA16模型与VAP观测数据最为接近.
(4) 在地球同步轨道高度(Lm~6.6RE),TS05模型与GOES15卫星磁场观测数据最为接近.
本文对TS05、TA15、TA16三个外磁场模型定量的分析研究将为我国应用卫星(如风云系列卫星、北斗系列卫星)星载高能粒子探测数据的在轨交叉定标、磁层粒子辐射环境的物理机制研究等相关的理论和应用研究提供磁场模型选择方面的支持.Tsyganenko团队现已发展了AT17模型(Andreeva and Tsyganenko, 2018),结合传统的模块化建模方法与新发展的径向基函数方法,可能使AT17模型性能表现优于之前的模型,未来根据需要将会开展进一步研究.
致谢 感谢戈达德空间飞行中心OMNIWeb提供太阳风数据, CDAWeb提供VAP和GOES15磁场观测数据,感谢VAP和GOES-15磁强计研发团队.
Andreeva V A, Tsyganenko N A. 2016. Reconstructing the magnetosphere from data using radial basis functions. Journal of Geophysical Research: Space Physics, 121(3): 2249-2263. DOI:10.1002/2015JA022242 |
Andreeva V A, Tsyganenko N A. 2018. Empirical modeling of the quiet and storm time geosynchronous magnetic field. Space Weather, 16(1): 16-36. DOI:10.1002/2017SW001684 |
Boynton R J, Balikhin M A, Billings S A, et al. 2011. Using the NARMAX OLS-ERR algorithm to obtain the most influential coupling functions that affect the evolution of the magnetosphere. Journal of Geophysical Research:Space Physics, 116(A5): A05218. DOI:10.1029/2010JA015505 |
Huang C L, Spence H E, Singer H J, et al. 2008. A quantitative assessment of empirical magnetic field models at geosynchronous orbit during magnetic storms. Journal of Geophysical Research:Space Physics, 113(A4): A04208. DOI:10.1029/2007JA012623 |
Kletzing C A, Kurth W S, Acuna M, et al. 2013. The electric and magnetic field instrument suite and integrated science (EMFISIS) on RBSP. Space Science Reviews, 179(1-4): 127-181. DOI:10.1007/s11214-013-9993-6 |
Li L Y, Cao J B, Zhou G C, et al. 2008. Shrinkage of magnetosphere observed by TC-1 satellite during the high-speed solar wind stream. Science in China Series E:Technological Sciences, 51(10): 1695-1703. DOI:10.1007/s11431-008-0258-7 |
Li L Y, Cao J B, Zhou G C, et al. 2011. Multiple responses of magnetotail to the enhancement and fluctuation of solar wind dynamic pressure and the southward turning of interplanetary magnetic field. Journal of Geophysical Research:Space Physics, 116(A12): A12223. DOI:10.1029/2011ja016816 |
Li L Y, Cao J B, Yang J Y, et al. 2013. Joint responses of geosynchronous magnetic field and relativistic electrons to external changes in solar wind dynamic pressure and interplanetary magnetic field. Journal of Geophysical Research:Space Physics, 118(4): 1472-1482. DOI:10.1002/jgra.50201 |
Li L Y, Yu J, Cao J B, et al. 2016. Compression-amplified EMIC waves and their effects on relativistic electrons. Physics of Plasmas, 23(6): 062116. DOI:10.1063/1.4953899 |
Li L Y, Liu B, Yu J, et al. 2017. The rapid responses of magnetosonic waves to the compression and expansion of earth's magnetosphere. Geophysical Research Letters, 44(22): 11239-211247. DOI:10.1002/2017gl075649 |
McCollough J P, Gannon J L, Baker D N, et al. 2008. A statistical comparison of commonly used external magnetic field models. Space Weather, 6(10): S10001. DOI:10.1029/2008SW000391 |
Mead G D, Fairfield D H. 1975. A quantitative magnetospheric model derived from spacecraft magnetometer data. Journal of Geophysical Research, 80(4): 523-534. DOI:10.1029/JA080i004p00523 |
Peredo M, Stern D P, Tsyganenko N A. 1993. Are existing magnetospheric models excessively stretched?. Journal of Geophysical Research: Space Physics, 98(A9): 15343-315354. DOI:10.1029/93JA01150 |
Pulkkinen T I, Tsyganenko N A. 1996. Testing the accuracy of magnetospheric model field line mapping. Journal of Geophysical Research:Space Physics, 101(A12): 27431-27442. DOI:10.1029/96JA02489 |
Reeves G D, Weiss L A, Thomsen M F, et al. 1996. A quantitative test of different magnetic field models using conjunctions between DMSP and geosynchronous orbit.//Lemaire J F, Heynderickx D, Baker D N eds. Radiation Belts: Models and Standards. Washington D.C.: Geophysical Monograph Series, 97: 167-172.
|
Spence H E, Kivelson M G, Walker R J. 1987. Static magnetic field models consistent with nearly isotropic plasma pressure. Geophysical Research Letters, 14(8): 872-875. DOI:10.1029/GL014i008p00872 |
Stern D P. 1994. The art of mapping the magnetosphere. Journal of Geophysical Research:Space Physics, 99(A9): 17169-17198. DOI:10.1029/94JA01239 |
Thomsen M F, Mccomas D J, Reeves G D, et al. 1996. An observational test of the Tsyganenko (T89a) model of the magnetospheric field. Journal of Geophysical Research:Space Physics, 101(A11): 24827-24836. DOI:10.1029/96JA02318 |
Tsyganenko N A, Usmanov A V. 1982. Determination of the magnetospheric current system parameters and development of experimental geomagnetic field models based on data from IMP and HEOS satellites. Planetary and Space Science, 30(10): 985-998. DOI:10.1016/0032-0633(82)90148-9 |
Tsyganenko N A. 1987. Global quantitative models of the geomagnetic field in the cislunar magnetosphere for different disturbance levels. Planetary and Space Science, 35(11): 1347-1358. DOI:10.1016/0032-0633(87)90046-8 |
Tsyganenko N A. 1989. A magnetospheric magnetic field model with a warped tail current sheet. Planetary and Space Science, 37(1): 5-20. |
Tsyganenko N A. 1995. Modeling the Earth's magnetospheric magnetic field confined within a realistic magnetopause. Journal of Geophysical Research:Space Physics, 100(A4): 5599-5612. DOI:10.1029/94JA03193 |
Tsyganenko N A. 1996. Effects of the solar wind conditions in the global magnetospheric configurations as deduced from data-based field models (Invited).//Proceedings of the 3rd International Conference on Substorms. Versailles: European Space Agency.
|
Tsyganenko N A. 2002a. A model of the near magnetosphere with a dawn-dusk asymmetry 1. Mathematical structure. Journal ofGeophysical Research: Space Physics, 107(A8): SMP 12-1-SMP 12-15. DOI:10.1029/2001JA000219 |
Tsyganenko N A. 2002b. A model of the near magnetosphere with a dawn-dusk asymmetry 2. Parameterization and fitting to observations. Journal of Geophysical Research:Space Physics, 107(A8): SMP 10-1-SMP 10-17. DOI:10.1029/2001JA000220 |
Tsyganenko N A, Singer H J, Kasper J C. 2003. Storm-time distortion of the inner magnetosphere:How severe can it get?. Journal of Geophysical Research:Space Physics, 108(A5): 1209. DOI:10.1029/2002JA009808 |
Tsyganenko N A, Sitnov M I. 2005. Modeling the dynamics of the inner magnetosphere during strong geomagnetic storms. Journal of Geophysical Research:Space Physics, 110(A3): A03208. DOI:10.1029/2004JA010798 |
Tsyganenko N A. 2013. Data-based modelling of the Earth's dynamic magnetosphere:a review. Annales Geophysicae, 31(10): 1745-1772. DOI:10.5194/angeo-31-1745-2013 |
Tsyganenko N A, Andreeva V A. 2015. A forecasting model of the magnetosphere driven by an optimal solar wind coupling function. Journal of Geophysical Research:Space Physics, 120(10): 8401-8425. DOI:10.1002/2015JA021641 |
Tsyganenko N A, Andreeva V A. 2016. An empirical RBF model of the magnetosphere parameterized by interplanetary and ground-based drivers. Journal of Geophysical Research:Space Physics, 121(11): 10786-10802. DOI:10.1002/2016JA023217 |
Vassiliadis D. 2007. Forecasting space weather.//Bothmer V, Daglis I A eds. Space Weather-Physics and Effects. New York: Springer, 419-420.
|
Walker R J. 1976. An evaluation of recent quantitative magnetospheric magnetic field models. Reviews of Geophysics, 14(3): 411-427. DOI:10.1029/RG014i003p00411 |
Wolf R A. 1995. Magnetospheric configuration.//Kivelson M G, Russell C T eds. Introduction to Space Physics. New York, Cambridge University Press, 288-325.
|
Yang J Y, Dunlop M W, Lühr H, et al. 2018. Statistical correlation analysis of field-aligned currents measured by Swarm. Journal of Geophysical Research:Space Physics, 123(10): 8170-8184. DOI:10.1029/2018JA025205 |
Yu J, Li L Y, Cao J B, et al. 2015. Multiple loss processes of relativistic electrons outside the heart of outer radiation belt during a storm sudden commencement. Journal of Geophysical Research:Space Physics, 120(12): 10275-10288. DOI:10.1002/2015ja021460 |
Yu J, Li L Y, Cao J B, et al. 2016. The influences of solar wind pressure and interplanetary magnetic field on global magnetic field and outer radiation belt electrons. Geophysical Research Letters, 43(14): 7319-7327. DOI:10.1002/2016GL069029 |