 2020, Vol. 63


2. 上海市气候中心, 上海 200030;
3. 中国气象科学研究院, 北京 100081
2. Shanghai Climate Center, Shanghai 200030, China;
3. Chinese Academy of Meteorological Sciences, Beijing 100081, China
美国气象学家Rossby(1939)指出由于地球的旋转和球面效应可以产生大气长波,即Rossby波.叶笃正(Yeh,1949)首先从理论上研究了长波频散的性质,指出大气能量是按群速度传播的,这个理论沿用至今,是大气动力学的经典理论.关于定常Rossby波形成的机理,地形和非绝热加热对准定常Rossby波的形成的相对贡献一直是争论的焦点.Manabe和Hahn(1981)、Valdes和Hoskins(1989)的工作表明非绝热加热的贡献更大,而Nigam等(1986, 1988)则认为两者具有同等的重要性,这也是目前的主流观点(陈文和黄荣辉,2005).
定常Rossby波空间尺度大、演变周期长、具有准定常性,它对大气环流的演变和短期气候变化有十分重要的影响(陈文和魏科,2009),因而其传播特征一直以来都是研究的重点.自叶笃正(Yeh,1949)研究了Rossby波在纬向的传播和能量频散之后,Charney和Drazin(1961)、Eliassen和Palm(1961)研究了其在经向的传播和能量频散.Wallace和Gutzler(1981)发现了北半球大气环流异常存在几种遥相关型,而为了揭示其机理,Hoskins和Karoly(1981)将大气长波纬向频散推广到二维球面的能量频散,得到了低频扰动遵从“大圆”路径的结论.
20世纪60年代以来,Rossby波的垂直传播颇受气象学家关注.Charney和Drazin(1961)以及Eliassen和Palm(1961)研究了准定常Rossby波能量在有垂直切变的理想基流下的垂直传播,他们认为,产生自对流层的准定常Rossby波只有当大气基本气流为西风,且西风不能过强时才能上传.Matsuno(1970, 1971)进一步研究了非常接近于实际气流的理想气流下准定常Rossby波能量从对流层向平流层的传播.而这种上传的Rossby波与平流层中的极涡相互作用会导致冬季平流层的爆发性增温(Matsuno,1971;Holton,1976).黄荣辉(1984)证明了Eliassen和Palm(1961)引入的波作用通量(EP通量)平行于子午面内Rossby波的群速度,可以用来很好地描述Rossby波能量的传播.
关于Rossby波在不同季节的传播特征,前人也多有研究.冬季,Rossby波能量可以穿过对流层顶进入平流层,使得平流层与对流层动力地耦合在一起(Chen and Huang, 2002;Shi,2017).Huang和Gambo(1981, 1982a, b, 1983, 1984)分析研究了准定常Rossby波在三维球面大气中的传播规律, 揭示出在冬季球面三维大气中准定常Rossby波可以沿两支波导传播.一支波导源自高纬度地区,从对流层垂直传播到平流层, 并在平流层向赤道方向传播, 称之为极地波导.另一支波导源自中纬度对流层,向低纬度对流层顶传播, 称之为低纬波导.陈文和黄荣辉(2005)利用全球大气环流模式也较好地模拟出了这两支波导.陈文和黄荣辉(2005)的研究表明,大气Rossby波的极地波导和低纬波导存在明显的年际变化,陈文和魏科(2009)研究表明,Rossby波传播的年际振荡与东亚地区气候异常的关系显著地受到热带平流层准两年周期振荡(QBO)的调制, 只有当QBO处于东风位相时,Rossby波传播的年际振荡才与东亚气候异常有显著的关系.
而在夏季,平流层盛行东风,Rossby波能量难以向上传播(陈泽宇和吕达仁,2009;杨蕾等,2006).因此,以往对Rossby波能量向平流层传播的研究多考虑冬季的情况(陈文和黄荣辉,2005;陈文,2006;陈文和魏科,2009).事实上,夏季南亚高压反气旋环流中并非只有东风存在.因此,Rossby波也可能在南亚高压区向上传播.并且夏季常出现不稳定层结,而当低纬度大气层结不稳定时,1-8波都可能在东风中产生垂直传播(林本达和高山月,1994).因此,研究夏季南亚高压区Rossby波的传播特征,特别是其垂直传播特征是有意义的.
另外,以往研究Rossby波时,认为波长较小的波动多无法穿越对流层顶,所以多关注1-3波(杨蕾等,2006).然而,Huang和Gambo(1983, 1984)的分析研究表明,在夏季中纬地区4-6波的垂直传播同样重要,需要进一步研究,同时最近研究表明:天气尺度的瞬变波作用可能是影响平流层过程的重要因子(陈海山等,2012;Shi,2017).因此,本文利用ECMWF提供的1979—2015年ERA-interim逐日再分析资料,分析了夏季南亚高压区Rossby波1-6波的传播特征.
1 资料与方法使用了欧洲中期天气预报中心(ECMWF)的ERA-interim 1979—2015年夏季(6—8月)逐日再分析资料.变量有温度T、位势Z、纬向风U、经向风V和位势涡度PV,水平分辨率为2.5°×2.5°,垂直方向上从1000到1 hPa共37层.该资料已广泛应用于平流层-对流层相互作用的研究中(Seviour et al., 2012;Wang et al., 2015;Mohanakumar, 2019).
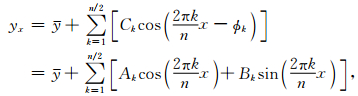
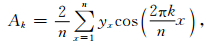
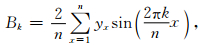
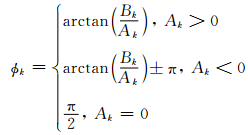
首先,通过对空间数据进行傅里叶变换,可以提取沿纬圈变化的不同尺度的波动信号(杨蕾等,2006).本文将资料中1-6波逐年分离出来,把波数大于6的波动滤去.对于任意气象要素场yx做纬向谐波分析,可以得到对应的纬圈平均场和任意波数扰动的表达式:
|
(1) |
其中的Ak、Bk及位相ϕk可由(2)(3)(4)式求出(k=1, 2, 3, …表示纬向波数):
|
(2) |
|
(3) |
|
(4) |
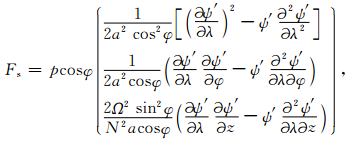
接着,根据Alan Plumb(1985)的方法计算三维波作用通量.在球面、无辐散、准地转条件下,波作用传播特征Fs的表达式为:
|
(5) |
而为了减少由于连续差分带来的误差增加,经变形得

|
(6) |
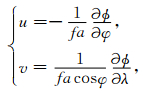
其中
|
(7) |
φ、λ、ϕ、f、a、Ω分别表示纬度、经度、位势、科氏参数、地球半径和地球自转速率,上标“-”、“′”分别表示纬向平均和纬向偏差.
由于EP通量是一个纬圈平均的量,因此只能应用于纬圈平均条件下的波的经向和垂直传播研究,而Plumb提出的线性、准地转定常波的三维波作用通量具有以下性质:(1)对于准平面波,F平行于群速度且与位相无关;(2)F是对波作用通量的保守度量,即对于定常守恒的线性波是无辐散的;(3)对于西风气流,F的辐合表示波作用的积蓄,辐散表示波作用的输出;(4)将F进行纬圈平均,则得到EP通量;(5)F的散度直接与非守恒作用相联系.而三维波作用通量在平流层和对流层差异较大,为了便于对比平流层和对流层作用通量的传播,对标准化后的三维波作用通量在不同高度上取了不同的权重(施春华等,2015).
另外,对流层顶是基于位涡(Potential Vorticity,PV)的动力学方法计算的(Danielsen et al., 1987).将对流层顶附近位涡梯度极大区定义为动力学对流层顶,它将极度稳定的平流层空气和相对不稳定的对流层空气隔开.由于在伴随波动过境的辐合所造成的静力稳定度的变化期间,用温度递减率定义的对流层顶面的一个主要缺点是其相对于大气的移动是“非物理的、任意的、不规则的行为”.与此相反,位涡定义的对流层顶面的移动不依赖于绝热辐合,而主要决定于空气的三维运动,这就保证了位涡定义的对流层顶面在大的空间和时间尺度上的连续性(卞建春,2009).所以选择使用动力学对流层顶进行研究.
2 南亚高压区Rossby波能量传播特征纬圈平均的夏季标准化和加权Rossby波作用通量均显示,Rossby波能量在对流层中高纬度向上向低纬传播,并在对流层低纬度地区向下传播,Rossby波能量在通过对流层顶后迅速减弱(图 1),这与前人的结果类似(杨蕾等,2006).加权后的Rossby波作用通量在对流层顶附近的特征较标准化的波作用通量特征更为清楚(图 1,施春华等,2015),因此,后面均使用加权后的Rossby波作用通量表示Rossby波的能量传播.

|
图 1 1979—2015年夏季平均的纬圈平均标准化(a)和加权(b)Rossby波作用通量(黑色矢量,单位:m2·s-2)和垂直通量(填色,单位:m2·s-2),其中紫色实线为对流层顶 Fig. 1 The summer average of zonal mean standardized (a), weighted (b) Rossby wave activity flux (black vector, units: m2·s-2) and vertical Rossby wave activity flux (color, units: m2·s-2) between 1979—2015, the purple solid line represents the tropopause |
夏季南亚高压及其附近地区,Rossby波能量垂直传播的模态在150~70 hPa的基本一致(图 2).根据图 2中夏季Rossby波能量的垂直传播特征,可以将南亚高压及其附近地区分为四个区域:西北区(0°—60°E,30°N—45°N)、东北区(70°E—105°E,30°N—45°N)、西南区(30°E—70°E,10°N—25°N)和东南区(80°E—150°E,10°N—30°N).在150、100和70 hPa南亚高压的西北区均存在较强的Rossby波能量上传,其最强的中心位于40°E,40°N附近(图 2).150 hPa上,南亚高压的西北区北部位于平流层,南部位于对流层,而在100 hPa和70 hPa上,南亚高压的西北区均位于平流层(图 2).因此,在南亚高压的西北区Rossby波能量上传,并能够穿越对流层顶.在南亚高压西北区的Rossby波能量除了上传外,还分别向东、向东南传播至南亚高压东北区和西南区(图 2).南亚高压东北区的Rossby波能量主要来自平流层下传和南亚高压西北区(图 2).南亚高压东北区的一部分能量下传,下传的最强中心位于80°E,35°N附近,一部分能量向东南传播至东南区(图 2).南亚高压西南区的Rossby波能量主要来自南亚高压西北区.南亚高压西南区的一部分能量在对流层存在较强下传(图 2b,c),还有一部分能量在平流层存在较弱上传(图 2a).因此,在南亚高压西南区的Rossby波能量穿越对流层顶传播并不明显.来源于南亚高压东北区、西南区以及对流层中下层的Rossby波能量,在南亚高压东南区对流层存在明显上传(图 2b,c),达到对流层顶后无法继续上传(图 2a).

|
图 2 70 hPa(a)、100 hPa(b)和150 hPa(c)上1979—2015年夏季平均的Rossby波作用水平通量(黑色矢量,单位:m2·s-2)、垂直通量(填色,单位:m2·s-2)和水平风场(白色流线,单位:m2·s-1) Fig. 2 The summer average of horizontal Rossby wave activity flux (black vector, units: m2·s-2), vertical Rossby wave activity flux (color, units: m2·s-2) and horizontal wind field (white streamline, units: m2·s-1) on 70 hPa (a), 100 hPa (b), 150 hPa (c) between 1979—2015 |
为了说明滤波的必要性及Rossby波4-6波在夏季南亚高压区传播的特殊性,绘制了未进行滤波的Rossby波在南亚高压区的垂直传播特征图(图 3).对比图 2及图 3,可以发现滤波和不进行滤波在传播特征上存在较明显区别.主要体现在传播特征区域的边界模糊,同一等压面上水平通量差异大,以及部分区域垂直传播特征的改变.原因是,逐日资料里可能包含了较多的小扰动,而本文的目的是讨论较大尺度的Rossby波,所以采用了谐波分析来滤除小扰动的影响,因此进行滤波是有必要的.

|
图 3 70 hPa(a)、100 hPa(b)和150 hPa(c)上1979—2015年夏季平均的Rossby波作用水平通量(黑色矢量,单位:m2·s-2)、垂直通量(填色,单位:m2·s-2)和水平风场(白色流线,单位:m2·s-1),未滤波 Fig. 3 The summer average of horizontal Rossby wave activity flux (black vector, units: m2·s-2), vertical Rossby wave activity flux (color, units: m2·s-2) and horizontal wind field (white streamline, units: m2·s-1) on 70 hPa (a), 100 hPa (b), 150 hPa (c) between 1979—2015 without filter |
综上所述,南亚高压区的Rossby波能量只能在西北区可以从对流层向平流层穿越对流层顶传播,而在南亚高压的东北区和西南区Rossby波能量以下传为主,在南亚高压东南区Rossby波能量在对流层上传,到达对流层顶后无法继续上传.而Charney和Drazin(1961)认为对流层的准定常Rossby波上传与纬向风场息息相关,又有前人研究表明(Harada et al., 2010;Kodera et al., 2013;Shi et al., 2017),温压场的不同配置对波作用通量的传播特征会产生不同影响.因此,为了研究南亚高压区Rossby波能量穿越对流层顶传播的机制,下面分析了南亚高压四个区域的垂直剖面上Rossby波能量的垂直传播特征,以及纬向风场、急流和温压场的配置.
3 南亚高压区Rossby波能量向上穿越对流层顶传播的特征与机制向上(向下)的波作用通量,反映的就是Rossby波(形)的上传(下传),与波群速度的传播方向是一致的.南亚高压西北区的Rossby波能量在对流层中上传,并穿越对流层顶(图 2,4a,b).向上的波作用通量在对流层顶下方的200~250 hPa的35°E—55°E,35°N—42°N达到最强(16 m2·s-2),进入平流层逐渐减弱至2 m2·s-2(图 4a,b).西北区Rossby波能量可以穿越对流层顶传播的原因有两个.一个原因是西北区的对流层和下平流层盛行西风,日均西风的频率大于80%,第二个原因是西北区的日均西风急流(u≥38 m·s-1)出现的频率很小,最大仅为0.8%(图 4c,d).即南亚高压西北区盛行西风,且强风速出现频率极低,因此Rossby波能量可以从对流层上传,并穿越对流层顶.

|
图 4 南亚高压西北区经向(a)和纬向(b)垂直剖面上1979—2015年夏季平均的Rossby波作用通量(黑色矢量,单位:m2·s-2)、Rossby波作用通量的垂直分量(填色,单位:m2·s-2)和位势高度纬向偏差(黑色实线,单位:dagpm);南亚高压西北区经向(c)和纬向(d)垂直剖面上1979—2015年夏季平均的日均西风出现的频率(填色,单位:1)、日均西风急流核的位置(黑色等值线,U=38 m·s-1,单位:m·s-1)与西风急流(U≥38 m·s-1)出现的频率(白色等值线,单位:1);紫色实线为对流层顶 Fig. 4 The summer average of Rossby wave activity flux (black vector, units: m2·s-2), vertical Rossby wave activity flux (color, units: m2·s-2) and zonal deviation of geopotential height (black solid line, units: dagpm) in northwest region of South Asia High on meridional vertical section (a) and zonal vertical section (b) between 1979—2015. The summer average of daily average west wind frequency (color, units: 1), location of daily average west wind jet stream cores (black contour line, U=38 m·s-1, units: m·s-1) and frequency of west wind jet stream (U≥38 m·s-1) (white contour line, units: 1) between 1979—2015, the purple solid line represents the tropopause |
南亚高压东北区的Rossby波能量以下传为主,不存在向上穿越对流层顶的特征(图 2,5a,b).向下的波作用通量在对流层35°N,80°E—85°E较强(-6 m2·s-2),在平流层中下层较弱(-2 m2·s-2,图 5a,b).类似于南亚高压西北区,东北区也盛行西风,在对流层顶附近日均西风的频率也大于80%(图 5c,d),这种风场配置是有利于Rossby波上传的.然而,南亚高压东北区强西风(u≥38 m·s-1)出现的频率较高,最高能达到20%,因此会抑制行星波的上传,是Rossby波能量下传为主的原因.

南亚高压西南区的Rossby波能量在对流层中上层和平流层中下层以下传为主(图 2,6a,b).向下的波作用通量在对流层中上层200~400 hPa的20°N—25°N,50°E—60°E较强,可达-8 m2·s-2,在平流层中下层较弱为-2 m2·s-2(图 6a,b).南亚高压西南区的Rossby波能量不能上传的主要原因有两个.一是南亚高压西南区盛行东风,对流层中上层和平流层中下层日均东风频率大于80%(图 6c,d),中等强度东风和强东风(u≤-15 m·s-1)出现的频率在200 hPa就可以达到80%,在对流层层顶10°N—20°N和50°E—70°E附近可以达到90%.二是,南亚高压西南区在对流层位于青藏高原环流的伊朗高原下沉区附近,层结稳定(钱正安等,2001),在平流层,其层结也稳定.层结稳定的大气盛行东风,行星波不能上传(林本达和高山月,1994).

|
图 6 同图 4,但是为南亚高压西南区的情况,(c)和(d)为日均东风出现的频率(填色,单位:1)与强东风(U≤-15 m·s-1)出现的频率(白色等值线,单位:1) Fig. 6 Same as Fig. 4, but for the southwest region of South Asia High, (c) and (d) are the frequency of daily average east wind (color, units: 1) and strong east wind (U≤-15 m·s-1) (white contour line, units: 1) |
南亚高压东南区的Rossby波能量在对流层中上层上传,到达对流层顶附近迅速减弱,并在平流层转为下传.对流层中向上波作用通量的大值区位于200 hPa附近的20°N—30°N,90°E —150°E,可达4 m2·s-2,对流层顶附近向上波作用通量约为0,平流层中下层向下波作用通量也约为0.其原因有两个.其一,类似于南亚高压西南区,东南区也盛行东风,对流层中上层和平流层中下层日均东风频率大于80%(图 7c,d),中等强度东风和强东风(u≤-15 m·s-1)出现的频率也在对流层顶13°N,80°E—90°E附近达到最大值90%.二是,南亚高压东南区在对流层位于南海-西太平洋热带幅合带(杨彩福等,2003),层结不稳定.当低纬度大气层结不稳定时,Rossby波能量可以在东风中产生垂直传播(林本达和高山月,1994).

前人研究表明,温压场的不同配置对波作用通量的传播特征也会产生不同影响(Harada et al., 2010;Kodera et al., 2013;Shi et al., 2017).因此选择0°—150°E,10°N—30°N以及0°—150°E,30°N—45°N两个区域,并结合Plumb三维波作用通量垂直分量公式:

|
(8) |
分析温压场配置对波作用通量传播的影响(图 8).其中

|
图 8
0°—150°E,10°N—30°N(a,c,e)及0°—150°E,30°N —45°N(b,d,f)剖面上1979—2015年夏季平均的温度纬向偏差(填色,单位:K),位势高度纬向偏差(黑色实线,单位:dagpm),Rossby波作用通量(黑色矢量,单位:m2·s-2)(a,b),pcosφ× 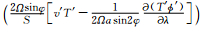 |
三维波作用通量垂直分量公式中,第一项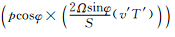


南亚高压的东南和西南区位于0°—150°E,10°N—30°N区域内(图 8a,c,e).该区域受高温控制,西侧吹南风,东侧吹北风,且东西向等高线疏密程度基本相近,因此第一项显示东西两侧为数值接近的负异常与正异常(图 8c).而在该区域的西侧,温度脊超前于高度脊,因此第二项在西侧显示为负异常,东侧温度脊落后于高度脊,因此东侧显示为正异常(图 8e).对比图 8c与图 8e,可以发现第一项数值均小于第二项,所以在该区域位相关系决定的第二项起决定作用,波作用通量在西侧显示下传,东侧显示上传.
南亚高压的西北和东北区位于0°—150°E,30°N—45°N区域内(图 8b,d,f),与南区相似,其受高温控制,西侧南风东侧北风,但由于西侧等高线较密集,因此第一项显示的西侧正异常要大于东侧负异常(图 8d).而在该区域西侧,由于温度脊超前于高度脊,因此第二项显示出负异常,在该区域东侧则显示温度脊只稍稍落后于高度脊,因此第二项在东侧显示出较弱的正异常(图 8f).对比图 8d与图 8f,可以发现第一项数值均大于第二项,所以在该区域内,涡动热量通量异常引起的第一项起决定作用,波作用通量在西侧显示上传,东侧显示下传.
4 结论与讨论夏季平流层盛行强东风,Rossby波能量难以从对流层向上传播至平流层,因此以往对Rossby波能量向平流层传播的研究多考虑冬季的情况.而事实上,因为夏季高原上空南亚高压反气旋环流中并非只有强东风存在,所以Rossby波能量也可能在南亚高压区向上传播.因此,利用ERA-interim逐日再分析资料,分析了1979—2015年夏季南亚高压区Rossby波能量穿越对流层顶传播的特征与机制.结果表明:
(1) 南亚高压区的Rossby波能量只能在西北区可以从对流层向平流层穿越对流层顶传播,而在南亚高压的东北区和西南区Rossby波能量以下传为主,在南亚高压东南区Rossby波能量在对流层上传,到达对流层顶后无法继续上传.
(2) 南亚高压西北区的Rossby波能量在对流层中上传并穿越对流层顶.其原因为该区域盛行西风且强风速出现频率极低,涡动热量通量异常引起的第一项对其上传有很大贡献.
(3) 南亚高压东北区的Rossby波能量以下传为主,不存在向上穿越对流层顶的特征.其原因为该区域强西风出现的频率较高,抑制行星波的上传,温度脊与高度脊相近的位相也是能量无法上传的重要原因.
(4) 南亚高压西南区的Rossby波能量在对流层中上层和平流层中下层以下传为主.其原因为该区域盛行东风,且对流层位于青藏高原环流的伊朗高原下沉区附近,层结稳定,平流层也层结稳定.层结稳定的东风气流,以及温度脊超前于高度脊的位相关系,都使得Rossby波能量很难上传.
(5) 南亚高压东南区的Rossby波能量在对流层中上层上传,到达对流层顶附近迅速减弱,并在平流层转为下传.其原因为该区域盛行东风,且对流层位于南海-西太平洋热带幅合带,层结不稳定,平流层层结稳定,温度脊落后于高度脊的温压场配置也为波作用通量在对流层中的传播提供了有利条件.
既然夏季Rossby波能量可以通过南亚高压的西北部上传至平流层,那么这部分能量对局地环流和大气成分有何影响?重力波也可以上传至平流层,那么Rossby波是否会与其发生相互作用?另外,南亚高压北部盛行西风,然而西风急流核附近,Rossby波能量难以上传.因此西风急流的摆动与Rossby波能量的上传的关系如何也是很有趣的问题.这些问题都值得进一步研究.
Alan Plumb R. 1985. On the three-dimensional propagation of stationary waves. J. Atmos. Sci., 42(3): 217-229. DOI:10.1175/1520-0469(1985)042<0217:OTTDPO>2.0.CO;2 |
Bian J C. 2009. Recent advances in the study of atmospheric vertical structures in upper troposphere and lower stratosphere. Advances in Earth Science (in Chinese), 24(3): 262-271. |
Charney J G, Drazin P G. 1961. Propagation of planetary-scale disturbances from the lower into the upper atmosphere. J. Geophys. Res., 66(1): 83-109. DOI:10.1029/JZ066i001p00083 |
Chen H S, Liu L, Zhu Y J. 2013. Possible linkage between winter extreme low temperature events over China and synoptic-scale transient wave activity. Science China (Earth Sciences), 56(7): 1266-1280. DOI:10.1007/s11430-012-4442-z |
Chen W, Huang R H. 2002. The propagation and transport effect of planetary waves in the Northern Hemisphere winter. Advances in Atmospheric Sciences, 19(6): 1113-1126. DOI:10.1007/s00376-002-0069-x |
Chen W, Huang R H. 2005. The three-dimensional propagation of quasi-stationary planetary waves in the northern hemisphere winter and its Interannual variations. Chinese Journal of Atmospheric Science (in Chinese), 29(1): 137-146. |
Chen W, Wei K. 2009. Anomalous propagation of the quasi-stationary planetary waves in the atmosphere and its roles in the impact of the stratosphere on the East Asian winter climate. Advances in Earth Science (in Chinese), 24(3): 272-285. |
Chen Z Y, Lü D R. 2009. Characteristics of the stratospheric travelling planetary waves revealed by using satellite data. Advances in Earth Science (in Chinese), 24(3): 320-330. |
Danielsen E F, Hipskind R S, Gaines S E, et al. 1987. Three-dimensional analysis of potential vorticity associated with tropopause folds and observed variations of ozone and carbon monoxide. J. Geophys. Res. Atmos., 92(D2): 2103-2111. DOI:10.1029/JD092iD02p02103 |
Eliassen A, Palm E. 1961. On the transfer of energy in stationary mountain waves. Geofysiske Publikasjoner, 22: 1-23. |
Harada Y, Goto A, Hasegawa H, et al. 2010. A major stratospheric sudden warming event in January 2009. J. Atmos. Sci., 67(6): 2052-2069. DOI:10.1175/2009JAS3320.1 |
Holton J R. 1976. A semi-spectral numerical model for wave-mean flow interactions in the stratosphere:application to sudden stratospheric warmings. J. Atmos. Sci., 33(8): 1639-1649. DOI:10.1175/1520-0469(1976)033<1639:ASSNMF>2.0.CO;2 |
Hoskins B J, Karoly D J. 1981. The steady linear response of a spherical atmosphere to thermal and orographic forcing. J. Atmos. Sci., 38(6): 1179-1196. DOI:10.1175/1520-0469(1981)038<1179:TSLROA>2.0.CO;2 |
Huang R H, Gambo K. 1981. The response of a model atmosphere in middle latitude to forcing by topography and stationary heat sources. J. Meteor. Soc. Jpn., 59(2): 220-237. DOI:10.2151/jmsj1965.59.2_220 |
Huang R H, Gambo K. 1982a. The response of a hemispheric multi-level model atmosphere to forcing by topography and stationary heat sources. Part Ⅰ. Forcing by topography. J. Meteor. Soc. Jpn., 60: 88-92. |
Huang R H, Gambo K. 1982b. The response of a hemispheric multi-level model atmosphere to forcing by topography and stationary heat sources. Part Ⅱ. Forcing by stationary heat sources and forcing by topography and stationary heat sources. J. Meteor. Soc. Jpn., 60: 93-108. DOI:10.2151/jmsj1965.60.1_93 |
Huang R H, Gambo K. 1983. The response of a hemispheric multi-level model atmosphere to forcing by topography and stationary heat sources in summer. J. Meteor. Soc. Jpn., 61(4): 495-509. DOI:10.2151/jmsj1965.61.4_495 |
Huang R H, Gambo K. 1984. On other wave guide in stationary planetary wave propagations in winter Northern Hemisphere. Sci. China (Ser. B), 27(6): 610-624. |
Huang R H. 1984. Wave action conservation equation for planetary wave in a spherical atmosphere and wave guides of stationary planetary wave propagations shown by propagations shown by wave action flux. Sci. China (Ser. B), 27(12): 1282-1295. |
Kodera K, Mukougawa H, Fujii A. 2013. Influence of the vertical and zonal propagation of stratospheric planetary waves on tropospheric blockings. J. Geophys. Res. Atmos., 118(15): 8333-8345. DOI:10.1002/jgrd.50650 |
Lin B D, Gao S Y. 1994. The vertical propagation of stationary planetary waves and its dynamic effects. Chinese Journal of Atmospheric Sciences (in Chinese), 18(S1): 889-901. |
Manabe S, Hahn D G. 1981. Simulation of atmospheric variability. Mon. Wea. Rev., 109(11): 2260-2286. DOI:10.1175/1520-0493(1981)109<2260:SOAV>2.0.CO;2 |
Matsuno T. 1970. Vertical propagation of stationary planetary waves in the winter Northern Hemisphere. J. Atmos. Sci., 27(6): 871-883. DOI:10.1175/1520-0469(1970)027<0871:VPOSPW>2.0.CO;2 |
Matsuno T. 1971. A dynamical model of the stratospheric sudden warming. J. Atmos. Sci., 28(8): 1479-1494. DOI:10.1175/1520-0469(1971)028<1479:ADMOTS>2.0.CO;2 |
Mohanakumar K. 2019. Stratosphere Troposphere Interactions: An Introduction (in Chinese). Guo D Trans. Beijing: Publishing House of Electronics Industry, 122.
|
Nigam S, Held I M, Lyons S W. 1986. Linear simulation of the stationary eddies in a general circulation model. Part Ⅰ:The no-mountain model. J. Atmos. Sci., 43(23): 2944-2961. DOI:10.1175/1520-0469(1986)043<2944:LSOTSE>2.0.CO;2 |
Nigam S, Held I M, Lyons S W. 1988. Linear simulation of the stationary eddies in a GCM. Part Ⅱ:The "mountain" model. J. Atmos. Sci., 45(9): 1433-1452. DOI:10.1175/1520-0469(1988)045<1433:LSOTSE>2.0.CO;2 |
Qian Z A, Wu T W, Liang X Y. 2001. Feature of mean vertical circulation over the Qinghai-Xizang Plateau and its neighborhood. Chinese Journal of Atmospheric Sciences (in Chinese), 25(4): 444-454. |
Rossby C G. 1939. Relation between variations in the intensity of the zonal circulation of the atmosphere and the displacements of the semi-permanent centers of action. J. Marine Res., 2(1): 38-55. DOI:10.1357/002224039806649023 |
Seviour W J M, Butchart N, Hardiman S C. 2012. The Brewer-Dobson circulation inferred from ERA-Interim. Quarterly Journal of the Royal Meteorological Society, 138(665): 878-888. DOI:10.1002/qj.966 |
Shi C H, Xu T, Cai J, et al. 2015. The E-P flux calculation in spherical coordinates and its application. Transactions of Atmospheric Sciences (in Chinese), 38(2): 267-272. |
Shi C H, Xu T, Guo D, et al. 2017. Modulating effects of planetary wave 3 on a stratospheric sudden warming event in 2005. J. Atmos. Sci., 74(5): 1549-1559. DOI:10.1175/JAS-D-16-0065.1 |
Valdes P J, Hoskins B J. 1989. Linear stationary wave simulations of the time-mean climatological flow. J. Atmos. Sci., 46(16): 2509-2527. DOI:10.1175/1520-0469(1989)046<2509:LSWSOT>2.0.CO;2 |
Wallace J M, Gutzler D S. 1981. Teleconnections in the geopotential height field during the Northern Hemisphere winter. Mon. Wea. Rev., 109(4): 784-812. DOI:10.1175/1520-0493(1981)109<0784:TITGHF>2.0.CO;2 |
Wang W G, Yang F Y, Wang H Y, et al. 2015. The distribution characters of the stratospheric Brewer-Dobson circulation inferred from ERA-Interim. Chinese Journal of Geophysics (in Chinese), 58(2): 371-382. DOI:10.6038/cjg20150203 |
Yang C F, Jiao X L, Peng C. 2003. The tropical belt of convergence and the climate of South China Sea. Marine Science Bulletin (in Chinese), 22(6): 83-87. |
Yang L, Chen W, Huang R H. 2006. The data analysis and numerical simulation of the climatology of quasi-stationary planetary waves in the Northern Hemisphere. Chinese Journal of Atmospheric Sciences (in Chinese), 30(3): 361-376. |
Yeh T C. 1949. On energy dispersion in the atmosphere. J. Meteor., 6(1): 1-16. |
卞建春. 2009. 上对流层/下平流层大气垂直结构研究进展. 地球科学进展, 24(3): 262-271. DOI:10.3321/j.issn:1001-8166.2009.03.005 |
陈海山, 刘蕾, 朱月佳. 2012. 中国冬季极端低温事件与天气尺度瞬变波的可能联系. 中国科学:地球科学, 42(12): 1951-1965. |
陈文, 黄荣辉. 2005. 北半球冬季准定常行星波的三维传播及其年际变化. 大气科学, 29(1): 137-146. DOI:10.3878/j.issn.1006-9895.2005.01.16 |
陈文. 2006. 北半球冬季准定常行星波传播的年代际变化. 自然科学进展, 16(4): 485-489. DOI:10.3321/j.issn:1002-008X.2006.04.016 |
陈文, 魏科. 2009. 大气准定常行星波异常传播及其在平流层影响东亚冬季气候中的作用. 地球科学进展, 24(3): 272-285. DOI:10.3321/j.issn:1001-8166.2009.03.006 |
陈泽宇, 吕达仁. 2009. 利用卫星数据考察平流层传播性行星波活动特征. 地球科学进展, 24(3): 320-330. DOI:10.3321/j.issn:1001-8166.2009.03.010 |
黄荣辉. 1984. 球面大气中行星波的波作用守恒方程及用波作用通量所表征的定常行星波传播波导. 中国科学B辑, 14(8): 766-775. |
林本达, 高山月. 1994. 定常行星波的垂直传播及其动力学效应. 大气科学, 18(S1): 889-901. |
Mohanakumar K. 2019.平流层与对流层相互作用引论.郭栋译.北京: 电子工业出版社, 122.
|
钱正安, 吴统文, 梁潇云. 2001. 青藏高原及周围地区的平均垂直环流特征. 大气科学, 25(4): 444-454. DOI:10.3878/j.issn.1006-9895.2001.04.02 |
施春华, 徐婷, 蔡娟, 等. 2015. 球面E-P通量的计算及其应用. 大气科学学报, 38(2): 267-272. |
王卫国, 杨芳园, 王颢樾, 等. 2015. 利用ERA-Interim资料对平流层Brewer-Dobson环流变化趋势的分析. 地球物理学报, 58(2): 371-382. DOI:10.6038/cjg20150203 |
杨彩福, 焦新龙, 彭灿. 2003. 热带辐合带与南海气候. 海洋通报, 22(6): 83-87. DOI:10.3969/j.issn.1001-6392.2003.06.013 |
杨蕾, 陈文, 黄荣辉. 2006. 北半球准定常行星波气候平均态的资料分析和数值模拟. 大气科学, 30(3): 361-376. DOI:10.3878/j.issn.1006-9895.2006.03.01 |