 2020, Vol. 63


2. 南方科技大学, 深圳 518055;
3. 哈尔滨工业大学(深圳), 深圳 518055;
4. 中南大学, 长沙 410083
2. Southern University of Science and Technology, Shenzhen 518055, China;
3. Harbin Institute of Technology(Shenzhen), Shenzhen 518055, China;
4. Central South University, Changsha 410083, China
微动是指地球表面非地震引起的微弱振动(Okada和Suto, 2003),包含体波和面波信号等成分,其中面波的能量占微动信号总能量的70%以上(Toksöz和Lacoss, 1968).研究表明,可以从微动信号中提取得到面波相速度或群速度频散信息,并使用它们对地下结构进行成像(Aki, 1957; Campillo和Paul, 2003).目前,从微动信号中提取面波频散信息的主要方法有:空间自相关法(Aki, 1957)、频率-波数法(Capon et al., 1969; Lacoss et al., 1969)、多道面波分析法(Park et al., 1998; 2007; 2008;Xia et al., 1997; 2000a)和τ-p变换法(McMechan和Yedlin, 1981)等.
利用微动信号提取面波频散信息反演地下S波速度结构的方法具有经济快捷、受场地限制小和环境无损等优点,被广泛应用于大尺度的地下结构探测和小尺度的工程勘探中.在大尺度的地下结构探测中,Shapiro等(2005)利用USArray台阵一个月的背景噪声信号进行了互相关计算并提取面波群速度信息,对美国加利福尼亚地区的地下结构进行了研究,成像结果显示速度差异明显,其中低速区域主要为沉积盆地,高速区域主要为山脉的火成岩地区;Yao等(2006)利用背景噪声信号计算经验格林函数,对青藏高原东南部的地下结构进行了成像,发现青藏高原东南部地壳和上地幔剪切波具有低速特点;Moschetti等(2007)使用USArray台阵28个月的背景噪声数据计算并提取出了周期8~40 s的瑞利波群速度频散曲线,并反映出美国西部地区地下速度异常,并且与已知地质信息相吻合;Zhao等(2016)使用密集的USArray台阵证明了利用背景噪声成像宽频带5~150 s瑞利波相速度的可行性.在小尺度的工程勘探应用方面,Liu等(2000)在加利福尼亚的两个地区分别利用微震台阵得到了百米深度范围的S波速度结构,并分别对比地区钻孔数据信息,结果显示微震台阵技术成像的速度结构与钻孔信息相吻合,表明该方法具有实际应用价值;何正勤等(2007)在北京地区多个场地进行微动台阵探测方法试验,探查了0~3 km深度的速度结构,验证了地脉动数据划分物性差异大的地层速度界面的有效性;徐佩芬等(2012)利用SPAC方法从微动数据中提取基阶频散曲线成像二维视速度剖面,并结合少量钻孔资料成功圈定出地下“孤石”,为工程提供了基岩面埋深和起伏信息.
目前大部分研究仅利用基阶频散信息进行结构反演,没有使用高阶频散信息.这是因为高阶振型面波能量小、振幅随周期变化大,传统方法不易提取出有效的高阶面波.同时,研究者发现各模态面波在不同频率范围内能量分布不同,当某一模态面波能量占主导时,其他模态面波则相对较弱(张碧星等, 1998; 王建楠, 2017),并且当存在低速层和速度突变时,频散曲线可能会出现“之”字形形态(鲁来玉等, 2006; 刘雪枫等, 2009)和频散曲线“交叉”现象(De Nil, 2005; Levshin和Panza, 2006; Boaga et al., 2013; 张凯等, 2016),使得高阶频散曲线提取更加困难,且无法准确判断频散曲线模态.
随着研究的深入,研究者们发现高阶模态频散曲线具有更大的穿透深度(Xia et al., 2000b; 2003;Luo et al., 2007),且对地层参数变化更敏感,若能够提取出准确有效的高阶模态频散曲线,并联合基阶进行反演,可以极大地降低反演的多解性,从而获得更加准确的地下速度结构(Xia et al., 1999; 罗银河等, 2008; Pan et al., 2018; 杨振涛等, 2019).因此,提取准确有效的高阶模态频散曲线是微动信号成像的焦点和难点.近期,Wang et al.(2019)提出了提取面波高阶频散曲线的新方法,F-J方法,并从理论公式推导和合成背景噪声数据方面验证了该方法的有效性.
本文首先简单介绍了F-J方法的理论和处理流程,然后使用该方法从上海市苏州河地区的微动信号中提取了高分辨率多模态瑞利波频散曲线,最后利用粒子群算法进行反演,获得了二维S波速度结构剖面.
1 频率-贝塞尔变换方法原理Wang等(2019)提出一种从微动信号中提取面波相速度频散曲线的新方法,频率-贝塞尔变换方法(F-J方法),并给出了F-J方法的详细理论推导过程和数值验证,本文仅对该方法做简单的介绍.
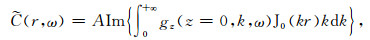
空间上位于x1、x2的任意两个观测台站记录的微动信号垂直分量的互相关正比于格林函数虚部(如Sánchez-Sesma和Campillo, 2006),将格林函数用水平层状半空间弹性介质各向同性源的格林函数计算公式表示(Chen, 1993, 1999; Hisada, 1994; Kennett, 1986),得:
|
(1) |
其中,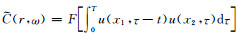

|
(2) |
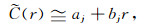
公式(2)左边可以通过计算直接得到,根据核函数的性质(如Kennett, 1986),当核函数趋于无穷大值时,该无穷大值就是频散曲线所对应的点,所以计算左部分提取最大值,便可以得到频散曲线.理论公式(2)左边中无限积分在实际计算中将转换为有限项的累加,将
|
(3) |
其中,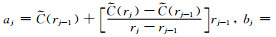

根据贝塞尔函数的递推性,
|
(4) |
最终可以得到:
|
(5) |
利用公式(5)对互相关谱在台站间距上进行线性插值,可以得到频率-相速度谱.
2 实例研究 2.1 测区概况为了验证F-J方法可以从城市微动信号中提取出对城市浅地表勘探有效的高阶频散信息,本研究对上海市苏州河地区开展了实地微动信号采集并进行处理.
研究区域苏州河地区位于上海市,长江三角洲东南前缘,地形平坦,地下结构以层状沉积为主,除少数基岩露头外,覆盖了巨厚的第四系松散沉积物,厚度可达200~300 m.苏州河地区属滨海平原,在深度范围3~20 m普遍分布淤泥质黏性土,呈流塑性,是主要的软弱层.随深度的增加依次分布,软塑性灰色黏性土、硬土层、密实粉性土粉砂互层和致密粉细砂层,受古河道影响局部范围存在灰色黏性土厚度增大、土性差异增大和硬土层缺失的情况.深部致密粉细砂层局部夹中粗砂,分布较为稳定.潜水层水位埋深一般为0.3~1.5 m,渗透性差,当场地大面积填土后水位上升.承压水不连续分布,水位低于潜水位,埋深约3~11 m.本次测区西南方向约200 m钻孔地质信息见表 1,测区南侧紧邻苏州河河道,北侧为城市公园,四周分布公路、居民区和工地等,微动信号震源复杂,且无明显方向性.
|
|
表 1 钻孔地质信息 Table 1 Geological information of borehole |
F-J方法对观测系统无特定排列要求,随机分布、线性排列等均适用.本次微动信号采集于2018年3月25日上午10—12点进行,沿绿化带边缘采用近线性排列观测系统,如图 1a所示,使用38台宽频带数字地震仪,测线总展布约100 m,道间距约2 m,采集频率200 Hz,静置采集1 h.

|
图 1 测区台站分布和微动记录图 (a)测区台站分布图; (b)测区8个台站预处理后的微动波形记录. Fig. 1 Nearly-linear observation array (a) and preprocessed microtremor recordings (b) |
对微动信号进行预处理,包括去除均值、去除线性趋势和带通滤波等,具体流程如图 2.图 1b给出了预处理后的8个台站的10 min微动波形记录.

|
图 2 F-J方法流程图 Fig. 2 Flowchart of the F-J method |
应用F-J方法从微动信号中提取频散曲线可分为三个步骤:(1)将记录按照一定窗长分成若干段,任意台站两两组合计算空间互相关系数得到互相关谱.窗长的选择需要保证微动信号在有效的频带范围内频谱基本一致,且能量稳定,满足时间、空间平稳随机的条件.本文将记录按照窗长30 s分成120段.(2)将所有的互相关谱进行叠加平均,随着叠加次数的增加可以快速提高后续积分成像的分辨率,但当叠加次数增加到一定程度后,分辨率的提高趋于平缓.(3)叠加后的互相关谱进行积分计算,得到频率-相速度谱,进而提取频散曲线.
F-J方法基于平层结构假设,但实际地层中无法严格满足该假设,因此计算结果包含地下结构的平均效应.台阵展布越小,越易满足完全水平层假设条件,同时展布的缩小会降低低频面波的成像效果和探测深度.本实验采用21个邻近台站为一组,分为18组(Arr.01—Arr.18),组1(Arr.01)包括台站ST.01—ST.21(见图 1),组2(Arr.02)包括台站ST.02—ST.22,依次类推.使用F-J方法对18组的城市微动数据进行处理,计算得到频率范围0~30 Hz、相速度范围50~450 m·s-1的频率-相速度谱.
图 3给出了SPAC方法和F-J方法计算的频率-相速度谱,通过对比可以发现:在低频区域(< 13 Hz)两种方法基阶频散曲线成像分辨率相差不大,但F-J方法在小于5 Hz部分频散曲线的宽度展布略大于SPAC法.频率13~25 Hz区域F-J方法具有更高的分辨率,SPAC法仅能成像一条高阶频散曲线且宽度展布模糊.在高频区域(25 Hz左右),SPAC方法有能量集中点,但最终未能形成连续频散曲线,F-J方法以高分辨率成像多条高模态频散曲线.图 3b中的点线是使用广义反射-透射法系数法(Chen, 1993; 何耀峰等, 2006)对该地区钻孔数据(表 1)建立的速度模型计算得到的基阶和1~7阶理论频散曲线.

|
图 3 频率-相速度谱 (a) SPAC法; (b) F-J方法(点线为钻孔数据理论频散曲线). Fig. 3 Frequency-phase velocity spectrograms (a) SPAC method; (b) F-J method (Dotted lines are theoretical dispersion curves by borehole information). |
图 4分别为组Arr.01—Arr.18的频率-相速度谱.低频部分(< 13 Hz),基阶频散曲线组间形态相似,与钻孔数据理论频散曲线相比无太大偏差.高频部分(>13 Hz),高阶模态频散曲线组间形态相差较大,在频率范围15~30 Hz,Arr.01—Arr.18组高阶频散曲线的模式融合逐渐分离.主要原因是,低频基阶模态与深部结构有关,深部地层一般分布较为稳定,高频高阶模态部分与浅层结构有关,城市浅层受到建筑垃圾、地下空间开发等人为影响结构错综复杂,因而频散曲线形态不同.基阶频散曲线的相似性也决定了仅使用基阶频散信息进行反演,会增强反演结果的多解性,加入多模态频散信息可以有效地约束反演结果.

|
图 4 Arr.01-Arr.18频率-相速度谱 点线为反演S波速度结构的理论频散曲线. Fig. 4 Frequecy-phase velocity spectrograms of Arr.01-Arr.18 Dotted line are dispersion curves calculated from inverted S-wave velocity. |
本节使用钻孔数据建立初始模型,联合基阶、高阶多模态的频散信息,利用粒子群算法对S波速度和层厚进行反演.在反演过程中,设定密度和P波速度已知.反演得到的S波速度结构的理论频散曲线(图 4中点线)和F-J方法计算的频散谱可以很好地吻合.将不同组得到的反演S波速度进行了Kriging插值,获得二维S波速度的剖面图(图 5).

|
图 5 S波速度剖面图 (a)钻孔S波速度模型; (b) F-J法S波速度剖面. Fig. 5 S-wave velocity profile (a) S-wave velocity model from borehole information (scale is on right); (b) S-wave velocity profile by the F-J method. |
结合钻孔数据岩性信息,可以将图 5中的速度剖面分为三层:(1)淤泥质黏土层:深度范围0~23 m,S波速度范围110~160 m·s-1,为表层软弱层,岩性较均匀.(2)粉质黏土层:深度范围23~55 m,S波速度范围220~290 m·s-1.该深度范围存在低速区(图 5中白色虚线框),本研究综合地质信息解释为古河道切割导致的地层缺失.(3)粉砂黏土层:深度范围大于55 m,S波速度范围300~500 m·s-1,随着深度的增加S波速度平稳增加,土层横向分布稳定且土质致密,可作为承压层.
3 结论本文使用F-J方法成功地从城市微动信号中提取出了高分辨率多模态瑞利波频散曲线,利用粒子群算法联合多模态频散曲线对浅地表的S波速度结构进行了成像,直观地显示了城市浅地表S波横向和纵向速度结构变化,揭示了局部地层中因古河道的切割造成的结构缺失.研究结果表明:F-J方法能够准确地提取多模态频散曲线,为反演计算增加约束信息,提高了反演过程的稳定性和反演结果的准确性.F-J方法对观测系统的布设要求低,而且需要台站的数量小,抗干扰能力强,适用于交通繁忙、建筑物密集、各种场源干扰严重的城区,在城市浅地表精细结构成像方面具有较好的应用前景.
Aki K. 1957. Space and time spectra of stationary stochastic waves, with special reference to microtremors. Bulletin of the Earthquake Research Institute Tokyo University, 35: 415-457. |
Boaga J, Cassiani G, Strobbia C L, et al. 2013. Mode misidentification in Rayleigh waves:ellipticity as a cause and a cure. Geophysics, 78(4): EN17-EN28. DOI:10.1190/geo2012-0194.1 |
Campillo M, Paul A. 2003. Long-range correlations in the diffuse seismic coda. Science, 299(5606): 547-549. DOI:10.1126/science.1078551 |
Capon J. 1969. High-resolution frequency-wavenumber spectrum analysis. Proceedings of the IEEE, 57(8): 1408-1418. DOI:10.1109/PROC.1969.7278 |
Chen X F. 1993. A systematic and efficient method of computing normal modes for multilayered half-space. Geophysical Journal International, 115(2): 391-409. DOI:10.1111/j.1365-246X.1993.tb01194.x |
Chen X F. 1999. Seismogram synthesis in multi-layered half-space Part I.Theoretical formulations. Earthquake Research in China, 13(2): 53-78. |
De Nil D. 2005. Characteristics of surface waves in media with significant vertical variations in elasto-dynamic properties. Journal of Environmental and Engineering Geophysics, 10(3): 263-274. DOI:10.2113/JEEG10.3.263 |
He Y F, Chen W T, Chen X F. 2006. Normal mode computation by the generalized reflection-transmission coefficient method in planar layered half space. Chinese J. Geophys. (in Chinese), 49(4): 1074-1081. DOI:10.3321/j.issn:0001-5733.2006.04.020 |
He Z Q, Ding Z F, Jia H, et al. 2007. To determine the velocity structure of shallow crust with surface wave information in microtremors. Chinese J. Geophys. (in Chinese), 50(2): 492-498. DOI:10.3321/j.issn:0001-5733.2007.02.021 |
Hisada Y. 1994. An efficient method for computing Green's functions for a layered half-space with sources and receivers at close depths. Bulletin of the Seismological Society of America, 84(5): 1456-1472. |
Lacoss R T, Kelly E J, Tokso z M N. 1969. Estimation of seismic noise structure using arrays. Geophysics, 34(1): 21-38. DOI:10.1190/1.1439995 |
Levshin A L, Panza G F. 2006. Caveats in multi-modal inversion of seismic surface wavefields. Pure and Applied Geophysics, 163(7): 1215-1233. DOI:10.1007/s00024-006-0069-3 |
Liu H P, Boore D M, Joyner W B, et al. 2000. Comparison of phase velocities from array measurements of Rayleigh waves associated with microtremor and results calculated from borehole shear-wave velocity profiles. Bulletin of the Seismological Society of America, 90(3): 666-678. DOI:10.1785/0119980186 |
Liu X F, Fan Y H, Chen X F. 2009. Research on the cross of the dispersion curves of Rayleigh waves and multi-modes coupling phenomenon. Chinese J. Geophys. (in Chinese), 52(9): 2302-2309. DOI:10.3969/j.issn.0001-5733.2009.09.014 |
Lu L Y, Zhang B X, Wang C H. 2006. Experiment and inversion studies on Rayleigh wave considering higher modes. Chinese J. Geophys. (in Chinese), 49(4): 1082-1091. DOI:10.3321/j.issn:0001-5733.2006.04.021 |
Luo Y H, Xia J H, Liu J P, et al. 2007. Joint inversion of high-frequency surface waves with fundamental and higher modes. Journal of Applied Geophysics, 62(4): 375-384. DOI:10.1016/j.jappgeo.2007.02.004 |
Luo Y H, Xia J H, Liu J P, et al. 2008. Joint inversion of fundamental and higher mode Rayleigh waves. Chinese J. Geophys. (in Chinese), 51(1): 242-249. DOI:10.3321/j.issn:0001-5733.2008.01.030 |
McMechan G A, Yedlin M J. 1981. Analysis of dispersive waves by wave field transformation. Geophysics, 46(6): 869-874. DOI:10.1190/1.1441225 |
Moschetti M P, Ritzwoller M H, Shapiro N M. 2007. Surface wave tomography of the western United States from ambient seismic noise:Rayleigh wave group velocity maps. Geochemistry, Geophysics, Geosystems, 8(8): Q08010. DOI:10.1029/2007GC001655 |
Okada H, translated by K. Suto. 2003. The microtremor survey method, geophysical monographseries No.12, SEG. 44-57. doi: 10.1190/1.9781560801740.
|
Pan L, Chen X F, Wang J N, et al. 2019. Sensitivity analysis of dispersion curves of Rayleigh waves with fundamental and higher modes. Geophysical Journal International, 216(2): 1276-1303. DOI:10.1093/gji/ggy479 |
Panza G F. 1986. Seismic wave propagation in stratified media. Geophysical Journal International, 86(1): 219-220. DOI:10.1111/j.1365-246X.1986.tb01087.x |
Park C B, Miller R D, Xia J H. 1998. Imaging dispersion curves of surface waves on multi-channel record.//68th Ann. Internat Mtg., Soc. Expi. Geophys.. Expanded Abstracts, 1377-1380, doi: 10.1190/1.1820161.
|
Park C B, Miller R D, Xia J H, et al. 2007. Multichannel analysis of surface waves (MASW)-Active and passive methods. The Leading Edge, 26(1): 60-64. DOI:10.1190/1.2431832 |
Park C B, Miller R D. 2008. Roadside passive multichannel analysis of surface waves (MASW). Journal of Environmental and Engineering Geophysics, 13(1): 1-11. DOI:10.2113/JEEG13.1.1 |
Sánchez-Sesma F J, Campillo M. 2006. Retrieval of the Green's function from cross correlation:the canonical elastic problem. Bulletin of the Seismological Society of America, 96(3): 1182-1191. DOI:10.1785/0120050181 |
Shapiro N M, Campillo M, Stehly L, et al. 2005. High-resolution surface-wave tomography from ambient seismic noise. Science, 307(5715): 1615-1618. DOI:10.1126/science.1108339 |
Toksöz M N, Lacoss R T. 1968. Microseisms:mode structure and sources. Science, 159(3817): 872-873. DOI:10.1126/science.159.3817.872 |
Wang J N, Wu G X, Chen X F. 2019. Frequency-Bessel transform method for effective imaging of higher-mode Rayleigh dispersion curves from ambient seismic noise data. Journal of Geophysical Research, 124(4): 3708-3723. DOI:10.1029/2018JB016595 |
Wang J N. 2019. Vector wavenumber transformation method to extract multimode dispersion curves from ambient seismic noise[Ph. D. thesis]. Hefei: University of Science and Technology of China.
|
Xia J H, Miller R D, Park C B. 1997. Estimation of shear wave velocity in a compressible Gibson half-space by inverting Rayleigh wave phase velocity.//67th Ann. Internat Mtg., Soc. Expi. Geophys.. Expanded Abstracts, 1719-1920, doi: 10.1190/1.1885816.
|
Xia J H, Miller R D, Park C B. 1999. Estimation of near-surface shear-wave velocity by inversion of Rayleigh waves. Geophysics, 64(3): 691-700. DOI:10.1190/1.1444578 |
Xia J H, Miller R D, Park C B, et al. 2000a. Comparing shear-wave velocity profiles from MASW with borehole measurements in unconsolidated sediments, Fraser River Delta, B. C., Canada. Journal of Environmental and Engineering Geophysics, 5(3): 1-13. DOI:10.4133/JEEG5.3.1 |
Xia J H, Miller R D, Park C B. 2000b. Advantages of calculating shear-wave velocity from surface waves with higher modes.//70th Ann. Internat Mtg., Soc. Expi. Geophys.. Expanded Abstracts, doi: 10.1190/1.1815633.
|
Xia J H, Miller R D, Park C B, et al. 2003. Inversion of high frequency surface waves with fundamental and higher modes. Journal of Applied Geophysics, 52(1): 45-57. DOI:10.1016/S0926-9851(02)00239-2 |
Xu P F, Shi W, Ling S Q, et al. 2012. Mapping spherically weathered "Boulders" using 2D microtremor profiling method:a case study along subway line 7 in Shenzhen. Chinese J. Geophys. (in Chinese), 55(6): 2120-2128. DOI:10.6038/j.issn.0001-5733.2012.06.034 |
Yang Z T, Chen X F, Pan L, et al. 2019. Multi-channel analysis of Rayleigh waves based on the Vector Wavenumber Tansformation Method (VWTM). Chinese J. Geophys. (in Chinese), 62(1): 298-305. DOI:10.6038/cjg2019M0641 |
Yao H J, van der Hilst R D, de Hoop M V. 2006. Surface-wave array tomography in SE Tibet from ambient seismic noise and two-station analysis-I. Phase velocity maps. Geophysical Journal International, 166(2): 732-744. DOI:10.1111/j.1365-246X.2006.03028.x |
Zhang B X, Lan C Q, Yu M, et al. 1998. Energy distribution of surface waves in stratified media. Acta Acustica (in Chinese), 23(2): 97-106. DOI:10.15949/j.cnki.0371-0025.1998.02.001 |
Zhang K, Zhang B W, Liu J X, et al. 2016. Analysis on the cross of Rayleigh-wave dispersion curves in viscoelastic layered media. Chinese J. Geophys. (in Chinese), 59(3): 972-980. DOI:10.6038/cjg20160319 |
Zhao K F, Luo Y H, Xie J. 2017. Broad-band Rayleigh wave phase velocity maps (10-150 s) across the United States from ambient noise data. Geophysical Journal International, 208(2): 1265-1275. DOI:10.1093/gji/ggw460 |
何耀锋, 陈蔚天, 陈晓非. 2006. 利用广义反射-透射系数方法求解含低速层水平层状介质模型中面波频散曲线问题. 地球物理学报, 49(4): 1074-1081. DOI:10.3321/j.issn:0001-5733.2006.04.020 |
何正勤, 丁志峰, 贾辉, 等. 2007. 用微动中的面波信息探测地壳浅部的速度结构. 地球物理学报, 50(2): 492-498. DOI:10.3321/j.issn:0001-5733.2007.02.021 |
刘雪峰, 凡友华, 陈晓非. 2009. Rayleigh波频散曲线"交叉"及多模式耦合作用研究. 地球物理学报, 52(9): 2302-2309. DOI:10.3969/J.issn.0001-5733.2009.09.014 |
鲁来玉, 张碧星, 汪承灏. 2006. 基于瑞利波高阶模式反演的实验研究. 地球物理学报, 49(4): 1082-1091. DOI:10.3321/j.issn:0001-5733.2006.04.021 |
罗银河, 夏江海, 刘江平, 等. 2008. 基阶与高阶瑞利波联合反演研究. 地球物理学报, 51(1): 242-249. DOI:10.3321/j.issn:0001-5733.2008.01.030 |
王建楠. 2019.背景噪音提取高阶频散曲线的矢量波数变换方法[博士论文].合肥: 中国科学技术大学.
|
徐佩芬, 侍文, 凌苏群, 等. 2012. 二维微动剖面探测"孤石":以深圳地铁7号线为例. 地球物理学报, 55(6): 2120-2128. DOI:10.6038/j.issn.0001-5733.2012.06.034 |
杨振涛, 陈晓非, 潘磊, 等. 2019. 基于矢量波数变换法(VWTM)的多道Rayleigh波分析方法. 地球物理学报, 62(1): 298-305. DOI:10.6038/cjg2019M0641 |
张碧星, 兰从庆, 喻明, 等. 1998. 分层介质中面波的能量分布. 声学学报, 23(2): 97-106. DOI:10.15949/j.cnki.0371-0025.1998.02.001 |
张凯, 张保卫, 刘建勋, 等. 2016. 层状黏弹性介质中Rayleigh波频散曲线"交叉"现象分析. 地球物理学报, 59(3): 972-980. DOI:10.6038/cjg20160319 |