 2019, Vol. 62


2018年9月28日10时2分(UTC)印尼苏拉威西岛发生了MW7.5地震, 并引发海啸.距离震中约80 km的帕卢市受灾严重.截至10月9日, 地震和海啸已造成2010人遇难, 近7万座房屋损毁, 数万人被迫撤离家园.根据美国地质调查局(United States Geological Survey, USGS)震源机制解快速测定结果, 此次地震是一次左旋走滑为主兼正断特性的破裂事件, 震中位于0.178°S, 119.840°E.地震发生在澳大利亚板块、巽他板块以及菲律宾板块交汇处, 震区构造活动强烈(图 1).印尼苏拉威西岛的地质条件十分复杂, 帕卢市所在的盆地是由帕卢—科罗断层长期左旋走滑活动形成的近南北向谷地, 盆地东缘与西缘均发育有活动断层(Bellier et al., 2010).

|
图 1 构造背景 (a)印尼苏拉威西岛周边主要板块和构造; (b) 2018年印尼帕卢地震的震源机制解和附近主要活动断裂, 红色五角星表示震中, 黄色五角星是MW6.1级前震震中; (c)帕卢湾近东西向地形剖面. Fig. 1 Tectonic setting of study area (a) Main plates and tectonics around Sulawesi, Indonesia; (b) Focal mechanism solutions of the 2018 Palu, Indonesia earthquake and major active faults in the vicinity of the event. The red pentagram represents the MW7.5 mainshock, and the yellow one is the MW6.1 foreshock; (c) Nearly east-west elevation profiles across Palu Gulf. |
地震发生之后, 快速确定地震震源破裂过程, 获取地震能量释放的空间分布情况, 对减轻地震灾害具有举足轻重的意义.目前研究震源破裂主要通过两种方法:有限断层反演(Kikuchi and Kanamori, 1991; Kikuchi et al., 1993)和反投影方法(Ishii et al., 2005; Ishii, 2011).以往, 震源破裂过程的反演主要依赖于地震波(Zhang et al., 2013, 2016), 随着空间大地测量技术的快速发展(Wang et al., 2011), 大地测量数据已被广泛地应用于震源破裂过程研究中(Yokota et al., 2011; Tan et al., 2015, 2017; Li et al., 2018).空间大地测量手段的引入, 为反演震源破裂过程提供了珍贵的近场观测数据(Wang et al., 2011; Xu et al., 2016; He et al., 2016).为了反演问题的稳定性, 往往对破裂速度和断层上破裂的传播提前做了相关假定(Kikuchi et al., 1993; Zhang et al., 2013, 2016; Li et al., 2018).虽然大地测量资料的加入提高了反演的效率, 但是对破裂速度的反演尚不能给出稳定的解(Li et al., 2018).地震观测资料和反演结果表明, 断层的破裂速度一般为剪切波速度的0.7~0.9倍, 约2.5~3.0 km·s-1, 但是对一些地震断层的破裂过程的研究表明, 有些条件下断层破裂的速度可能要超过剪切波速度(Heaton, 1990; Broberg, 1996), 例如1999年土耳其伊兹米特MW7.6地震(Bouchon et al., 2001), 2001年中国可可西里MW7.8地震(Robinson et al., 2006), 2002年美国阿拉斯加MW7.9地震(Walker and Shearer, 2009)等, 这些地震有一个共同的特点, 都以走滑破裂为主.研究表明, 当断层发生超剪切破裂时, 断层上的位错幅度、破裂产生的地震波速度及加速度都会显著增大, 从而造成地震灾害大大增加(王海云, 2010; 朱守彪等, 2017).
反投影方法具有结果稳定、定位精度高、计算速度块、不依赖高精度震中定位和其他先验信息, 例如破裂速度、断层几何等特征, 可以用来快速地估算破裂区域、破裂持续时间及破裂速度等运动学参数(Ishii et al., 2005; 张浩和盖增喜, 2012; Wang et al., 2016a, b).反投影方法不依赖于破裂速度等参数的假定, 为快速确定地震破裂速度, 研究超剪切破裂提供了稳定可靠的技术手段.
地震发生之后, IRIS(Incorporated Research Institutions for Seismology)利用反投影方法对此次印尼MW7.5地震破裂过程进行成像(https://www.iris.edu/).无论使用的是欧洲台网(EU)、澳大利亚台网(AU)还是全球地震台网(GSN), 参与计算的台站数量均未超过100个.AU台网成像结果比较粗糙,且同EU台网一样都存在破裂传播方向偏离断层走向的问题, GSN台网台站方位角覆盖范围广, 破裂成像花样虽同断层近似平行, 符合走滑型地震破裂特征, 但仍然比较扩散, 所以稍显粗糙.日本高密度台网Hi-net(High Sensitivity Seismograph Network)是一个覆盖日本全境的高质量、高密度的短周期高频地震台网, 台站均匀分布于日本整个境内, 台站间距约20 km(隗永刚和张爽, 2017), 为研究印尼帕卢地震震源破裂过程, 获取地震运动学参数提供了丰富的数据支持.
因此, 本文利用反投影方法和日本高密度台网Hi-net垂直分量P波资料对2018年9月20日印尼MW7.5地震震源破裂过程进行成像并研究分析震源破裂速度等运动学参数.
1 数据2018年印尼地震发生之后, 从日本NIED(National Research Institute for Earth Science and Disaster Resilience,http://www.bosai.go.jp)申请下载了Hi-net台网垂向分量P波资料.对数据进行带通滤波处理, 低频信号受散射和小规模各向异性的影响小, 相反, 高频数据的波长短, 容易受散射和小规模各项异性的影响而产生畸变(Walker and Shearer, 2009; Xu et al., 2009).考虑到P波的频率越高, 对地震破裂过程的破裂前缘的空间分辨率也就越高, 但是地震信号的频率越高, 不同台站同源信号之间的相似性越低(张浩, 2012), 综合考虑各方面的因素, 频率范围选择最佳频段0.2~1.0 Hz(Ishii et al., 2005).在该频段, 横向分辨率和波形连续性达到了获取最优震源影像的最佳平衡(张人鹏, 2014).参考台站YGDH位于台网中心(图 2b), 震中距为40.95°, PP与P的走时差为94.4 s, 考虑到PP震相可能对震源破裂成像造成干扰, 采用IASP91一维速度模型计算直达P波到时, 并以直达P波到时为参考时刻向前截取10 s, 向后截取90 s, 共计100 s的波形数据.由于地球介质的非均匀性, 直达P波的实际到时与理论到时存在偏差(Liu et al., 2017), 在去除信噪比较差的台站, 并对直达P波到时前5 s和后10 s共15 s的波形进行相关性检验, 相关系数约定为0.65, 利用互相关(Cross-Correlation)技术对直达P波到时进行校正, 去除相关性较差的台站后, 最终剩余568个台站的垂直分量波形, 如图 2所示, 台站震中距范围为33°~50°, 该范围内的地震波主要在介质相对均匀的下地幔中传播, 有效地弱化了地壳、上地幔和核幔边界物质不均匀性带来的影响, 方位角分布在14°~26°之间.由图 2c和图 2d可知波形具有较好的互相关性, 各波形的互相关系数主要集中在0.8~1.0之间.

|
图 2 观测数据 (a)日本台网Hi-net与2018年印尼MW7.5地震震中的相对位置示意图; (b)日本台网Hi-net中参与反投影分析的台站分布图; (c)台站观测波形的相关系数直方图; (d)经走时校正后的波形. Fig. 2 Observational data (a) Map view of the epicenter of the 2018 MW7.5 Palu earthquake and the Japanese Hi-net array; (b) Distribution of stations participating in back-projection imaging; (c) Histogram of correlation coefficients of observed waveforms of stations; (d) Waveforms after travel time correction. |
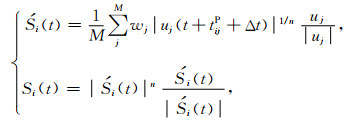
反投影方法是一种信号延时叠加方法, 其核心思想是把一次地震所释放的能量离散为许多子事件, 通过将震源区网格化, 把每个网格节点看作一次可能的破裂事件, 计算网格点到台网各台站的P波理论走时, 根据理论走时差将各个台站的地震波平移至网格点时间并叠加, 再以某一时间窗和某一滑动时间步长对叠加后的波形进行截取, 然后累加时间窗内的波形得到网格点不同时刻辐射的能量, 某一时刻能量最大的网格点便是破裂前缘(图 3).(1)式给出计算各子事件所辐射能量的叠加方法—N次方根叠加方法.

|
图 3 反投影方法示意图 Fig. 3 Schematic diagram of the back-projection method |
|
(1) |
其中, uj是第j个台站垂向波形记录, tijP为直达P波从第j个台站到第i个网格点的理论走时, Δt是第j个台站相对于参考台站的时间校正, 其目的是去除介质的不均匀性对理论到时的影响, wj是台站j的权重, M是参与计算的台站总数.当n=1时, (1)式为线性叠加.线性叠加不能提高信噪比, 而高阶方根叠加能削弱波形的尖峰或毛刺, 较好地增强信号能量并抑制噪声干扰(Xu et al., 2013).通常选用四阶方根叠加算法, 即n=4.本文对震源区进行网格化时, 震中119.840°E,0.178°S(USGS), 断层走向348°和震源深度12 km(GMCT), 沿走向和倾向分别以10 km为间隔设置33和21个格点(图 4a), 对568条波形记录采用7 s窗长1 s滑动窗和4阶方根叠加方法.

|
图 4 基于日本Hi-net台网数据的反投影分析结果 (a)地震破裂迁移及能量叠加图; (b)能量释放过程的空间迁移过程; (c)平均破裂传播速度; (d)震中附近S波传播速度; (e)叠加的能量释放值随时间变化曲线图. Fig. 4 Rupture process of the mainshock determined from back-projection of Hi-net data (a) Migration of seismic rupture and energy superposition. Dot size is proportional to the beamforming amplitude and color represents the time; (b) Time snapshots of seismic rupture; (c) Average rupture velocity; (d) One-dimensional S wave velocity near the epicenter; (e) Superposed energy release varying with time. |
本文利用反投影方法, 使用日本密集台网Hi-net远场垂直分量568条P波资料对2018年9月28日印尼帕卢MW7.5地震震源破裂过程进行成像, 结果如图 4所示.此次地震的能量释放主要集中在10~20 s之间, 破裂持续时间约47 s, 事实上在30 s后破裂释放的能量微乎其微(图 4e).此次破裂比较简单, 符合超剪切破裂特征, 有两个集中区(图 4a), 对应两个较大形变集中区(中国地震局地质研究所, 2018)和两个同震破裂滑动集中区(Okuwaki et al., 2018), 破裂峰值分别位于12 s和19 s, 最大能量释放区域位于震中南侧约0~50 km内, 另一破裂集中区位于震中南侧约70~100 km内, 该区域覆盖了印尼帕卢市(图 1), 位于帕卢盆地人口密集的帕卢市同时遭受地震和海啸的袭击, 是人员伤亡最多和财产损失最严重的区域.破裂主要向南侧延展(图 4b), 破裂总长度至少100 km(图 4a), 破裂速度很快达到超剪切破裂阈值, 平均破裂速度约4.1 km·s-1(图 4c), 根据Crust2.0(http://igppweb.ucsd.edu/~gabi/rem.html)得知震源区地壳内部S波传播速度范围1.0~4.0 km·s-1(图 4d), 表明此次地震属于一次超剪切破裂事件.同IRIS成像结果相比, Hi-net高密度台网的成像结果明显优于NA、AU和GSN台网, 能量辐射花样更为集中, 且两个破裂集中区并不在一条直线上, 同两个较大形变集中区和两个同震破裂滑动集中区具有很好的对应关系.
4 讨论与结论印尼帕卢地震发生后, Okuwaki等(2018)利用全球地震台网远场体波资料, 根据有限断层反演方法, 采用非线性反演算法, 在未对破裂速度做先验假定的情况下获得了此次地震震源破裂过程.结果显示破裂主要向南传播, 破裂总长度约150 km, 破裂明显出露地表, 有两个破裂集中区, 分别位于震中附近和震中南侧约80 km处, 最大滑动量位于震中附近, 约4 m.研究表明此次地震震源破裂传播速度≥4.0 km·s-1, 同本文结果相近.USGS(2018)利用有限断层反演方法研究此次地震震源破裂过程时, 根据余震分布和卫星影影像等资料, 以及破裂持续时间假定破裂传播速度约4.0 km·s-1.以上这些结果也都表明印尼帕卢MW7.5地震是一次超剪切破裂事件.
地质调查和GPS观测结果显示, 帕卢—科罗断层左旋走滑速率约35±8 mm·a-1, 且此前缺7级以上强震的历史记录(Bellier et al., 2010), 形变的长期积累为形成超剪切破裂提供了强大的动力支持.据USGS测定, 2018年9月28日6时59分59秒, 距印尼帕卢地震南侧约30 km处发生一次MW6.1的前震, 同主震具有类似的震源机制(图 1b), 该前震可能一定程度上触发了印尼帕卢MW7.5地震.另外, 发震断层帕卢—科罗断层特殊的空间几何特征或许也是能够形成超剪切破裂的基础(Dunham et al., 2003; Das, 2007; 袁杰和朱守彪, 2017; 朱守彪等, 2017).
据GCMT震源机制解结果可知此次地震是一次左旋走滑为主兼正断特性的破裂事件.帕卢盆地西缘断层并未发生地表破裂以及帕卢海湾西高东低的海底地形(图 1c)或许能解释帕卢湾西海岸遭受到的破坏弱于东侧的原因.帕卢地震发震断层的走向近北向, 此次地震表现一定的正断特性, 即下盘相对于上盘抬升, 靠近海湾的一盘抬升; 另外特殊的构造位置和地形条件也是造成此次地震海啸的主要原因之一:地震快速地左旋破裂滑动引起海水向南涌动, 狭长的帕卢湾(图 1)对振幅起到放大作用.此外, 超剪切破裂的破坏性强于同等震级的一般地震、印尼苏拉威西岛复杂的地质条件、地震破裂的不均一性及其可能诱发的海底滑坡或崩塌等地质灾害, 也可能导致帕卢湾海啸.
致谢 感谢日本防灾技术科学研究所(National Research Institute for Earth Science and Disaster Prevention, NIED)提供Hi-net台网的短周期高频地震波数据.本文使用了GMT(Wessel and Smith, 1995))进行制图, 在此表示感谢.本文使用到的反投影程序由中国地质大学王墩教授提供, 两位审稿专家对文章的改进提出了宝贵意见,在此一并表示感谢.
Bellier O, Sébrier M, Beaudouin T, et al. 2010. High slip rate for a low seismicity along the Palu-Koro active fault in central Sulawesi (Indonesia). Terra Nova, 13(6): 463-470. |
Bouchon M, Bouin M P, Karabulut H, et al. 2001. How fast is rupture during an earthquake? New insights from the 1999 Turkey earthquake. Geophysical Research Letters, 28(14): 2723-2726. DOI:10.1029/2001GL013112 |
Broberg K B. 1996. How fast can a crack go?. Materials Science, 32(1): 80-86. DOI:10.1007/BF02538928 |
Das S. 2007. The need to study speed. Science, 317(5840): 905-906. DOI:10.1126/science.1142143 |
Dunham E M, Favreau P, Carlson J M. 2003. A supershear transition mechanism for cracks. Science, 299(5612): 1557-1559. DOI:10.1126/science.1080650 |
He P, Wang Q, Ding K H, et al. 2016. Coseismic and postseismic slip ruptures for 2015 MW 6.4 Pishan earthquake constrained by static GPS solutions. Geodesy and Geodynamics, 7(5): 323-328. DOI:10.1016/j.geog.2016.07.004 |
Heaton T H. 1990. Evidence for and implications of self-healing pulses of slip in earthquake rupture. Physics of the Earth and Planetary Interiors, 64(1): 1-20. DOI:10.1016/0031-9201(90)90002-F |
Institute of Geophysics, China Earthquake Administration. 2018. http://www.eq-igl.ac.cn.
|
Ishii M, Shearer P M, Houston H, et al. 2005. Extent, duration and speed of the 2004 Sumatra-Andaman earthquake imaged by the Hi-Net array. Nature, 435(7044): 933-936. DOI:10.1038/nature03675 |
Ishii M. 2011. High-frequency rupture properties of the MW9.0 off the Pacific coast of Tohoku Earthquake. Earth, Planets and Space, 63: 609-614. DOI:10.5047/eps.2011.07.009 |
Kikuchi M, Kanamori H. 1991. Inversion of complex body waves-Ⅲ. Bulletin of the Seismological Society of America, 81(6): 2335-2350. |
Kikuchi M, Kanamori H, Satake K. 1993. Source complexity of the 1988 Armenian earthquake:evidence for a slow after-slip event. Journal of Geophysical Research:Solid Earth, 98(B9): 15797-15808. DOI:10.1029/93JB01568 |
Li Q, Tan K, Wang D Z, et al. 2018. Joint inversion of GNSS and teleseismic data for the rupture process of the 2017 MW6.5 Jiuzhaigou, China, earthquake. Journal of Seismology, 22(3): 805-814. DOI:10.1007/s10950-018-9733-1 |
Liu Z P, Song C, Meng L S, et al. 2017. Utilizing a 3D global P-wave tomography model to improve backprojection imaging:a case study of the 2015 Nepal earthquake. Bulletin of the Seismological Society of America, 107(5): 2459-2466. DOI:10.1785/0120170091 |
Okuwaki R, Yagi Y, Shimizu K. 2018. Rupture process of the 2018 Palu, Indonesia, earthquake. https://github.com/rokuwaki/2018PaluIndonesia.
|
Robinson D P, Brough C, Das S. 2006. The MW7.8, 2001 Kunlunshan earthquake:Extreme rupture speed variability and effect of fault geometry. Journal of Geophysical Research:Solid Earth, 111(B8): B08303. DOI:10.1029/2005JB004137 |
Tan H B, Wu G J, Xuan S B, et al. 2015. Wenchuan MS8.0 earthquake coseismic slip distribution inversion. Geodesy and Geodynamics, 6(3): 173-179. DOI:10.1016/j.geog.2015.05.001 |
Tan K, Zhang C H, Zhao B, et al. 2017. Multiplicity of solutions to geophysical inversion reflected by rupture slip distribution of the 2015 Nepal earthquake. Geodesy and Geodynamics, 8(1): 59-96. |
USGS. (2018-09-28). M7.5 -70 km N of Palu, Indonesia. https://earthquake.usgs.gov/earthquakes/eventpage/us1000h3p4/finite-fault.
|
Walker K T, Shearer P M. 2009. Illuminating the near-sonic rupture velocities of the intracontinental Kokoxili MW 7.9 strike-slip earthquakes with global P wave back projection imaging. Journal of Geophysical Research:Solid Earth, 114(B2): B02304. DOI:10.1029/2008JB005738 |
Wang D, Kawakatsu H, Mori J, et al. 2016a. Backprojection analyses from four regional arrays for rupture over a curved dipping fault:The MW7.7 24 September 2013 Pakistan earthquake. Journal of Geophysical Research:Solid Earth, 121(3): 1948-1961. DOI:10.1002/2015JB012168 |
Wang D, Mori J, Koketsu K. 2016b. Fast rupture propagation for large strike-slip earthquakes. Earth and Planetary Science Letters, 440: 115-126. DOI:10.1016/j.epsl.2016.02.022 |
Wang H Y. 2010. Prediction of acceleration field of the 14 April 2010 Yushu earthquake. Chinese Journal of Geophysics (in Chinese), 53(10): 2345-2354. DOI:10.3969/j.issn.0001-5733.2010.10.008 |
Wang Q, Qiao X J, Lan Q G, et al. 2011. Rupture of deep faults in the 2008 Wenchuan earthquake and uplift of the Longmen Shan. Nature Geoscience, 4(9): 634-640. DOI:10.1038/ngeo1210 |
Wei Y G, Zhang S. 2017. Design and location selection of Hi-net. Recent Developments in World Seismology (in Chinese), (2): 16-23. |
Wessel P, Smith W H F. 1995. New, improved version of genericmapping tools released. Eos, Transactions American Geophysical Union, 79(47): 579. |
Xu C J, Gong Z, Niu J M. 2016. Recent developments in seismological geodesy. Geodesy and Geodynamics, 7(3): 157-164. |
Xu Y, Koper K D, Sufri O, et al. 2013. Rupture imaging of the MW7.9 12 May 2008 Wenchuan earthquake from back projection of teleseismic P waves. Geochemistry, Geophysics, Geosystems, 10(4): Q04006. DOI:10.1029/2008GC002335 |
Yokota Y, Koketsu K, Fujii Y, et al. 2011. Joint inversion of strong motion, teleseismic, geodetic, and tsunami datasets for the rupture process of the 2011 Tohoku earthquake. Geophysical Research Letters, 38(7): L00G21. DOI:10.1029/2011GL050098 |
Yuan J, Zhu S B. 2017. Numerical simulation of seismic supershear rupture process facilitated by a fault stepover. Chinese Journal of Geophysics (in Chinese), 60(1): 212-224. DOI:10.6038/cjg20170118 |
Zhang H, Ge Z X. 2012. Rupture Imaging of the 2010 MW8.8 great Chilean earthquake using relative back-projection method. Acta Scientiarum Naturalium Universitatis Pekinensis (in Chinese), 48(4): 583-588. |
Zhang L F, Fatchurochman I, Liao W L, et al. 2013. Source rupture process inversion of the 2013 Lushan earthquake, China. Geodesy and Geodynamics, 4(2): 16-21. DOI:10.3724/SP.J.1246.2013.02016 |
Zhang L F, Li J G, Liao W L, et al. 2016. Source rupture process of the 2015 Gorkha, Nepal MW7.9 earthquake and its tectonic implications. Geodesy and Geodynamics, 7(2): 124-131. |
Zhang R P. 2014. Analysis of the Wenchuan earthquake source process[Master's thesis] (in Chinese). Chengdu: Chengdu University of Technology.
|
Zhu S B, Yuan J, Miao M. 2017. Dynamic mechanisms for supershear rupture processes of the Yushu earthquake (MS=7.1). Chinese Journal of Geophysics (in Chinese), 60(10): 3832-3843. DOI:10.6038/cjg20171013 |
王海云. 2010. 2010年4月14日玉树MS7.1地震加速度场预测. 地球物理学报, 53(10): 2345-2354. DOI:10.3969/j.issn.0001-5733.2010.10.008 |
隗永刚, 张爽. 2017. 日本Hi-net台网的台站选址与设计. 国际地震动态, (2): 16-23. DOI:10.3969/j.issn.0235-4975.2017.02.005 |
袁杰, 朱守彪. 2017. 断层阶区对产生超剪切地震破裂的促进作用. 地球物理学报, 60(1): 212-224. DOI:10.6038/cjg20170118 |
张浩, 盖增喜. 2012. 利用相对反投影方法对2010年MW8.8级智利地震破裂过程成像. 北京大学学报(自然科学版), 48(4): 583-588. |
张人鹏. 2014.汶川地震震源过程分析[硕士论文].成都: 成都理工大学
|
中国地震局地质研究所. 2018. http://www.eq-igl.ac.cn.
|
朱守彪, 袁杰, 缪淼. 2017. 青海玉树地震(MS=7.1)产生超剪切破裂过程的动力学机制研究. 地球物理学报, 60(10): 3832-3843. DOI:10.6038/cjg20171013 |