 2019, Vol. 62


2. 中国地震局地震观测与地球物理成像重点实验室, 北京 100081;
3. 中国地震局地壳应力研究所, 北京 100085
2. Key laboratory of Seismic Observation and Geophysical Imaging, Institute of Geophysics, China Earthquake Administration, Beijing 100081, China;
3. Institute of Crustal Dynamics, Earthquake Administration, Beijing 100085, China
中国内蒙古阿巴嘎地区位于中亚造山带(Central Asian Orogenic Belt, CAOB)东南部,与华北克拉通相邻,广泛发育早中生代陆内走滑断层和新生代玄武岩,自显生宙形成以来先后经历了古亚洲洋俯冲消减、陆陆板块碰撞以及碰后区域伸展等一系列地质构造过程,成为研究壳幔变形的理想场所(Guo et al., 2016; Jahn, 2004; Şengör et al., 1993; Wang et al., 2013; Webb and Johnson, 2006; Xiao et al., 2014)(图 1).

|
图 1 台站分布及研究区构造图 三角形表示地震台位置,其中不同颜色代表不同的数据起止时间.粉色不规则区域为新生代玄武岩(Guo et al., 2016),黑色实线为走滑断层(据Xiao et al., 2003; Xu et al., 2013),其中XHF为锡林浩特断层,LXF为林西断层,XMF为西拉木伦断层,BCF为巴彦敖包—赤峰断裂.左上角插图为研究区(绿色实线框)在大比例尺地图中的位置,其中CAOB为中亚造山带. Fig. 1 Location of the seismic stations involved in this study Colored triangles indicate the position of seismic stations for different observation periods. Active faults are represented by black solid lines (from Xiao et al., 2003; Xu et al., 2013) and pink area denotes the distribution of the Cenozoic basalts (Guo et al., 2016). Top left shows the study area on a large scale, in which the green solid rectangle outlines the study area. Abbreviations on the map are as follows: XHF, Xilinhot Fault; LXF, Linxi Fault; XMF, Xilamulun Fault; BCF, Bayan Obo-Chifeng Fault; CAOB, Central Asian Orogenic Belt. |
前人提出多种模型来解释CAOB东南部构造与演化过程:(1)多地块融合模式(Windley et al., 2007; Xiao et al., 2003);(2)弧形造山带和走滑断层模型(Şengör et al., 1993);(3)加里东复合大陆模型(Kheraskova et al., 2003).然而这些模型在诸多方面还存在争议,例如板块俯冲和增生的极性,以及板块最终碰撞的地点等.这些科学问题悬而未决的原因之一是研究区深部结构研究不足.通过计算兴蒙造山带地壳厚度和波速比,危自根等(2011)发现索伦缝合带东部附近波速比波动较小,而地壳厚度变形相对强烈;在索伦缝合带西部,龚辰等(2016)的接收函数研究同样也发现索伦带莫霍面存在横向急剧变化,与两侧构造带莫霍面特征存在差异.深地震反射研究发现索伦带莫霍面不连续,且上覆地壳倾向南北不一(Zhang et al., 2014).不同的壳幔结构会反映出不同的变形特征,因此查明壳幔变形机制对于清楚认识阿巴嘎地区深部结构将十分有益.另一方面,利用同期数据,强正阳和吴庆举(2019)使用远震剪切波分裂方法测量了上地幔各向异性,认为上地幔变形主要受到断裂控制,与相邻蒙古和华北克拉通明显不同.那么,地壳的变形也会受断裂的影响吗,壳幔变形模式是否一致?远震剪切波分裂反映的是整个射线路径上各向异性的累加,垂向分辨率差.如果能明确确定地壳各向异性的深度信息,则有助于我们在不同分辨深度上了解研究区壳幔变形特征,揭示壳幔变形机制,进而为阿巴嘎地区乃至整个中亚造山带深部构造与动力学过程研究提供重要参考.
地震波方位各向异性是研究地球介质变形的最为有效的手段之一(例如, Chen et al., 2013; Savage, 1999; Silver and Chan, 1991; 郑斯华和高原, 1994; 石玉涛等, 2006).其中,各向异性方向反映台站下方介质的变形方向,延迟时间则表示变形的强弱程度和累计厚度.对于地壳而言,断裂和区域应力被认为是控制地壳变形的两个主要因素(Boness and Zoback, 2006; 太龄雪等, 2015).在本研究中,若上地壳各向异性快波方向与最大水平压应力方向平行,或是下地壳各向异性快波方向与最大水平压应力方向垂直,那么说明区域应力是控制地壳变形的主要因素(例如, Yang et al., 2011; 张辉等, 2012); 若各向异性快波方向与断裂带走向平行,那么说明地壳变形主要由断裂控制(Balfour et al., 2005)(例如, 徐震等, 2006; 孙长青等, 2013).此外,通过对比地壳和上地幔各向异性,可以判定壳幔变形是否一致(例如, Wang et al., 2008; 高原等, 2010; 韩明等, 2017),从而更加细致准确地刻画研究区的壳幔变形特征.
1 数据与方法本研究所用数据包括中国地震局地球物理研究所于2012年10月至2015年07月在内蒙阿巴嘎地区陆续布设的36套宽频带地震台(NM台阵)以及中国数字地震台网HHC和XLT固定台2009年4月至2015年6月所记录的数据(台站位置见图 1).依照美国地质调查局(USGS)发布的地震目录,我们截选震中距30°~95°,震级5.5级以上的远震事件,并对数据进行去倾斜、去均值、重采样和带通滤波(0.05~2 Hz)预处理,最终挑选出P波清晰、三分量齐全的地震事件,使用时间域反褶积方法(Ligorría and Ammon, 1999),选取高斯系数1.0计算P波接收函数.其中,在NM台阵共挑选出435个远震事件,在XLT和HHC台站挑选出595个远震事件(图 2).为了提高接收函数的信噪比,消除地震事件分布不均匀的影响,我们将所得接收函数按照每5°后方位角进行叠加处理.

|
图 2 地震事件震中分布图 (a) NM流动台站所用地震事件;(b) XLT和HHC固定台所用地震事件. Fig. 2 Spatial distribution map of earthquakes used in this study (a) Teleseismic event used in NM array; (b) Teleseismic event used in XLT and HHC stations. |
前人研究显示(例如, Liu and Niu, 2012; Rümpker et al., 2014),单层水平对称轴各向异性介质接收函数Pms到时可以近似表达为
|
(1) |
其中,t0为各向同性介质Pms震相到时,δt是各向异性介质所引起的时差,ψ为接收函数的后方位角,φ是各向异性快波方向.对于已知各向异性模型,利用式(1)就可以预测出该模型所对应的接收函数Pms到时(图 3a).

|
图 3 模型Ⅰ(表 1)理论接收函数及AWST结果 (a)接收函数径向分量(RRF).黑色虚线标明模型I所预测的Pms震相π周期到时特征; (b) AWST(k=1)计算结果; (c)接收函数切向分量(TRF).绿色十字标明了极性反转的位置; (d) AWST(k=2)计算结果,其中绿色十字分别标明了各向异性顶层和底层所对应的最大叠加振幅和最小叠加振幅,指示各向异性快波方向. Fig. 3 Synthetic receiver functions for model Ⅰ (Table 1) and AWST result (a) The radial component of the receiving function (RRF). The dashed black line marks the arrival of the Pms phase with π periodicity caused by the anisotropic layer; (b) AWST result with k=1; (c) The tangent component of the receiving function (TRF). The green crosses indicate the azimuth of the polarity reversal; (d) AWST result with k=2. The green crosses indicate the azimuth of the maximum stacking amplitude from the upper interface and minimum amplitude from lower interface, which correspond to the FD of the anisotropic layer. |
|
|
表 1 单层水平对称轴各向异性介质(Model Ⅰ)速度模型 Table 1 Velocity models of single horizontal symmetry axis anisotropy layer (Model Ⅰ) |
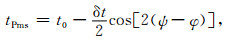
对于单层倾斜对称轴各向异性介质,Pms震相到时表达式为

|
(2) |
同样,式(2)所预测的Pms到时与实际接收函数具有很好的一致性(图 4a).因此,我们便可以利用实际测量到的Pms到时,使用最小二乘方法拟合理论Pms到时曲线,求取δt和φ.

|
图 4 模型Ⅱ(表 2)理论接收函数及AWST结果 (a)接收函数径向分量.黑色虚线标明Pms震相2π周期到时特征; (b) AWST(k=1)计算结果,其中绿色十字分别标明了各向异性层位所对应的最大叠加振幅和最小叠加振幅,指示各向异性快波方向; (c)接收函数切向分量.绿色十字标明了极性反转的位置; (d) AWST(k=2)计算结果,其余同(b). Fig. 4 Synthetic receiver functions for model Ⅱ (Table 2) and AWST results (a) RRFs. The dashed black line marks the arrival of the Pms phase with 2π periodicity caused by the anisotropic layer; (b) AWST result with k=1. The green crosses indicate the azimuth of the maximum stacking amplitude from the upper interface and minimum amplitude from lower interface, which correspond to the FD of the anisotropic layer; (c) TRFs. The green crosses indicate the azimuth of the polarity reversal. (d)Same as (b) except for k=2. |
|
|
表 2 单层倾斜对称轴各向异性介质(Model Ⅱ)速度模型 Table 2 Velocity models of single titled symmetry axis anisotropy layer (Model Ⅱ) |
另一方面,前人研究表明接收函数切向分量(TRFs)中也携带各向异性信息(例如, 田宝峰等, 2008; 齐少华等, 2016).我们注意到,在图 3c和图 4c中,TRFs分别呈现出π和2π周期性,并且极性反转所对应的后方位角指示了各向异性快波方向.但是限于实际资料所使用的地震数据大多来源于流动台站,信噪比不高,事件后方位角覆盖不均匀,无法直接从TRFs中获取各向异性信息.因此,我们拟利用接收函数切向分量方位加权叠加方法(Azimuth-Weighted Stacking of Transverse RFs, AWST)测量各向异性参数,进而为径向Pms结果提供佐证(例如, Shen et al., 2015).在本次研究中,当Pms到时信息和AWST结果相差不超过20°时,我们判定两种方法所得结果一致性较好,结果可靠;而当Pms到时信息和AWST结果超过20°时,判定两种方法所得结果不一致,所得测量结果将被谨慎对待.
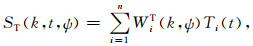
Girardin和Farra(1998)提出AWST表达式为
|
(3) |
其中,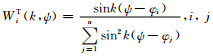
我们使用Frederiksen和Bostock (2000)编写的RAYSUM程序模型接收函数进行正演计算.图 3b和图 3d分别展示了当k=1和k=2时,模型I接收函数的AWST计算结果.在相同比例尺下,k=1所得AWST能量极其微弱,而k=2所得AWST则在各向异性层顶部和底部分别显示最大能量和最小能量,所对应的后方位角度为80°.然而在图 4b和图 4d中,无论是k=1或k=2,AWST结果都可以在各向异性层顶底部显示出最大和最小能量,它们所对应的后方位角指示模型II中各向异性快波方向.可见,当调谐数k=2时,AWST可以同时识别水平或倾斜对称轴各向异性介质的快波方向,这也得到了前人研究结果的印证(例如, Girardin and Farra, 1998; Vinnik et al., 2012).因此,本研究中,使用调谐数k=2计算AWST.值得注意的是,AWST结果中各向异性层顶底部显示出的最大和最小能量是对称出现的,即对应相同的后方位角度.但是限于真实地震资料的信噪比或是地质结构复杂性,最大和最小能量可能会出现不一致的情况.在这种情况下,我们通常认为能量最强的信号所对应的后方位角为各向异性快波方向.
需要说明的是,前人理论地震图研究表明(例如, Levin and Park, 1997; 徐震等, 2006; 房立华和吴建平, 2009),由于倾斜界面导致Pms震相到时依赖于事件方位角,其与地壳各向异性都可以使接收函数径向和切向呈现周期性变化.但是考虑到本研究中,各个台站接收函数Pms到时比较一致(平均4.99 s±0.27 s)(何静等, 2018), 整个研究区出现地壳倾斜界面的可能性比较小,大部分台站Pms到时的周期性变化主要还是由于地壳中存在各向异性.
综上,本研究计算地壳各向异性的具体思路是,首先我们通过拟合接收函数Pms到时得到各向异性参数;其次鉴于实际地震资料,尤其是流动台站,资料信噪比低、各向异性介质复杂的特点,我们通过计算AWST验证所得到的各向异性参数,确保计算结果的可靠性.相较于传统利用Pms震相分裂求取地壳各向异性参数的方法(例如, 强正阳等, 2016;谢振新等, 2017),本文使用的方法克服了单个地震事件计算结果的离散型,更好地获得了完整地壳的各向异性信息.
2 结果按照前文所述方法,我们展示以下4个具有代表性台站的地壳各向异性分析结果.在NM24台站,我们挑选出152对接收函数,按照每5°后方位角叠加,共计得到29对叠加后的接收函数.接收函数R分量显示(图 5a),Pms震相出现在4.8 s左右,表现出了明显的π周期到时特征(图 5b),暗示地壳内存在水平对称轴各向异性.接收函数T分量极性变化不明显,隐约出现在130°左右(图 5c).图 5d中AWST结果显示最大叠加振幅和最小叠加振幅分别出现在约4 s和约5.5 s,并同时指向120°的事件后方位角.我们使用式(1)来拟合以π为周期Pms到时,各向异性模型所预测的和实际测量的Pms到时之间残差的平方范数Resnorm为0.64,得到δt为0.30 s, φ为N122°E,与AWST得到的快波方向一致.

|
图 5 NM24台站接收函数和AWST结果 (a)接收函数R分量.绿色小十字标明了Pms到时,黑色虚线是各向异性模型所预测的Pms到时; (b)接收函数R分量局部放大展示; (c)接收函数T分量.黑色虚线为Pms平均到时,绿色大十字所对应的后方位角与(d)一致,标明T分量极性反转的位置,指示各向异性快波方向; (d) AWST(k=2)计算结果,绿色大十字分别标明了各向异性层位所对应的最大叠加振幅和最小叠加振幅,指示各向异性快波方向.台站名(Station),各向异性快波方向(φ), 延迟时间(δt),以及各向异性模型所预测的和实际测量的Pms到时之间残差的平方范数(Resnorm)都被展示. Fig. 5 Observed receiver functions and AWST result of station NM24 (a) RRFs. Small green cross on each of trace indicates the Pms arrivals. The dashed black curve is obtained by fitting Pms arrivals predicted by anisotropic model; (b) Zoomed-in RRFs in a local time window to have a clear view of the variation of the Pms arrivals; (c) TRFs. Dashed line marks the average time of Pms arrival. Large green crosses indicate the fast direction of anisotropic layer determined by AWST part in Fig. 5d; (d) AWST part with k=2. Dashed line marks the average time of Pms arrival. Large green crosses mark the max/min stacking amplitude from the upper/lower interface, indicating the fast direction of anisotropic layer. Station name, fast direction (φ), delay time (δt), and squared norm of the residual between measured and predicted Pms arrivals (Resnorm) are also listed. |
在HHC台站挑选出522对接收函数,按照每5°后方位角叠加,共计得到39对叠加后的接收函数.与台站NM24类似,HHC台站Pms震相也表现出了明显的π周期到时特征(图 6a和图 6b),拟合结果与AWST最大叠加振幅得到的快波方向相差约19°(图 6d);δt为1.24 s,是本研究中唯一一个超过1 s的台站.

|
图 6 HHC台站接收函数和AWST结果 图例同图 5,但是表现出较大Pms延迟时间δt.图c中接收函数切向分量Pms到时用绿色小十字标出. Fig. 6 Same as Fig. 5 except for station HHC and with an extraordinarily large δt; (c) Small green cross on each of TRF trace indicates the Pms arrivals. |
与本研究绝大多数台站相同,NM09台站Pms震相出现在5 s左右(图 7a),其到时表现出π周期特征(图 7b).虽然叠加后的接收函数数量较少,接收函数T分量观察不到明显极性变化(图 7c),但是式(1)拟合结果较好,Resnorm仅为0.33,δt为0.92 s,φ为N169°E.值得注意的是,式(1)拟合结果与AWST得到的N30°E快波方向偏差较大(图 7d).为了验证AWST计算的快波方向,我们按照N30°E拟合Pms到时,结果与实际值趋势明显不符(图 7d).推测可能是该区域各向异性结构的复杂性造成的.在这种情况下,接收函数R分量可靠性要优于T分量,所以使用R分量Pms到时拟合结果作为最终各向异性计算结果.类似的情况还出现在NM12台站.

|
图 7 NM09台站接收函数和AWST结果 青色虚线表示AWST结果(φ=30°)预测的Pms到时,图例同图 5. Fig. 7 Same as Fig. 5 except for station NM09 and with a cyan dashed line predicted by AWST result (φ=30°) |
NM04台站共计得到24对叠加后的接收函数,Pms震相出现在5 s左右,表现出了明显的π周期到时特征(图 8a和图 8b),暗示地壳内存在倾斜对称轴各向异性.因此使用式(2)拟合Pms到时,得到Resnorm为0.64,δt和φ分别为0.90 s和143°.AWST结果显示最大叠加振幅和最小叠加振幅同时指向140°的事件后方位角,与我们拟合结果一致.有意思的是,NM04也是本研究中唯一一个Pms到时具有π周期到时特征的台站.

|
图 8 NM04台站接收函数和AWST结果(Pms到时具有2π周期.图例同图 5) Fig. 8 Same as Fig. 5 except for station NM04 and Pms phase with 2π periodicity |
对所有38个台站的接收函数进行了如上类似分析,除去其中5个台站(NM02,NM20,NM28,NM30和NM31)由于仪器故障所得接收函数数量偏少,4个台站(NM03,NM06,NM15,NM27)Pms震相与其他Ps震相混合在一起,无法有效识别,2个台站(NM18,NM23)Pms到时不随事件后方位角变化(Pms到时标准差分别为0.14 s和0.17 s),我们在其余27个台站获得了地壳各向异性参数(表 3).总体上,δt变化范围在0.18~1.24 s之间,平均0.45 s±0.26 s(图 9a).其中,在0.6~1.0 s之间的有4个台站(NM04,NM09,NM35和NM38),分布在索伦缝合带周边;其余24个台站,δt变化范围在0.18~0.58 s,平均0.35 s±0.10 s.如果考虑单层各向异性模型,假设S波速度为3.3 km·s-1,各向异性程度在6%~14%之间,那么0.35 s所对应的各向异性层厚约为8.3~19.3 km (例如,Silver and Chan, 1991).各向异性快波方向从N95°E到N180°E之间变化,平均值为N130.6°E±19.1°(图 9b).
|
|
表 3 研究区各个台站地壳各向异性测量结果 Table 3 The crustal anisotropy measurements for stations beneath study area |

|
图 9 (a) 延迟时间δt和(b)快波方向φ柱状统计图 Fig. 9 Histograms of (a) delay times and (b) fast directions |
我们注意到,部分台站计算得到的Pms延迟时间大于0.6 s(HHC,NM04,NM09,NM35和NM38)(图 10),远高于地壳各向异性延迟时间上限0.3 s(Savage, 1999).前人研究表明,在利用远震P波接收函数计算台站下方的地壳各向异性时,介质中的倾斜界面会显著增强时间延迟(王琼等, 2016).另一方面,深地震反射研究发现索伦带莫霍面不连续、上覆地壳倾向杂乱,与岩石圈后期伸展地幔物质侵入有关(Zhang et al., 2014).考虑到这些台站散落在索伦缝合带周边,很可能没有或不完全受到地幔岩浆热侵蚀而保留了地壳残存的倾斜界面.综上所述,索伦带周围局部地壳残存的倾斜界面是造成部分台站测量到如此之大的Pms延迟时间的原因.虽然前人利用Pms在接收函数径向和切向分量的到时差成功区分了倾斜界面和各向异性对δt的影响(张建利等,2012),但是由于本研究主要利用流动台站资料,致使切向分量Pms震相无法清晰追踪.考虑到HHC固定台观测时间较长、δt较大,因此我们对比了该台站径向和切向Pms到时差异(图 6a和图 6c):在后方位角大于100°的地震事件中,RRF和TRF的Pms到时比较一致;而对于后方位角小于100°的地震事件,Pms到时则存在较大差异.这表明HHC台站所得δt同时受到了各向异性介质和地壳中横向非均匀结构(例如倾斜界面)的影响.但是,这些横向非均匀结构在我们的测量中究竟贡献了多少Pms时间延迟,以及它们的空间几何展布等科学问题,还需更深入的研究.此外,本研究中使用了低通高斯滤波器(高斯系数1.0)来计算接收函数,与近场S波频率范围差异也有可能是造成延迟时间明显高于前人的原因(例如,Huang et al., 2017; Wirth and Long, 2010).

|
图 10 研究区各向异性快波方向与(a)区域主压应力(Heidbach et al., 2010)和(b)Pn各向异性(Pei et al., 2007)对比图 Fig. 10 Average splitting measurements compare to (a) regional compressive stress (Heidbach et al., 2010) and (b) Pn anisotropy (Pei et al., 2007) |
地壳各向异性成因复杂,具有多种可能性.脆性上地壳广泛存在含水微裂隙与孔隙,它们在应力作用下定向排列形成各向异性,方向与裂隙走向或是最大主压应力方向近似一致(Crampin and Peacock, 2008).在图 10a中,我们对比了地壳各向异性和区域最大水平压应力方向,发现震源机制解反演得到的最大水平压应力方向为ENE-WSW (Heidbach et al., 2010),与本研究所得大部分地壳各向异性方向高角度正交,不支持含水微裂隙是地壳各向异性的主要成因.此外,地壳平均延迟时间0.35 s所对应的各向异性层厚约为8.3~19.3 km,远超过上地壳层厚,也说明仅凭上地壳含水微裂隙是无法产生如此强烈的各向异性,部分各向异性一定存在于中下地壳.另一方面,前人在研究区南部附近ZJK台站利用近场S波测量到地壳各向异性强度平均为约2.62 ms·km-1 (吴晶等, 2007; 赵博等, 2011),假设地壳厚度为45 km,那么大约对应0.12 s时间延迟.然而在本研究中,除去上述6个台站,在其余24个台站得到平均延迟时间为0.35 s,明显大于前人研究结果.这种差异可能是由于上下地壳各向异性强弱所产生,暗示地壳各向异性主要集中在中下地壳.随着深度增加围压增大,中下地壳中裂隙趋于闭合,角闪石等各向异性矿物优势晶格的定向排列成为各向异性的主要来源(Ko and Jung, 2015; Tatham et al., 2008).研究区中下地壳在ENE-WSW向压应力的作用下会产生NNE-SSW向各向异性,与我们测量结果基本一致(除去NM12、NM25和NM26),说明研究区地壳各向异性主要受到区域应力控制.同时,我们也不排除中下地壳因深部板块运动而导致矿物被挤压变形的可能性.
虽然研究区走滑断层广泛发育,例如右旋走滑的西拉木伦断裂和巴彦敖包—赤峰断层,但是断层附近台站的各向异性并没有与断层走向表现出任何相关性(图 10).例如NM14号台站位于锡林浩特断裂附近,各向异性方向为N129°E,与ENE- WSW断裂走向高角度正交,暗示研究区地壳各向异性不受到断裂控制.
3.3 壳幔耦合关系壳幔耦合与否取决于地壳和上地幔变形场是否一致.如果壳幔解耦,那么相较上地幔而言,下地壳强度较弱,且通常具有高地热梯度、低黏度等特性,在构造应力作用下易发生蠕变,因此地壳变形场无法有效传递到上地幔(例如, Flesch et al., 2005; Meissner et al., 2002).Pn波各向异性反映上地幔顶部介质变形特征,与其上覆下地壳可能具有相同各向异性成因,因此两者之间的比较可以为我们研究壳幔耦合关系提供线索.Pei等(2007)研究结果显示,Pn各向异性在研究区北部表现为NW-SE向;而在研究区中部至南部,Pn各向异性从W-E向逐渐变为NE-SW向.从图 10b中可以看出,在研究区林西断裂以北区域,Pn各向异性和地壳各向异性方向比较一致.如果这一区域壳幔变形是耦合的,那么上地幔物质在同一变形场作用下也应该和地壳具有相同的各向异性方向.但是,远震剪切波分裂结果在整个华北块体以北区域一致朝向ENE-WSW(强正阳和吴庆举, 2019),与地壳各向异性方向显示出了较大差异(除去NM24和NM25)(图 11).因此,在研究区华北克拉通以北区域,壳幔变形是解耦的.在林西断裂以南区域,Pn各向异性和地壳各向异性方向具有较大差异.虽然位于研究区华北块体内的三个台站(NM29,NM32和HHC),地壳和上地幔各向异性都一致朝向NW-SE,但是由于两者各向异性成因机制的不同,即地壳各向异性是受区域应力控制,而华北克拉通上地幔各向异性是残存在岩石圈内的化石各向异性(强正阳和吴庆举, 2019).因此,这一区域壳幔也是解耦变形.

|
图 11 Pms各向异性和XKS分裂结果叠加地壳厚度图 短黑色和玫红色短棒分别为本研究所得地壳各向异性结果和前人XKS分裂结果(Liu et al., 2008; 常利军等, 2009; 强正阳和吴庆举, 2019).底图为研究区地壳厚度(何静等, 2018). Fig. 11 Pms anisotropy and XKS splitting measurements superimposed on a map of average crustal velocity ratio Black and rose bars represent the crustal anisotropy measured by this study and XKS splitting results measured by previous studies(Liu et al., 2008; Chang et al., 2009; Qiang and Wu, 2019), respectively. Base map shows the crustal thickness values obtained from RFs analysis (He et al., 2018). |
通过计算位于内蒙古阿巴嘎地区27个流动地震台站接收函数Pms到时信息和AWST结果,分析了该区域地壳变形特征.结果表明,研究区地壳各向异性主要集中在中下地壳,绝大多数台站Pms延迟时间在0.35 s左右,快波方向为NW-SE向.地壳变形主要受到ENE-WSW向区域主压应力控制,与上地幔断裂控制的变形机制不同,暗示壳幔存在解耦变形.在索伦缝合带周边,地壳保留了部分地幔热侵蚀残存的倾斜界面,推测可能是导致部分台站具有较大Pms时间延迟的主要原因.
致谢 感谢参与台站勘选、架设和维护的所有人员.感谢两位匿名审稿专家提出的宝贵意见.文章部分图件使用GMT程序绘制(Wessel and Smith, 1998).
Balfour N J, Savage M K, Townend J. 2005. Stress and crustal anisotropy in Marlborough, New Zealand:evidence for low fault strength and structure-controlled anisotropy. Geophysical Journal International, 163(3): 1073-1086. DOI:10.1111/j.1365-246X.2005.02783.x |
Boness N L, Zoback M D. 2006. Mapping stress and structurally controlled crustal shear velocity anisotropy in California. Geology, 34(10): 825-828. DOI:10.1130/G22309.1 |
Chang L J, Wang C Y, Ding Z F. 2009. Seismic anisotropy of upper mantle in eastern China. Science in China Series D:Earth Sciences, 52(6): 774-783. DOI:10.1007/s11430-009-0073-4 |
Chen Y, Zhang Z J, Sun C Q, et al. 2013. Crustal anisotropy from Moho converted Ps wave splitting analysis and geodynamic implications beneath the eastern margin of Tibet and surrounding regions. Gondwana Research, 24(3-4): 946-957. DOI:10.1016/j.gr.2012.04.003 |
Crampin S, Peacock S. 2008. A review of the current understanding of seismic shear-wave splitting in the Earth's crust and common fallacies in interpretation. Wave Motion, 45(6): 675-722. DOI:10.1016/j.wavemoti.2008.01.003 |
Fang L H, Wu J P. 2009. Effects of dipping boundaries and anisotropic media on receiver functions. Progress in Geophysics (in Chinese), 24(1): 42-50. |
Flesch L M, Holt W E, Silver P G, et al. 2005. Constraining the extent of crust-mantle coupling in central Asia using GPS, geologic, and shear wave splitting data. Earth and Planetary Science Letters, 238(1-2): 248-268. DOI:10.1016/j.epsl.2005.06.023 |
Frederiksen A W, Bostock M G. 2000. Modelling teleseismic waves in dipping anisotropic structures. Geophysical Journal International, 141(2): 401-412. DOI:10.1046/j.1365-246x.2000.00090.x |
Gao Y, Wu J, Yi G X, et al. 2010. Crust-mantle coupling in North China:Preliminary analysis from seismic anisotropy. Chinese Science Bulletin, 55(31): 3599-3605. DOI:10.1007/s11434-010-4135-y |
Girardin N, Farra V. 1998. Azimuthal anisotropy in the upper mantle from observations of P-to-S converted phases:application to southeast Australia. Geophysical Journal International, 133(3): 615-629. DOI:10.1046/j.1365-246X.1998.00525.x |
Gong C, Li Q S, Ye Z, et al. 2016. Crustal thickness and Poisson ratio beneath the Huailai-Bayinonder profile derived from teleseismic receiver functions. Chinese Journal of Geophysics (in Chinese), 59(3): 897-911. DOI:10.6038/cjg20160312 |
Guo P Y, Niu Y L, Sun P, et al. 2016. The origin of Cenozoic basalts from central Inner Mongolia, East China:The consequence of recent mantle metasomatism genetically associated with seismically observed paleo-Pacific slab in the mantle transition zone. Lithos, 240-243: 104-118. DOI:10.1016/j.lithos.2015.11.010 |
Han M, Li J Y, Xu X Y, et al. 2017. Analysis for crustal anisotropy beneath the southeastern margin of Tibet by stacking azimuthal receiver functions. Chinese Journal of Geophysics (in Chinese), 60(12): 4537-4556. DOI:10.6038/cjg20171202 |
He Jing, Wu Q J, Zhang R Q, et al. 2018. Crustal structure beneath the Abaga area of Xing'an-Mongolia Orogenic Belt using teleseismic receiver functions. Chinese Journal of Geophysics (in Chinese), 61(9): 3676-3688. DOI:10.6038/cjg2018M0013 |
Heidbach O, Tingay M, Barth A, et al. 2010. Global crustal stress pattern based on the World Stress Map database release 2008. Tectonophysics, 482(1-4): 3-15. DOI:10.1016/j.tecto.2009.07.023 |
Huang Z C, Tilmann F, Xu M J, et al. 2017. Insight into NE Tibetan Plateau expansion from crustal and upper mantle anisotropy revealed by shear-wave splitting. Earth and Planetary Science Letters, 478: 66-75. DOI:10.1016/j.epsl.2017.08.030 |
Jahn B M. 2004. The Central Asian Orogenic Belt and growth of the continental crust in the Phanerozoic. Geological Society, London, Special Publications, 226(1): 73-100. DOI:10.1144/GSL.SP.2004.226.01.05 |
Kheraskova T N, Volozh Y A, Didenko A N, et al. 2003. The Vendian-early paleozoic history of the continental margin of eastern Paleogondwana, Paleoasian Ocean, and Central Asian Foldbelt. Russian journal of Earth Sciences, 5(3): 165-184. DOI:10.2205/2003ES000123 |
Ko B, Jung H. 2015. Crystal preferred orientation of an amphibole experimentally deformed by simple shear. Nature Communications, 6: 6586. DOI:10.1038/ncomms7586 |
Levin V, Park J. 1997. P-Sh conversions in a flat-layered medium with anisotropy of arbitrary orientation. Geophysical Journal International, 131(2): 253-266. DOI:10.1111/j.1365-246X.1997.tb01220.x |
Ligorría J P, Ammon C J. 1999. Iterative deconvolution and receiver-function estimation. Bulletin of the Seismological Society of America, 89(5): 1395-1400. |
Liu H F, Niu F L. 2012. Estimating crustal seismic anisotropy with a joint analysis of radial and transverse receiver function data. Geophysical Journal International, 188(1): 144-164. DOI:10.1111/j.1365-246X.2011.05249.x |
Liu K H, Gao S S, Gao Y, et al. 2008. Shear wave splitting and mantle flow associated with the deflected Pacific slab beneath northeast Asia. Journal of Geophysical Research:Solid Earth, 113(B1): B01305. DOI:10.1029/2007JB005178 |
Meissner R, Mooney W D, Artemieva I. 2002. Seismic anisotropy and mantle creep in young orogens. Geophysical Journal International, 149(1): 1-14. DOI:10.1046/j.1365-246X.2002.01628.x |
Pei S P, Zhao J M, Sun Y S, et al. 2007. Upper mantle seismic velocities and anisotropy in China determined through Pn and Sn tomography. Journal of Geophysical Research:Solid Earth, 112(B5): B05312. DOI:10.1029/2006JB004409 |
Qi S H, Liu Q Y, Chen J H, et al. 2016. Stratified crustal anisotropy from receiver function and its particle swarm inversion. Chinese Journal of Geophysics (in Chinese), 59(12): 4544-4559. DOI:10.6038/cjg20161217 |
Qiang Z Y, Wu Q J, Li Y H, et al. 2016. Crustal anisotropy beneath central-south Mongolia and its dynamic implications. Chinese Journal of Geophysics (in Chinese), 59(5): 1616-1628. DOI:10.6038/cjg20160507 |
Qiang Z Y, Wu Q J. 2019. Upper mantle anisotropy beneath Abag area in Inner Mongolia from shear wave splitting. Chinese J. Geophys. (in Chinese), 62(7): 2510-2526. DOI:10.6038/cjg2019M0549 |
Rümpker G, Kaviani A, Latifi K. 2014. Ps-splitting analysis for multilayered anisotropic media by azimuthal stacking and layer stripping. Geophysical Journal International, 199(1): 146-163. DOI:10.1093/gji/ggu154 |
Savage M K. 1999. Seismic anisotropy and mantle deformation:What have we learned from shear wave splitting?. Reviews of Geophysics, 37(1): 65-106. DOI:10.1029/98RG02075 |
Şengör A M C, Natal'in B A, Burtman V S. 1993. Evolution of the Altaid tectonic collage and Palaeozoic crustal growth in Eurasia. Nature, 364(6435): 299-307. DOI:10.1038/364299a0 |
Shen X Z, Yuan X H, Ren J S. 2015. Anisotropic low-velocity lower crust beneath the northeastern margin of Tibetan Plateau:Evidence for crustal channel flow. Geochemistry, Geophysics, Geosystems, 16(12): 4223-4236. DOI:10.1002/2015GC005952 |
Shi Y T, Gao Y, Wu J, et al. 2006. Seismic anisotropy of the crust in Yunnan, China:polarizations of fast shear-waves. Acta Seismologica Sinica (in Chinese), 28(6): 574-585. |
Silver P G, Chan W W. 1991. Shear wave splitting and subcontinental mantle deformation. Journal of Geophysical Research:Solid Earth, 96(10): 16429-16454. DOI:10.1029/91JB00899 |
Sun C Q, Lei J S, Li C, et al. 2013. Crustal anisotropy beneath the Yunnan region and dynamic implications. Chinese Journal of Geophysics (in Chinese), 56(12): 4095-4105. DOI:10.6038/cjg20131214 |
Tai L X, Gao Y, Liu G, et al. 2015. Crustal seismic anisotropy in the southeastern margin of Tibetan Plateau by ChinArray data:shear-wave splitting from temporary observations of the first phase. Chinese Journal of Geophysics (in Chinese), 58(11): 4079-4091. DOI:10.6038/cjg20151116 |
Tatham D J, Lloyd G E, Butler R W H, et al. 2008. Amphibole and lower crustal seismic properties. Earth and Planetary Science Letters, 267(1-2): 118-128. DOI:10.1016/j.epsl.2007.11.042 |
Tian B F, Li J, Yao Z X. 2008. Study on crust anisotropy of Taihang Mountain Range by analyzing azimuthal variation of receiver functions. Acta Seismologica Sinica (in Chinese), 30(4): 355-366. |
Vinnik L, Kiselev S, Weber M, et al. 2012. Frozen and active seismic anisotropy beneath southern Africa. Geophysical Research Letters, 39(8): L08301. DOI:10.1029/2012GL051326 |
Wang C Y, Flesch L M, Silver P G, et al. 2008. Evidence for mechanically coupled lithosphere in central Asia and resulting implications. Geology, 36(5): 363-366. DOI:10.1130/G24450A.1 |
Wang Q, Gao Y, Niu F L, et al. 2016. Reliability analysis of crustal anisotropy from receiver functions and effect of dipping interface. Earthquake (in Chinese), 36(2): 14-25. |
Wang Y, Zhou L Y, Zhao L J. 2013. Cratonic reactivation and orogeny:An example from the northern margin of the North China Craton. Gondwana Research, 24(3-4): 1203-1222. DOI:10.1016/j.gr.2013.02.011 |
Webb L E, Johnson C L. 2006. Tertiary strike-slip faulting in southeastern Mongolia and implications for Asian tectonics. Earth and Planetary Science Letters, 241(1-2): 323-335. DOI:10.1016/j.epsl.2005.10.033 |
Wei Z G, Chen L, Yang X L. 2011. Transverse variations of crustal thickness and Vp/Vs ratio under the stations in the Liaodong anteclise-Yanshan belt-Xingmeng orogenic belt and their tectonic implications. Chinese Journal of Geophysics (in Chinese), 54(11): 2799-2808. DOI:10.3969/j.issn.0001-5733.2011.11.010 |
Wessel P, Smith W H F. 1998. New, improved version of generic mapping tools released. Eos, Transactions American Geophysical Union, 79(47): 579-579. DOI:10.1029/98EO00426 |
Windley B F, Alexeiev D, Xiao W J, et al. 2007. Tectonic models for accretion of the Central Asian Orogenic Belt. Journal of the Geological Society, 164(1): 31-47. DOI:10.1144/0016-76492006-022 |
Wirth E, Long M D. 2010. Frequency-dependent shear wave splitting beneath the Japan and Izu-Bonin subduction zones. Physics of the Earth and Planetary Interiors, 181(3-4): 141-154. DOI:10.1016/j.pepi.2010.05.006 |
Wu J, Gao Y, Chen Y T, et al. 2007. Seismic anisotropy in the crust in northwestern capital area of China. Chinese Journal of Geophysics (in Chinese), 50(1): 209-220. |
Xiao W J, Windley B F, Hao J, et al. 2003. Accretion leading to collision and the Permian Solonker suture, Inner Mongolia, China:Termination of the central Asian orogenic belt. Tectonics, 22(6): 1069. DOI:10.1029/2002TC001484 |
Xiao W J, Han C M, Liu W, et al. 2014. How many sutures in the southern Central Asian Orogenic Belt:insights from East Xinjiang-West Gansu (NW China)?. Geoscience Frontiers, 5(4): 525-536. DOI:10.1016/j.gsf.2014.04.002 |
Xie Z X, Wu Q J, Zhang R Q. 2017. Crustal anisotropy beneath northeastern margin of the Tibetan Plateau and its dynamic implications. Chinese Journal of Geophysics (in Chinese), 60(6): 2315-2325. DOI:10.6038/cjg20170623 |
Xu B, Charvet J, Chen Y, et al. 2013. Middle Paleozoic convergent orogenic belts in western Inner Mongolia (China):framework, kinematics, geochronology and implications for tectonic evolution of the Central Asian Orogenic Belt. Gondwana Research, 23(4): 1342-1364. DOI:10.1016/j.gr.2012.05.015 |
Xu Z, Xu M J, Wang L S, et al. 2006. A study on crustal anisotropy using P to S converted phase of the receiver function:Application to Ailaoshan-Red River fault zone. Chinese Journal of Geophysics (in Chinese), 49(2): 438-448. |
Yang Z H, Sheehan A, Shearer P. 2011. Stress-induced upper crustal anisotropy in southern California. Journal of Geophysical Research:Solid Earth, 116(B2): B02302. DOI:10.1029/2010JB007655 |
Zhang H, Gao Y, Shi Y T, et al. 2012. Tectonic stress analysis based on the crustal seismic anisotropy in the northeastern margin of Tibetan plateau. Chinese Journal of Geophysics (in Chinese), 55(1): 95-104. DOI:10.6038/j.issn.0001-5733.2012.01.009 |
Zhang J L, Tian X B, Zhang H S, et al. 2012. The crust and upper mantle anisotropy in Baikal Rift Zone and its dynamic significance. Chinese Journal of Geophysics (in Chinese), 55(8): 2523-2538. DOI:10.6038/j.issn.0001-5733.2012.08.005 |
Zhang S H, Gao R, Li H Y, et al. 2014. Crustal structures revealed from a deep seismic reflection profile across the Solonker suture zone of the Central Asian Orogenic Belt, northern China:An integrated interpretation. Tectonophysics, 612-613: 26-39. DOI:10.1016/j.tecto.2013.11.035 |
Zhao B, Gao Y, Shi Y T, et al. 2011. Shear wave splitting in the crust in the intersection zone of the Zhangjiakou-Bohai seismic belt and Shanxi seismic belt. Chinese Journal of Geophysics (in Chinese), 54(6): 1517-1527. DOI:10.3969/j.issn.0001-5733.2011.06.011 |
常利军, 王椿镛, 丁志峰. 2009. 中国东部上地幔各向异性研究. 中国科学D辑:地球科学, 39(9): 1169-1178. |
房立华, 吴建平. 2009. 倾斜界面和各向异性介质对接收函数的影响. 地球物理学进展, 24(1): 42-50. |
高原, 吴晶, 易桂喜, 等. 2010. 从壳幔地震各向异性初探华北地区壳幔耦合关系. 科学通报, 55(29): 2837-2843. |
龚辰, 李秋生, 叶卓, 等. 2016. 远震P波接收函数揭示的张家口(怀来)-中蒙边境(巴音温多尔)剖面地壳厚度与泊松比. 地球物理学报, 59(3): 897-911. DOI:10.6038/cjg20160312 |
韩明, 李建有, 徐晓雅, 等. 2017. 按方位叠加接收函数分析青藏高原东南缘的地壳各向异性. 地球物理学报, 60(12): 4537-4556. DOI:10.6038/cjg20171202 |
何静, 吴庆举, 张瑞青, 等. 2018. 利用接收函数研究兴蒙造山带阿巴嘎地区的地壳结构. 地球物理学报, 61(9): 3676-3688. DOI:10.6038/cjg2018M0013 |
齐少华, 刘启元, 陈九辉, 等. 2016. 地壳分层各向异性介质接收函数及其粒子群反演. 地球物理学报, 59(12): 4544-4559. DOI:10.6038/cjg20161217 |
强正阳, 吴庆举, 李永华, 等. 2016. 蒙古中南部地区地壳各向异性及其动力学意义. 地球物理学报, 59(5): 1616-1628. DOI:10.6038/cjg20160507 |
强正阳, 吴庆举. 2019. 利用剪切波分裂研究内蒙古阿巴嘎地区上地幔各向异性. 地球物理学报, 62(7). DOI:10.6038/cjg2019M0549 |
石玉涛, 高原, 吴晶, 等. 2006. 云南地区地壳介质各向异性——快剪切波偏振特性. 地震学报, 28(6): 574-585. DOI:10.3321/j.issn:0253-3782.2006.06.002 |
孙长青, 雷建设, 李聪, 等. 2013. 云南地区地壳各向异性及其动力学意义. 地球物理学报, 56(12): 4095-4105. DOI:10.6038/cjg20131214 |
太龄雪, 高原, 刘庚, 等. 2015. 利用中国地震科学台阵研究青藏高原东南缘地壳各向异性:第一期观测资料的剪切波分裂特征. 地球物理学报, 58(11): 4079-4091. DOI:10.6038/cjg20151116 |
田宝峰, 李娟, 姚振兴. 2008. 利用接收函数方位变化研究太行山区地壳各向异性. 地震学报, 30(4): 355-366. DOI:10.3321/j.issn:0253-3782.2008.04.003 |
王琼, 高原, 钮凤林, 等. 2016. 利用接收函数计算地壳各向异性的可靠性分析及倾斜界面的影响. 地震, 36(2): 14-25. |
危自根, 陈凌, 杨小林. 2011. 辽东台隆、燕山带和兴蒙造山带台站下方地壳厚度和平均波速比(Vp/Vs)的横向变化及其构造意义. 地球物理学报, 54(11): 2799-2808. DOI:10.3969/j.issn.0001-5733.2011.11.010 |
吴晶, 高原, 陈运泰, 等. 2007. 首都圈西北部地区地壳介质地震各向异性特征初步研究. 地球物理学报, 50(1): 209-220. DOI:10.3321/j.issn:0001-5733.2007.01.027 |
谢振新, 吴庆举, 张瑞青. 2017. 青藏高原东北缘地壳各向异性及其动力学意义. 地球物理学报, 60(6): 2315-2325. DOI:10.6038/cjg20170623 |
徐震, 徐鸣洁, 王良书, 等. 2006. 用接收函数Ps转换波研究地壳各向异性——以哀牢山-红河断裂带为例. 地球物理学报, 49(2): 438-448. DOI:10.3321/j.issn:0001-5733.2006.02.017 |
张辉, 高原, 石玉涛, 等. 2012. 基于地壳介质各向异性分析青藏高原东北缘构造应力特征. 地球物理学报, 55(1): 95-104. DOI:10.6038/j.issn.0001-5733.2012.01.009 |
张建利, 田小波, 张洪双, 等. 2012. 贝加尔裂谷区地壳上地幔复杂的各向异性及其动力学意义. 地球物理学报, 55(8): 2523-2538. DOI:10.6038/j.issn.0001-5733.2012.08.005 |
赵博, 高原, 石玉涛, 等. 2011. 张家口-渤海地震带与山西地震带交汇区的地壳剪切波分裂. 地球物理学报, 54(6): 1517-1527. DOI:10.3969/j.issn.0001-5733.2011.06.011 |
郑斯华, 高原. 1994. 中国大陆岩石层的方位各向异性. 地震学报, 16(2): 131-140. |