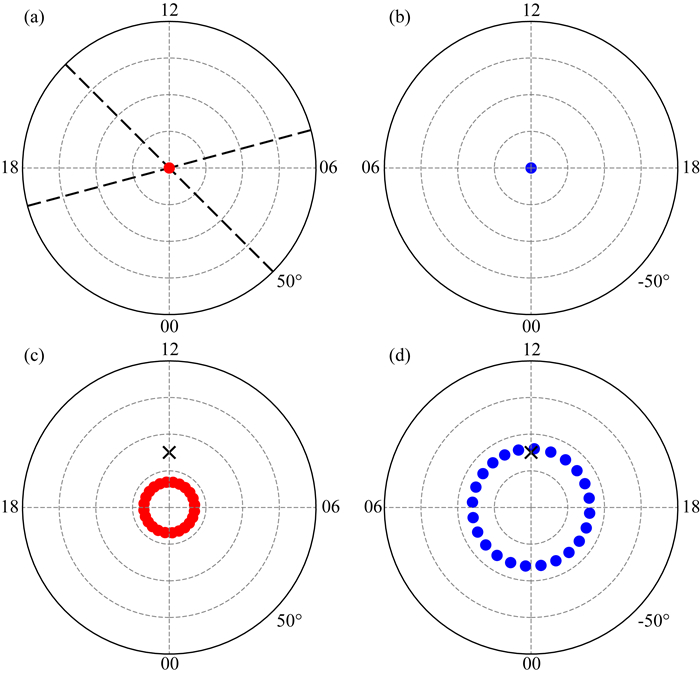
地球热层大气的热源主要包括太阳极紫外辐射、磁层能量注入以及低层大气能量上传等.本研究主要利用南北极点位置上的特殊性,考察磁层能量注入,特别是极尖区能量注入对热层大气密度的影响.图 1给出了南北极点在纬度-地方时和磁纬-磁地方时坐标系下位置的示意图.其中红蓝实心点分别表示北极点和南极点.在地球南北极点附近,由于经线几乎汇集于一点,导致不同经度的地理位置非常靠近.同样地,极点附近不同地方时的地理位置也非常接近.因此在南北极点附近,热层变化的经度和地方时依赖可能非常小.另外,对任意极轨卫星,无论其轨道所处的地方时是多少,它的每条轨道均会接近南北极点各一次,如图 1a中的两条黑色虚线所示.而在磁坐标系下,地理南极点对应的磁纬和磁经分别约为-74°和19°,而其磁地方时随地球自转而不断变化.在约15:30世界时,地理南极点处于12:00磁地方时.由于极尖区(cusp region)的位置正是-75°磁纬和12:00磁地方时(图 1d中黑色×形标记)(Newell and Meng, 1988b, 1989),因此在每天约15:30世界时,地理南极点会扫过极尖区.而地理北极点的磁经和磁纬分别约为83°和170°,它在约5:30到达12:00磁地方时,这是它最靠近极尖区(图 1c中黑色×形标记)的时间.
|
图 1 北极点(蓝实心点)和南极点(红实心点)在地理纬度-地方时坐标系(a与b)和磁纬-磁地方时坐标系(c与d)内的位置 (a)中的黑色虚线表示极轨卫星的两条可能轨道;(c)、(d)中的黑色×形标记表示极尖区位置(±75°磁纬,12:00磁地方时). Fig. 1 Locations of the North (red dots) and South (blue dots) Poles in the latitude-local time coordinates (a and b) and magnetic latitude-magnetic local time coordinates (c and d) Black dashed lines in (a) show two possible orbits of a polar orbit satellite. × labels in (c) and (d) represent the cusp regions in the northern and southern hemispheres. |
在地球极尖区,磁层等离子体可以直接进入电离层热层区域.Lühr等(2004)最先发现极尖区附近的热层大气密度可能比周围区域高一倍.之后,很多学者讨论了这个密度增强的可能机制(Knipp et al., 2011; Carlson et al., 2012; Sadler et al., 2012; Zhang et al., 2012, 2015;Deng et al., 2013).Zhang等(2012)发现沉降于极尖区附近的电子能量较低,可能在较高的热层区域被吸收.相比沉降于较低高度的高能电子,这种软电子沉降对于较高热层的加热效应可能更强.
地理南北极点和极尖区的周期性靠近可能导致极点热层密度的世界时变化.需要注意的是,此前有很多研究讨论过热层密度和温度的世界时/经度变化(Hedin and Reber, 1972; Hedin et al., 1979; Hedin and Carignan, 1985; Xu et al., 2013a, b).之所以将世界时和经度变化一起讨论,是因为在固定地方时的情况下,世界时和经度同步变化.尤其对极轨卫星而言,其地方时变化通常很慢.例如CHAMP卫星需要约130天才可以扫过所有地方时.因此我们无法从若干天的卫星数据中分辨出世界时和经度的独立变化.但是如前所述,在本研究中,由于地理南北极点的特殊性,世界时是与磁地方时同步变化的,因此南北极点的世界时变化也即磁地方时变化.
在本研究中,我们主要使用了GRACE(Gravity Recovery and Climate Experiment)卫星观测的地理南北极点附近的热层大气密度数据.我们使用时序叠加的统计方法来研究南北极点热层大气密度的磁地方时变化.为了研究这一磁地方时变化的行星际磁场依赖性,特别是对By分量的依赖(Crowley et al., 2010; Knipp et al., 2011; Li et al., 2011),我们还根据太阳风扇区极性对数据进行分组.最后,我们还讨论了磁地方时变化与太阳活动水平的关系.
1 数据与方法在本研究中,我们主要使用了GRACE卫星2002—2010年间的加速计数据反演得到的热层大气密度数据(Sutton, 2011).GRACE是发射于2002年3月,轨道几乎完全重合的两颗极轨近圆轨道卫星.这两颗卫星的初始轨道高度约为500 km,它们的轨道周期约为94.5 min,因而每天可以绕地球约16圈.两颗卫星的轨道倾角约为89°.因此它们在每个轨道周期内都穿过南北极点各一次,每天可以穿过南北极点各16次.这样的时间分布有利于世界时/磁地方时变化的研究.本研究所使用的大气密度数据是Sutton(2011)利用GRACE卫星上的加速计仪器测得的加速度数据反演得到的,密度相对误差一般小于15%.此大气密度数据的时间精度约为50 s,纬度精度为3°,最靠近南北极点的数据点的纬度分别标定为-90°和90°.我们用这两个点的数据来代表南北极点的密度.在本研究中,利用NRLMSISE-00模型,热层大气密度被归一化至400 km(Picone et al., 2002),从而除去卫星每日的高度变化对结果的影响.在进行统计分析前,我们进一步将密度数据归一化为相对每日平均的百分比变化,即ρr=(ρ-ρm)/ρm×100(%).其中ρ为原始数据,ρm为ρ的每日平均.使用ρr可以避免不同时期的背景密度对结果的影响.除大气密度数据外,本研究还使用了行星际磁场数据,即NASA/GSFC的OMNI数据集.OMNI数据集使用了多颗卫星的行星际磁场观测结果,包括ACE、Geotail、IMP8和Wind卫星.在本研究涉及的时间段(2002—2010年),行星际磁场的观测数据主要来源于ACE和Wind卫星.OMNI行星际磁场数据已由观测位置平移至弓形激波的顶点位置.
为了研究行星际磁场(特别是其By分量)对极点密度磁地方时变化的影响,我们把极区的密度数据根据当天太阳风扇区的极性分为两组.其中一组太阳风扇区极性从地球指向太阳,另外一组从太阳指向地球.然后我们定义世界时0点为时序叠加的零点,然后对两组数据分别进行统计分析.
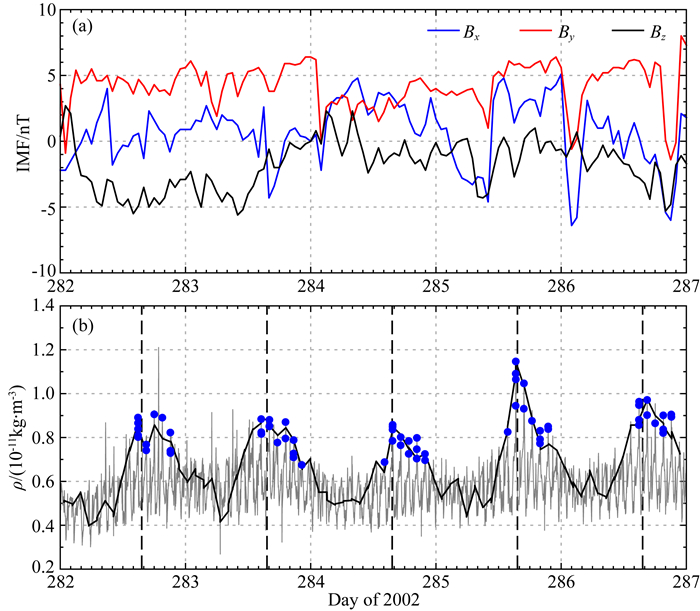
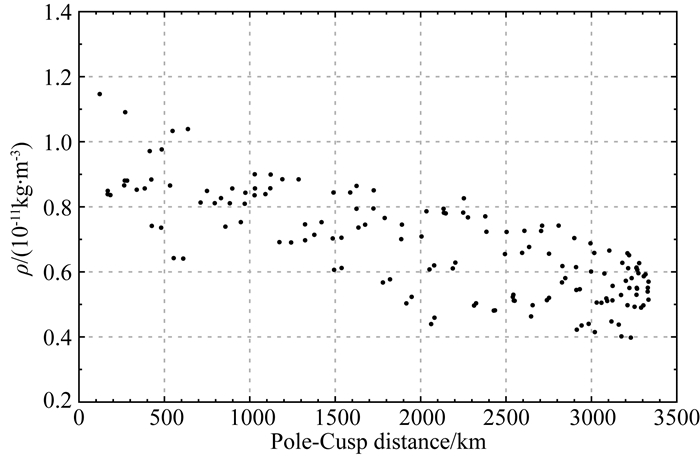
2 结果与讨论在给出统计结果前,我们先对2002年第282至第286天的事件进行分析.该段时间的行星际磁场及太阳辐射没有显著的天变化.图 2展示了行星际磁场以及GRACE卫星观测的大气密度在此期间的变化.图 2a中蓝色,红色和黑色实线分别表示行星际磁场Bx、By和Bz分量随时间的变化.图 2b中的灰色实线表示的是GRACE卫星观测到的局地密度随时间的变化.我们将GRACE卫星经过南极点附近的数据用黑色实粗线表示.图中的蓝点表示GRACE卫星经过极尖区附近(-80°<MLAT<-70°,11<MLT<13)时的数据.在这5天大多数的时间内,行星际磁场Bx、By和Bz分量的值都在-5 nT和5 nT之间,并且没有表现出世界时变化.而在图 2b中,黑色实线所表示的地理南极点附近的热层大气密度在4×10-12 kg·m-3和1.1×10⁻¹¹ kg·m-3之间变化,呈现出明显的世界时依赖性.在约15:30 UT,南极点热层密度达到最大值.而此时此刻,南极点也正处于极尖区的位置.随地球自转,当南极点逐渐远离极尖区时,热层密度逐渐降低,在约06:00 UT达到极小值.这表明南极点热层密度的世界时变化可能是其周期性经过极尖区的一个结果.为了验证这一假设,我们在图 3中展示了2002年第282至第286天GRACE卫星观测的南极点热层大气密度随南极点和极尖区(-75° MLAT,12MLT)之间距离的变化关系.由图 3可知,南极点到极尖区的距离和GRACE卫星测得的南极点的热层大气密度呈负相关关系.这进一步表明了,极点热层大气密度的周期性变化和其周期性靠近极尖区相关.
|
图 2 2002年第282至第286天的行星际磁场Bx、By和Bz分量(a)和GRACE卫星观测的热层大气密度(b)的变化 (b)中的灰色实线表示GRACE卫星所有纬度的密度观测;黑色实线表示其中南纬90°的密度观测;蓝色实心点表示GRACE卫星经过极尖区附近(-80° <MLAT<-70°,11<MLT<13)的数据;黑色垂直虚线表示的时间点为南极点与极尖区几乎重合的世界时(15:30). Fig. 2 Variations of IMF Bx, By and Bz (a) and the thermospheric mass densities (b) observed by the GRACE satellite during the period from 282 to 286 days of 2002 The gray line in (b)represents the thermospheric mass densities observed by the GRACE satellite at all latitudes. The black line is the thermospheric densities observed at the -90° latitude. The blue dots show the GRACE observations near the cusp region (-80° < MLAT < -70°, 11 < MLT < 13). The black vertical dashed lines represent the time when the South Pole and the cusp region overlap. |
|
图 3 2002年第282天至第286天GRACE卫星在南纬90°观测的热层大气密度随着南极点和极尖区距离的变化 Fig. 3 Variation of the South Polar thermospheric mass density observed during the period from 282 to 286 days of 2002 by the GRACE satellite as a function of the distance between the South Pole and the cusp region |
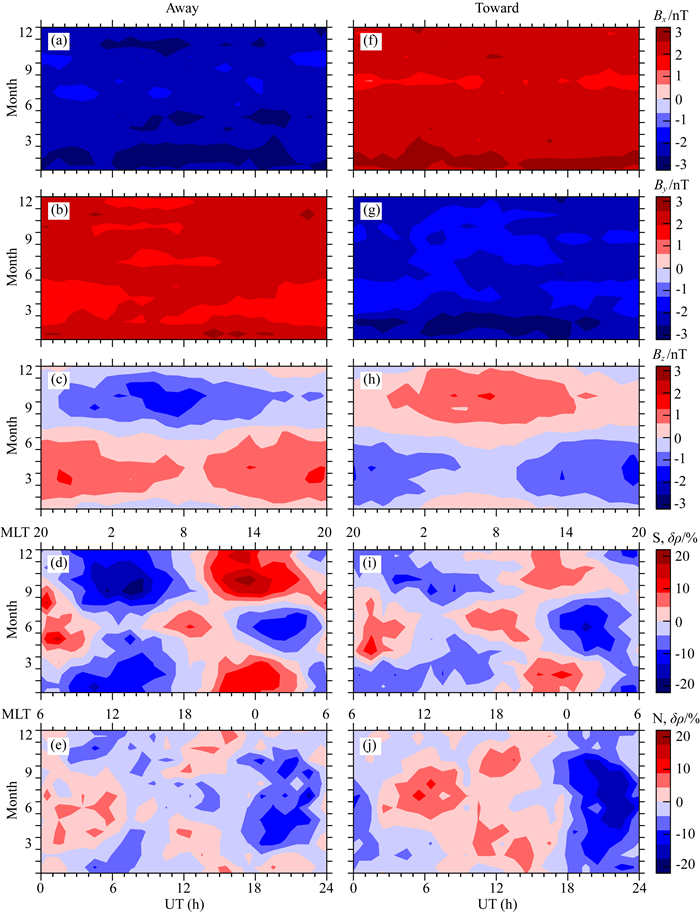
以上的结果使得我们有理由推断,在统计结果中,南极点热层大气密度同样会在约15:30 UT(12:00 MLT)达到极大值.为了验证这个推断,图 4展示了行星际磁场在GSM坐标系中各分量以及南北极点热层大气密度的时序叠加结果.时序叠加的零点设置为每天的世界时零点.我们把数据按照月份进行了分组,从而可以讨论季节变化对结果的影响.之前的研究表明行星际磁场By分量对极尖区能量注入有影响.为了将行星际磁场By的影响考虑在内,我们还将数据按照太阳风扇区的极性分为了两类.一类是背向极性,行星际磁场从太阳指向地球(-Bx, +By);另一类是面向极性,行星际磁场从地球指向太阳(+Bx, -By).在2002至2010年间,大约有1281天太阳风扇区的极性为背向太阳,有1418天太阳风扇区的极性为面向太阳.在图 4a和图 4f中,行星际磁场Bx分量在背向和面向极性下的平均值约为2.3 nT和-2.3 nT.而行星际磁场By分量在背向和面向极性下的平均值约为-2.3 nT和2.3 nT.由图 4可得行星际磁场Bx和By的变化没有季节或世界时依赖性.与此不同的是,在地球自转和公转的过程中,地磁场与行星际磁场的相对位形不断改变,这使得GSM Bz产生了世界时和季节变化.从统计平均的角度来看,南向行星际磁场的极大值出现于每年10月5日的世界时10:00和每年4月5日的世界时22:00 (Russell and McPherron, 1973).这与图 4c和图 4h的结果相符合.行星际磁场Bz的季节变化会影响热层大气的密度(Guo et al., 2015).然而其世界时变化对极点密度的影响可能很小,下面会再详细讨论.
|
图 4 行星际磁场Bx、By和Bz分量以及纬度±90°的热层大气密度随世界时和月份变化的统计结果 左右两列分别表示背向和面向太阳风扇区.这里的密度是相对每日平均的百分比密度.南北极点所处的磁地方时标定在下面两行图的上方. Fig. 4 Superposed epoch results of the IMF Bx, By and Bz components and the thermospheric mass densities at ±90° latitude as a function of UT and month The left and right panels show the results of the away and toward solar wind sectors, resepctively. The densities are normalized by the daily average. The magnetic local times of the South and North Poles are shown on the top of the corresponding panels. |
图 4d和图 4i展示了南极点热层大气密度的时序叠加结果;图 4e和图 4j展示了北极点热层大气密度的时序叠加结果.在背向极性的扇区中(图 4d),10月份的南极点热层大气密度在17:00 UT(13:30 MLT)达到极大值,比其日平均值高约22%.这个密度极值出现的时间是在南极点经过极尖区后约1.5 h.这个时间差可能由两方面的原因导致.其一,极尖区所处的磁地方时和行星际磁场By分量的方向有关,并非始终处于磁地方时为12的位置;其二,热层大气需要一定时间来对加热过程响应.通过比较图 4d与图 4c可以发现,密度极大值出现的时间晚于南向行星际磁场极大值出现时间约7 h.因此可得南极点密度的磁地方时变化不是由南向行星际磁场所主导.从图 4d中还可以发现,与南极点热层密度极大值相对应,在10月份约08:00 UT(04:30 MLT),南极点的热层大气密度达到一个极小值.形成这一极小值的可能原因是在南极点远离极尖区过程中,极尖区加热效应逐渐减弱,导致密度相对较低.比较密度极小值和极大值出现的时间点发现,极小值出现的时间点(约08:00 UT)并非处于两个密度极大值的中间位置(约05:00 UT),而是略靠近后一个密度极大值.一个可能的原因是热层大气的加热和放热涉及不同的物理过程,拥有不同的时间尺度.在极尖区,加热可能主要由注入高层大气德离子沉降与焦耳加热;而冷却过程主要是通过NO等气体的红外辐射及相关动力学过程.从图 4d发现在5—7月份,南极点热层密度并没有在17:00 UT(13:30 MLT)出现最大值,而是分别在01:00 UT和13:00 UT出现两个相对小的极大值.Newell和Meng(1988a)利用DMSP(Defense Meteorological Satellite Program)F7卫星的观测数据发现,沉降于夏季半球极尖区的离子和电子有更大的能量通量(比冬季半球高约61%)与更小的平均粒子能量.这意味着在夏季半球极尖区,更多的能量可以沉降于更高高度的热层区域,这有助于较高热层区域的加热效应(Deng et al., 2011; Zhang et al., 2012).因此,夏季半球的热层密度在极尖区的增加可能会比冬季半球明显.而在5—7月份,南半球处于冬季半球,极尖区密度增强不明显,无法引起南极点热层密度的磁地方时变化.
南极点热层密度的磁地方时变化还依赖于太阳风扇区的极性.从图 4d和图 4i中我们发现,在太阳风扇区为背向极性(-Bx,+By)和面向极性(+Bx,-By)的条件下,10月份17:00 UT(13:30 MLT)的南极点热层密度比其日平均值分别高约22%和11%.这一差别可能与行星际磁场By分量的影响有关.Yamazaki等(2015)也发现南半球极尖区的热层大气密度在正By条件下比在负By条件下要大,但是他们提出,极尖区能量沉降可能不足以解释这一现象.
图 4e和图 4j给出了北极点热层密度的统计结果.地理北极点的磁纬约为83°.与地理南极点相比,北极点与极尖区距离更远.因此我们发现北极点热层密度的磁地方时变化没有南极点明显.然而由图 4j,当扇区极性为面向太阳时,7、8月份的北极点热层密度在约06:00 UT(12:30 MLT)达到极大值.这可能由于在06:00 UT,北极点相对靠近极尖区.由于行星际磁场By分量对南北半球大气密度的作用效果是相反的,因此与南极点不同的是,北极点密度的磁地方时变化在面向扇区比在背向扇区内明显.
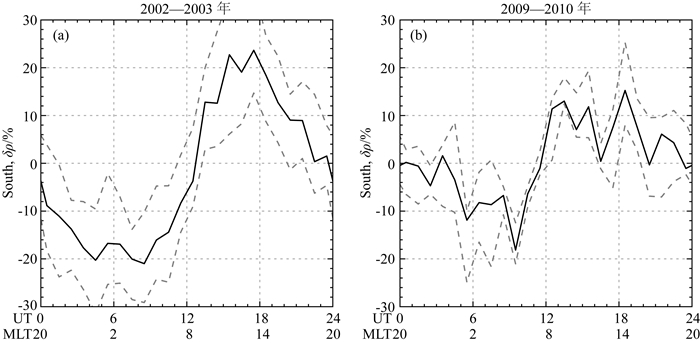
前面提到南北极点热层密度的磁地方时变化依赖于季节.无论南极点还是北极点,当它们处于太阳辐射更强的夏季半球时,其热层密度会呈现出相对较强的磁地方时变化.这可能暗示着极点密度的磁地方时变化在太阳活动较强时更明显.为了进一步验证这一猜想,我们把2002—2003年与2009—2010年的GRACE卫星南极点密度数据分组进行统计研究.2002—2003年接近太阳活动高年,对应较强的太阳辐射;2009—2010年接近太阳活动低年,对应较弱的太阳辐射.图 5展示了两组数据的时序叠加结果.由图可见,在较高太阳辐射条件下(2002—2003年),南极点热层密度磁地方时变化的幅度更大.
|
图 5 GRACE卫星分别在2002—2003年9、10月份(a)和2009—2010年9、10月份(b)南纬90°观测密度的世界时(磁地方时)变化 密度利用其日平均值进行了归一化处理.黑色实线表示统计的中值,灰色虚线表示上下四分位数. Fig. 5 Superposed epoch results of the UT (MLT) variation of the thermospheric mass density in September and October of years 2002—2003 (a) and 2009—2010 (b) The densities are normalized by the daily mean. The black solid line represents the median. The grey dashed line represents the upper and lower quartiles. |
本文使用GRACE卫星的质量密度观测数据来研究地理南北极点热层密度的磁地方时变化.2002年至2010年的统计结果表明在9—11月份的背向太阳风扇区内,南极点热层密度在13:30 MLT(17:00 UT)达到最大,比其日平均值高约22%.而在6—8月份的面向扇区内,北极点热层密度在13:00 MLT(06:00 UT)达到最大,比其日平均值高约13%.南北极点热层密度的磁地方时变化可能是其周期性靠近极尖区的结果.由于南极点相比北极点更靠近极尖区,因此它的磁地方时变化更明显.在冬季半球,磁地方时变化消失.这可能是由于在冬季半球,沉降于极尖区的磁层粒子能量通量小,沉降高度低,因而对较高高度热层大气的加热效果不强.南北极点热层密度的磁地方时变化分别在背向扇区(-Bz,+By)和面向扇区(+Bz,-By)内更显著.这可能是行星际磁场By分量对南北半球的密度变化呈现相反作用的结果.本研究还表明,随着太阳辐射活动增强,极点热层大气密度的磁地方时变化更显著.
Carlson H C, Spain T, Aruliah A, et al. 2012. First-principles physics of cusp/polar cap thermospheric disturbances. Geophysical Research Letters, 39(19): L19103. DOI:10.1029/2012GL053034 |
Crowley G, Knipp D J, Drake K A, et al. 2010. Thermospheric density enhancements in the dayside cusp region during strong BY conditions. Geophysical Research Letters, 37(7): L07110. DOI:10.1029/2009GL042143 |
Deng Y, Fuller-Rowell T J, Akmaev R A, et al. 2011. Impact of the altitudinal Joule heating distribution on the thermosphere. Journal of Geophysical Research:Space Physics, 116(A5): A05313. DOI:10.1029/2010JA016019 |
Deng Y, Fuller-Rowell T J, Ridley A J, et al. 2013. Theoretical study:Influence of different energy sources on the cusp neutral density enhancement. Journal of Geophysical Research:Space Physics, 118(5): 2340-2349. DOI:10.1002/jgra.50197 |
Guo D J, Lei J H, Dou X K. 2015. Statistical analysis of thermospheric density response to solar wind sector structure. Journal of Geophysical Research:Space Physics, 120(6): 5076-5086. DOI:10.1002/2015JA021112 |
Hedin A E, Carignan G R. 1985. Morphology of thermospheric composition variations in the quiet polar thermosphere from Dynamics Explorer measurements. Journal of Geophysical Research:Space Physics, 90(A6): 5269-5277. DOI:10.1029/JA090iA06p05269 |
Hedin A E, Reber C A. 1972. Longitudinal variations of thermospheric composition indicating magnetic control of polar heat input. Journal of Geophysical Research, 77(16): 2871-2879. DOI:10.1029/JA077i016p02871 |
Hedin A E, Reber C A, Spencer N W, et al. 1979. Global model of longitude/UT variations in thermospheric composition and temperature based on mass spectrometer data. Journal of Geophysical Research:Space Physics, 84(A1): 1-9. DOI:10.1029/JA084iA01p00001 |
Knipp D, Eriksson S, Kilcommons L, et al. 2011. Extreme Poynting flux in the dayside thermosphere:Examples and statistics. Geophysical Research Letters, 38(16): L16102. DOI:10.1029/2011GL048302 |
Li W H, Knipp D, Lei J H, et al. 2011. The relation between dayside local Poynting flux enhancement and cusp reconnection. Journal of Geophysical Research:Space Physics, 116(A8): A08301. DOI:10.1029/2011JA016566 |
Lühr H, Rother M, Köhler W, et al. 2004. Thermospheric up-welling in the cusp region:Evidence from CHAMP observations. Geophysical Research Letters, 31(6): L06805. DOI:10.1029/2003GL019314 |
Newell P T, Meng C I. 1988a. Hemispherical asymmetry in cusp precipitation near solstices. Journal of Geophysical Research:Space Physics, 93(A4): 2643-2648. DOI:10.1029/JA093iA04p02643 |
Newell P T, Meng C I. 1988b. The cusp and the cleft/boundary layer:Low-altitude identification and statistical local time variation. Journal of Geophysical Research:Space Physics, 93(A12): 14549-14556. DOI:10.1029/JA093iA12p14549 |
Newell P T, Meng C I. 1989. Dipole tilt angle effects on the latitude of the cusp and cleft/low-latitude boundary layer. Journal of Geophysical Research:Space Physics, 94(A6): 6949-6953. DOI:10.1029/JA094iA06p06949 |
Picone J M, Hedin A E, Drob D P, et al. 2002. NRLMSISE-00 empirical model of the atmosphere:Statistical comparisons and scientific issues. Journal of Geophysical Research:Space Physics, 107(A12): SIA 15-1-SIA 15-16. DOI:10.1029/2002JA009430 |
Russell C T, McPherron R L. 1973. Semiannual variation of geomagnetic activity. Journal of Geophysical Research, 78(1): 92-108. DOI:10.1029/JA078i001p00092 |
Sadler F B, Lessard M, Lund E, et al. 2012. Auroral precipitation/ion upwelling as a driver of neutral density enhancement in the cusp. Journal of Atmospheric and Solar-Terrestrial Physics, 87-88: 82-90. DOI:10.1016/j.jastp.2012.03.003 |
Sutton E K. 2011. Accelerometer-derived atmospheric density from the CHAMP and GRACE satellites. Version 2.3, Air Force Research Lab Kirtland Afb Nm.
|
Xu J Y, Smith A K, Wang W B, et al. 2013a. An observational and theoretical study of the longitudinal variation in neutral temperature induced by aurora heating in the lower thermosphere. Journal of Geophysical Research:Space Physics, 118(11): 7410-7425. DOI:10.1002/2013JA019144 |
Xu J Y, Wang W B, Gao H. 2013b. The longitudinal variation of the daily mean thermospheric mass density. Journal of Geophysical Research:Space Physics, 118(1): 515-523. DOI:10.1029/2012JA017918 |
Yamazaki Y, Kosch M J, Sutton E K. 2015. North-south asymmetry of the high-latitude thermospheric density:IMF BY effect. Geophysical Research Letters, 42(2): 225-232. DOI:10.1002/2014GL062748 |
Zhang B, Lotko W, Brambles O, et al. 2012. Enhancement of thermospheric mass density by soft electron precipitation. Geophysical Research Letters, 39(20): L20102. DOI:10.1029/2012GL053519 |
Zhang B, Varney R H, Lotko W, et al. 2015. Pathways of F region thermospheric mass density enhancement via soft electron precipitation. Journal of Geophysical Research:Space Physics, 120(7): 5824-5831. DOI:10.1002/2015JA020999 |
 2019, Vol. 62


