2. 北京大学地球与空间科学学院, 北京 100871;
3. 中国科学院大学地球与行星科学学院计算地球动力学实验室, 北京 100049;
4. 南京大学地球科学与工程学院, 南京 210023
2. School of Earth and Space Sciences, Peking University, Beijing 100871, China;
3. Key Laboratory of Computational Geodynamics, College of Earth and Planetary Sciences, University of Chinese Academy of Sciences, Beijing 100049, China;
4. School of Earth Sciences and Engineering, Nanjing University, Nanjing 210023, China
板块俯冲过程是地球物质、能量循环的主要机制(Stern, 2002).俯冲板块把地壳物质和挥发分带入地幔, 同时在地幔楔熔融抽取熔体形成新的地壳组分(郑永飞等, 2016).俯冲板块从海沟处进入到软流圈地幔, 并在与地幔转换带相互作用过程中, 发生一系列的重要的物理、化学过程.物理过程主要包括俯冲板片回折、海沟后撤、弧后扩张, 俯冲板片与地幔不连续界面的相互作用等.化学过程表现在由俯冲板片脱水而导致地幔楔水化熔融和岛弧岩浆岩的形成等(郑永飞等, 2015).因此, 理解俯冲板块在上地幔的动力学行为对于深入探索俯冲带的物理化学过程具有重要意义(Billen, 2008).大量研究表明板块俯冲的主要动力来自其本身与周围地幔密度差产生的负浮力(Leng and Gurnis, 2011; Li and Ribe, 2012).在负浮力的驱动下, 大洋板块进入软流圈地幔并与地幔相互作用.俯冲板块与地幔的相互作用(特别是与地幔转换带的相互作用)致使俯冲板块在上地幔呈现不同的几何形态, 并进一步影响海沟的运动模式.全球主要俯冲带中, 部分板块停滞在660 km不连续界面(见图 1), 而其余俯冲板块却穿过该界面到达下地幔(Goes et al., 2017; Agrusta et al., 2017; Li et al., 2019).造成这一差异的原因目前仍存在很大争议.大量的数值模拟和构造物理模拟实验表明俯冲板块与地幔的密度差, 俯冲板块的厚度以及俯冲板块与软流圈地幔的黏度比都能显著影响俯冲板块的动力学行为(Stegman et al., 2010a; Li and Ribe, 2012; Ribe, 2010; Schellart, 2010; Shi et al., 2018).

|
图 1 全球俯冲带波速结构剖面.数据根据GAP_P4模型.红线代表剖面位置, 圆点代表地震 Fig. 1 Cross sections of global subduction zones, based on the data from GAP_P4 model (Fukao and Obayashi, 2013; Obayashi et al., 2013). Red lines represent the position of sections. Circles represent earthquakes |
地幔转换带(mantle transition zone)是指地幔深度在410~660 km的地幔区域.其顶部边界(约410 km深度)由橄榄石转变为瓦兹利石的矿物相变面所限定, 底部660 km深度界面由林伍德石分解成钙钛矿和镁方铁石矿物相变面限定(周春银等, 2010).目前对于俯冲板块与地幔转换带的相互作用的相关研究较为薄弱.主要原因在于俯冲板块的动力学过程受诸多因素影响, 例如俯冲板块的年龄, 板块强度, 俯冲板块与软流圈地幔的黏度比, 俯冲板块的脱水与地幔楔的蛇纹岩化, 俯冲板块与上覆板块的耦合状态等等(Hu et al., 2018).同时, 俯冲板块的流变结构也与深源地震等关系密切(Karato et al., 2001).因此, 通过数值模拟, 系统地研究俯冲板块与地幔转换带的相互作用, 可以为认识地幔转换带的结构、相变特征以及与不同类型俯冲板块作用造成俯冲板块形态多样性提供重要约束和限定.前人研究表明410 km和660 km不连续界面矿物相变的克拉伯龙斜率可能是造成这一差异的重要原因(Agrusta et al., 2017; Li et al., 2019).海沟后撤速度也可能与该过程密切相关, 后撤型的海沟导致俯冲板块停滞在660 km, 而后撤速度较慢或者海沟前进则可能促使俯冲板块穿过660 km不连续界面(CÍzková et al., 2002).最近的研究表明俯冲板块是否停滞在660 km不连续界面与俯冲板块最初到达660 km界面时与该界面的角度有关(Li and Ribe, 2012; Ribe, 2010; Shi et al., 2018).
俯冲板块与地幔转换带的相互作用影响地球内部物质和能量循环的过程.停滞在660km界面的俯冲板块可能与板内岩浆(Sheng et al., 2016)、克拉通破坏(Wang et al., 2016; He, 2015)等地质过程相关.岩石力学实验表明俯冲板块的流变结构与深源地震密切相关(Karato et al., 2001).理解俯冲板块与地幔转换带的相互作用, 对于认识上地幔演化, 地幔对流, 深源地震等都具有重要意义.本文将着重探讨自由俯冲的动力学过程, 首先介绍数值模拟方法, 然后探讨一系列大洋俯冲的数值模型, 并结合全球板块实际观测数据, 总结俯冲板块与地幔转换带的相互作用过程、在上地幔的变形方式及其影响因素;着重探讨俯冲板块的年龄、板块的塑性强度等因素对俯冲板块在上地幔的动力学过程的影响.
1 数值模拟方法板块俯冲的动力学数值模型, 一般对三组控制方程求解, 包括斯托克斯流体动力学方程、物质守恒方程以及能量守恒方程.本文运用有限差分法和粒子法联合求解不可压缩的斯托克斯流体动力学方程, 详细算法介绍见Gerya和Yuen(2003, 2007)、李忠海等(2015).
1.1 控制方程 1.1.1 斯托克斯方程

|
(1) |
上述方程中, x和y分别代表水平和垂直坐标, g是重力加速度.对于给定岩石类型密度ρ依赖于温度T和压力P.另外, σ′xx, σ′xy, σ′yy是偏应力张量, 其本构方程为

|
(2) |
上式中ηeff表示一个等效黏滞系数, 综合了黏性形变和塑性屈服形变.
1.1.2 不可压缩流体物质守恒方程

|
(3) |
其中vx和vy分别代表水平和垂直方向速度.
1.1.3 能量守恒方程

|
(4) |

|
(5) |

|
(6) |

|
(7) |
式中, DT/Dt表示温度T对时间t的微分.x和y表示水平和垂向坐标.vx和vy表示水平速度和垂向速度.σ′ij表示偏应力张量. 
该数值模型中流变学关系采用复合的黏-塑性本构关系.其中, 黏性流变性质取决于温度、压力以及应变速率, 其黏滞系数定义为

|
(8) |
上式中, 
黏性流变与塑性流变相结合形成实际的有效黏-塑性流变关系.这里采用改进的Drucker-Prager屈服准则:

|
(9) |
上述方程中, σyield表示屈服应力.P是压力.C0是P=0条件下的岩石剩余强度, φ是内摩擦角.λ是孔隙流体系数.这里我们定义sin(φ)=sin(φdry)λ.
综合黏性和塑性变形, 塑性流变关系的最终有效黏滞系数可以定义为韧性和塑性黏滞系数中的最小值(Ranalli, 1995):

|
(10) |
作为上地幔最主要的组成矿物,橄榄石的相变控制了地幔的物理化学特征.在410 km处,橄榄石转变为瓦兹利石,该相变具有正的克拉伯龙斜率.而在660 km处,林伍德石开始分解为钙钛矿和镁方铁矿.实验岩石学研究表明,对于410 km处的相变界面,其克拉伯龙斜率大致在2.5到3.0 MPa/K之间变化.而660 km处相变的克拉伯龙斜率可能的范围则为-4.5到-2.0 MPa/K(Katsura and Ito 1989; Ito et al., 1990).当然值得注意的是,对于这两个深度处的克拉伯龙斜率,实验岩石学的结果差异很大,因此缺乏很好的约束.在本文中,我们采用2.7 MPa/K和-4.0 MPa/K分别作为410 km和660 km相变界面的克拉伯龙斜率.
2 初始模型和边界条件上述动力学方程采用I2VIS程序进行求解.该程序采用有限差分法联合粒子法求解动力学方程和热传导方程.
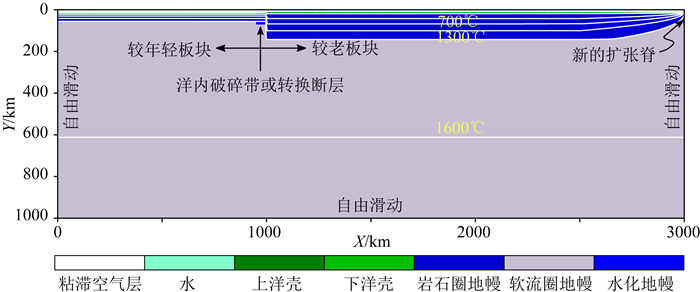
为了研究大洋板块俯冲的动力学过程, 我们建立了一组大洋俯冲的数值模型.模型宽度为3000 km, 深度为1000 km.初始模型中大洋地壳由3 km的玄武岩和5 km的辉长岩组成.该俯冲模型假设洋内俯冲开始于转换断层或大洋内破碎带(两板块中间薄弱区域), 但是不考虑初始俯冲的过程.模型由年轻的上覆板块和较老的俯冲板块组成.初始模型设计见图 2.模型中所有边界均采用自由滑动边界.板块的俯冲过程主要由较老板块自身的重力驱动.模型顶部采用10 km厚的黏滞空气层用来模拟地表动态演化.该方法广泛应用于地球动力学数值模拟算法中, 并被证明是有效的(Gerya et al., 2008; Crameri et al., 2012).对于温度场的边界条件, 模型上边界固定为0 ℃, 两侧边界为零热流.底部边界垂直方向温度梯度为零.岩石圈中的温度分布, 按照半无限冷却模型计算得到(Turcotte and Schubert, 2002), 软流圈地幔中的地温梯度为0.5 ℃/km.

|
图 2 初始模型和边界条件设置示意图.模型大小为3000 km×1000 km.空间分辨率在俯冲带为1 km×1 km, 向两侧逐渐渐变为10 km×10 km.模型中颜色代表岩石类型.颜色与岩石类型的对应关系如岩性色标所示 Fig. 2 Initial configuration of the initial numerical model. The size of the model is 3000 km×1000 km. We use the rectangular grid to do the discretization. The space resolution is 1 km×1 km in subduction zones and vary to 10 km×10 km to two sides. Different colors represent different rock types. The corresponding relationship of colors and rock types are presented by the rock type color bar. |
我们系统考察了俯冲板块热结构、厚度以及塑性强度对俯冲过程的影响.在这些模型中, 上覆板块保持不变.在参考模型的基础上, 我们探究了多种因素对俯冲板块与地幔转换带相互作用的影响.
|
|
表 1 模型采用的黏滞性流变参数 Table 1 Viscous flow laws used in the numerical experiments |
|
|
表 2 数值模型采用的材料参数 Table 2 Material properties used in the numerical experiments |
参考模型中, 俯冲板块的年龄为100 Ma, 上覆板块为10 Ma, 岩石圈的有效内摩擦系数为0.1.图 3显示了参考模型中的俯冲板块随时间演化序列.由于俯冲板块自身负浮力的作用, 板块前端开始弯曲并且沉入到软流圈地幔开始俯冲.在1.5 Ma左右板块开始俯冲到约200 km深度.随着俯冲的进行, 2.5 Ma左右俯冲板块前端开始与410 km相变界面接触.由于410 km相变界面是放热反应使得负浮力增加, 因此俯冲板块速度快速增加.当俯冲板块前端到达660 km界面时, 该相变面是吸热反应,克拉伯龙斜率为负值,从而俯冲板块受到该相变面的正浮力而产生阻碍作用, 板块在不同深度分别向相反方向弯曲.11 Ma以后, 俯冲板块基本开始停滞在地幔转换带.整个过程中, 海沟持续后撤.由于岩石圈的强度较低, 可以看出俯冲到地幔转换带的板块发生严重挠曲.当俯冲板块前端到达660 km相变界面处,其与该界面形成的角度较小,并且板块由于强度较小立即挠曲从而平卧在该界面处.在该过程中,地幔岩石的密度演化扮演了重要角色.

|
图 3 参考模型的演化结果 (a—d)为物质场演化, 其中白线代表等温线; (e—h)表示温度场的演化. Time表示模型相对初始模型演化的时间.模型基本参数设置:上覆板块10 Ma, 俯冲板块100 Ma, 俯冲板块岩石圈的摩擦系数为0.1. Fig. 3 Evolution of the reference model From a to d is the compositional field evolution. The white lines represent the temperature contour. (e—h) is the temperature field evolution. Time represents the evolution time with respect to the initial model. The age of overriding plate is 10 Ma, whereas the subducting plate is 100 Ma. The internal friction coefficient of the mantle lithosphere is 0.1. |
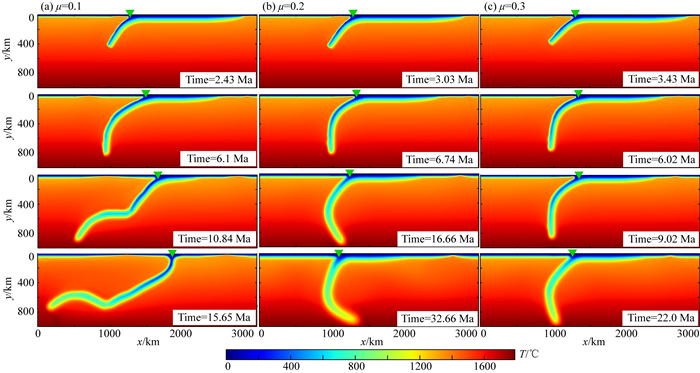
在参考模型的基础上, 我们通过改变俯冲板块的岩石圈内摩擦系数改变板块的强度.该参数控制了物质的塑性形变, 从而影响板块的有效黏滞系数.前人研究和岩石力学实验均表明该参数具有较大不确定性, 并且受水、矿物粒径大小等因素的影响极大.为了探讨这一因素的影响, 我们将大洋岩石圈的塑性内摩擦系数分别设置为0.1, 0.2, 0.3.在不同摩擦系数情况下研究俯冲板块在上地幔的形态演化.在俯冲板块为100 Ma, 上覆板块为10 Ma的模型中, 可以明显观测到岩石圈强度对俯冲过程演化的影响.在岩石圈摩擦系数为0.1时(图 4a), 俯冲板块强度较小, 当俯冲板块前端到达地幔转换带时, 俯冲板块发生强烈的弯曲变形, 最终滞留在地幔转换带中.整个大洋俯冲过程中, 海沟持续后撤.对于摩擦系数为0.2和0.3的模型(图 4b, c), 由于板块强度大, 不容易弯曲变形, 俯冲板块与660 km不连续面呈较大角度穿过.在俯冲开始阶段, 海沟后撤.之后在俯冲板块与地幔转换带相互作用过程中, 海沟静止或略微前进.

|
图 4 俯冲板块强度的影响 (a)俯冲板块内摩擦系数为0.1;(b)俯冲板块内摩擦系数为0.2;(c)俯冲板块内摩擦系数为为0.3. T代表温度, 单位为℃.俯冲板块年龄为70 Ma, 上覆板块为10 Ma. Fig. 4 Influence of subducting plate strength (a) Internal friction coefficient of mantle is 0.1; (b) Internal friction coefficient of mantle is 0.2; (c) Internal friction coefficient of mantle is 0.3. T represents temperature, unit is ℃. The age of subducting plate is 70 Ma, whereas overriding plate is 10 Ma. |
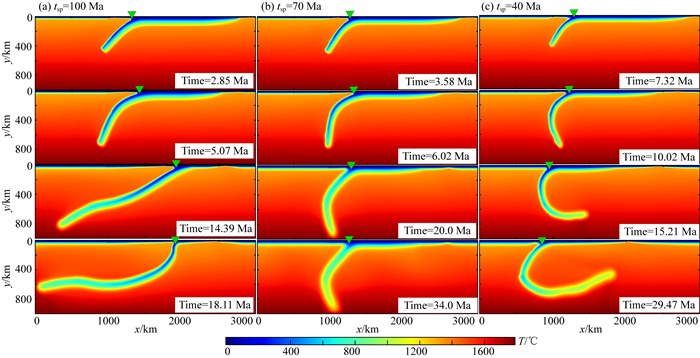
前人研究表明较老俯冲板块的密度较大, 从而容易使海沟后撤, 俯冲板块滞留在660 km不连续界面(Capitanio, 2013; Garel et al., 2014; Ribe, 2010).年龄较大的板块由于产生的负浮力大, 从而俯冲速度快, 海沟后撤速度也快.相对于年轻板块而言, 较老俯冲板块强度也大, 在地幔难以发生复杂变形.为了探讨俯冲板块年龄这一因素的影响, 我们在参考模型基础上, 分别将俯冲板块的年龄设置为40 Ma, 70 Ma, 100 Ma.岩石圈的摩擦系数为0.3.模型演化如图 5所示, 我们展示了40 Ma, 70 Ma, 100 Ma的俯冲板块随时间的演化序列.具体而言, 俯冲板块年龄为100 Ma时候, 俯冲板块具有较大的负浮力, 板块以较快速度沉入到软流圈地幔.在开始的5~6 Ma, 俯冲角度较大.当俯冲板块前端到达660 km不连续面时, 俯冲角度明显变小.整个俯冲过程中, 俯冲板块变形弯曲程度很小.总之, 对于100 Ma的俯冲板块而言, 其强度和厚度都大, 板块相对以稳定的俯冲角度斜插入地幔转换带, 然后停滞在地幔转换带,整个演化过程以海沟后撤为主.对于70 Ma的俯冲板块, 其俯冲速度相对较慢, 俯冲板块始终保持高角度的俯冲模式, 并穿过地幔转换带.海沟在整个过程中都相对稳定.前人研究认为与660 km不连续面成高角度的俯冲板块易于穿过660 km界面, 这与本文是一致的.而40 Ma的俯冲板块(见图 5c), 其俯冲过程则与前二者具有明显差别.在经历7~8 Ma的演化后, 俯冲板块开始到达地幔转换带.由于年轻板块相对强度低, 岩石圈厚度小, 当俯冲板块与660 km界面接触时, 板块开始回卷, 发生强烈变形.最终形成如图 5c所示形态, 停滞在地幔转换带.整个过程, 除在最初阶段海沟略为后撤, 其他阶段均以海沟前进为特征.

|
图 5 俯冲板块年龄的影响 (a—c)分别对应俯冲板块年龄为100 Ma, 70 Ma, 40 Ma, 上覆板块均为10 Ma.岩石圈地幔的内摩擦系数sinφ=0.3. Fig. 5 Influence of the age of subducting plate (a—c) Corresponds to the subducting plate age of 100 Ma, 70 Ma, and 40 Ma. The age of overriding plate is 10 Ma. Internal friction coefficient sinφ is 0.3. |
模型结果显示,俯冲板块在上地幔的几何形态受到俯冲板块年龄和俯冲板块的塑性强度影响.图 6总结了数值模型中俯冲板块在地幔转换带中的各种不同形态.总体上, 俯冲板块越年轻, 在与地幔转换带的作用过程中越容易变形弯曲, 倾向于形成前进型的海沟.板块塑性强度越大, 越不容易弯曲变形, 从而形成相对单一的形态.俯冲板块年龄越老,越容易形成后撤型的海沟.无论是海沟运动或者俯冲板块的几何形态, 都是受控于俯冲板块在上地幔受力状态.因此, 板块在上地幔的动力学过程和形态可利用板块的受力分析来做进一步解释.

|
图 6 俯冲板块在地幔转换带的形态 横轴为俯冲板块强度, 纵轴为俯冲板块年龄. Fig. 6 Subducting plate mophrologies in mantle transition zone The vertical axis is the age of subducting plate, whereas horizontal axis represents the strength of subducting plate. |
对于俯冲至地幔深度处的大洋板片而言, 其受力可以分为驱动力和阻力(Li and Ribe, 2012; Li et al., 2019).驱动力主要是较老、较冷的板块与相对热的软流圈地幔之间的密度差而产生的负浮力.当俯冲板块达到410 km不连续界面时, 由于该界面处橄榄石到瓦兹利石的相变是放热反应(克拉伯龙斜率为正), 相变导致板块密度增加从而也会产生俯冲驱动力.俯冲板块的阻力主要包括上覆板块的耦合力、自身克服弯曲产生的阻力、地幔剪切阻力以及660 km不连续界面产生的阻力.由于俯冲板块在俯冲带界面与上覆板块相接触, 所以在该界面处会产生阻力.具体地,上覆板块越厚, 对俯冲板块的阻力越大.俯冲板块俯冲过程中会产生弯曲, 克服弯曲的阻力与板块自身厚度和黏度有关.板块的厚度和黏度越大, 其越不容易弯曲, 从而产生的阻力越大.而软流圈地幔对俯冲板块的阻力主要与地幔黏度和俯冲板块速度相关, 俯冲板块速度越大, 地幔黏度越大, 则地幔产生的黏滞阻力越大.当俯冲板块接触到660 km不连续界面, 该界面是上下地幔的界线, 具有负的克拉伯龙斜率, 为吸热反应.冷的俯冲板块延迟相变,从而产生正浮力.同时由于下地幔黏度大,板块在660 km界面也会受到很大阻力.俯冲板块的年龄增加会使得板块自身负浮力增加, 但是同时也增加板块克服弯曲的阻力.这是较老的板块一般在上地幔不发生复杂变形的主要原因.
4.3 与前人结果的对比Stegman等(2010a)和Ribe(2010)的研究都表明强度较大的板块容易形成海沟前进型俯冲带.我们的模型实验显示板块强度的增加有利于海沟的前进或者静止,与前人研究结果相吻合.Goes等(2017)统计了全球俯冲带处海沟运动方向与地幔转换带中俯冲板片几何形态.统计数据显示板片滞留现象一般都与海沟后撤密切相关,而板片穿越地幔转换带则发生在具有前进型海沟的俯冲带区域.另外,本文数值模拟结果揭示了俯冲板片与地幔转换带角度大小显著制约其在上地幔的几何形态,并进而影响海沟的运动状态.具体而言,海沟后撤的模型中俯冲板块与地幔转换带呈较小角度, 最终导致板片滞留在地幔转换带处(见图 4a, 图 5a);海沟前进或者稳定的模型中,俯冲板块则与地幔转换带的角度普遍较大,有利于板片穿越地幔转换带,最后进入下地幔(图 4b, c, 图 5b).这也与Agrusta等(2017)的研究结果相一致.其数值模拟结果同样表明,相对于年轻的俯冲板块,较老的俯冲板块更容易导致海沟后撤及较低的俯冲角度.Liao等(2017)的研究结果也表明这种海沟后撤型和前进型的模式,也适用于大陆深俯冲过程,从而造成俯冲板块平缓或者陡峭,如帕米尔和兴都库什的大陆板块的相向俯冲.
4.4 地质对比与讨论地震层析成像结果显示现今大部分俯冲板块在上地幔形态与本文中海沟后撤型和海沟稳定型(图 7a, b)的一致.只有青藏高原地区俯冲板块的形态对应于海沟前进型(Goes et al., 2017; Schellart and Rawlinson, 2010; Stegman et al., 2010b).全球俯冲带大部分都是海沟后撤, 只有少部分是海沟相对稳定和海沟前进.对于青藏高原地区俯冲到地幔的板块呈现这种与本文中描述的海沟前进型对应的形态,这与印度板块之前的新特提斯板块向北俯冲过程中海沟的前进有关.前人研究表明,在过去50 Ma里该地区的海沟累计前进了1500 km (Goes et al., 2017; Hafkenscheid et al., 2006; Replumaz et al., 2004).进一步地利用详细的古地磁资料制约, 可能有助于更好地理解该问题.帕米尔和兴都库什的大陆板块的相向俯冲过程,海沟运动与俯冲板块的形态也与本文模拟结果类似(Liao et al., 2017).诚然,大洋板块的俯冲过程与大陆俯冲差异较大,特别是上覆板块.因此,将此类规律运用到大陆板块的俯冲过程可能需要更多更有力的地质证据.

|
图 7 俯冲板块形态与海沟运动关系示意图 (a)海沟后撤型;(b)海沟稳定型;(c)海沟前进型. Fig. 7 The morphologies of subducting plate and its relationships with trench motion (a) Trench retreat mode; (b) Stable trench mode; (c) Trench advance mode. |

|
图 8 (a) 地幔主要相变界面以及俯冲板块的受力分析(修改自Goes等(2017));(b)地幔矿物体积分数随深度的变化(根据Ito和Takahashi (1987)) Fig. 8 (a) Schematic mantle phase change interface and force analysis of subducting plate (Modified from Goes et al. (2017)); (b) Mantle mineral volume fraction varies with depth (Depends on Ito and Takahashi (1987)) |
对于西太平洋俯冲带, 如Alaska-Aleutian俯冲带,其现今海沟表现为微弱的后撤,俯冲板块形态近于海沟稳定型.Izu-Mariana-Bonin俯冲带等现今均具有前进型的海沟, 其俯冲到地幔的板块都与660 km界面成较大角度, 介于本文中海沟稳定型和海沟前进型之间.Tonga-Kermadec俯冲带海沟后撤速度可达3~15 cm·a-1(Schellart et al., 2011), 其俯冲板块表现为典型的海沟后撤型(见图 1剖面J-J′,K-K′).整个东太平洋安第斯俯冲带的海沟运动整体上表现为微弱的海沟后撤, 其速度约为0.2~1.6 cm·a-1,其俯冲板块形态基本为海沟后撤型到海沟稳定型的过渡(见图 1剖面O′-O, P′-P).因此, 我们的数值模拟结果能揭示海沟运动与俯冲板块形态之间的基本联系.当然, 数值模型简化了俯冲带的诸多影响因素, 模拟结果可能并不能完全与实际地球物理观测相吻合.在上述数值模型中,我们采用自由俯冲的模型,俯冲仅由板块自身的重力所驱动,所有边界条件均为自由滑动.不同的边界条件可能对数值模拟的结果有重要影响.前人研究发现,当给俯冲板块施加一定速度时,速度越大越容易形成海沟前进型的俯冲模式从而俯冲板块穿过660 km不连续界面;速度越小则越容易形成海沟后撤型的俯冲模式从而俯冲板块停滞在660 km不连续界面(Shi et al., 2018).因此,不同的边界条件可以导致不同的模拟结果.但是,自由俯冲模拟结果仍能提供第一级的关键影响因素以及俯冲带各个过程的基本联系.
5 结论本文中我们探讨了在俯冲板块与地幔转换带的相互作用过程中, 板块俯冲、海沟运动和俯冲板块变形方式的演化特征, 以及这些动力学特征与俯冲板块在上地幔中变形形态的关系.我们通过结合数值模型和实际地球物理观测数据得到如下初步结论.
(1) 俯冲带的动力学演化过程由多种因素共同决定, 俯冲板块年龄越大越易于使板块滞留在660 km界面;俯冲板块的强度越大则使得俯冲板块倾向于穿越660 km界面.
(2) 俯冲板块与地幔转换带的相互作用对海沟运动的影响结果可以分为三种类型, 即海沟后撤型, 海沟前进型和海沟稳定型.
(3) 较小的海沟后撤速度促使俯冲板块穿过660 km界面;而较大的海沟后撤速度则有利于板块滞留在660 km界面.
致谢 感谢中山大学廖杰教授及另一位匿名审稿人详细审阅本文,并提出建设性意见.
Agrusta R, Goes S, Van Hunen J. 2017. Subducting-slab transition-zone interaction:stagnation, penetration and mode switches. Earth and Planetary Science Letters, 464: 10-23. DOI:10.1016/j.jpgl.2017.02.005 |
Billen M I. 2008. Modeling the dynamics of subducting slabs. Annual Review of Earth and Planetary Sciences, 36: 325-356. DOI:10.1146/annurev.earth.36.031207.124129 |
Capitanio F A. 2013. Lithospheric-age control on the migrations of oceanic convergent margins. Tectonophysics, 593: 193-200. DOI:10.1016/j.tecto.2013.03.003 |
CÍzková H, Van Hunen J, Van Den Berg A P, et al. 2002. The influence of rheological weakening and yield stress on the interaction of slabs with the 670 km discontinuity. Earth and Planetary Science Letters, 199(3-4): 447-457. DOI:10.1016/S0012-821X(02)00586-1 |
Crameri F, Schmeling H, Golabek G J, et al. 2012. A comparison of numerical surface topography calculations in geodynamic modelling:an evaluation of the 'sticky air' method. Geophysical Journal International, 189(1): 38-54. DOI:10.1111/gji.2012.189.issue-1 |
Fukao Y, Obayashi M. 2013. Subducted slabs stagnant above, penetrating through, and trapped below the 660 km discontinuity. Journal of Geophysical Research:Solid Earth, 118(11): 5920-5938. DOI:10.1002/2013JB010466 |
Garel F, Goes S, Davies D R, et al. 2014. Interaction of subducted slabs with the mantle transition-zone:a regime diagram from 2-D thermo-mechanical models with a mobile trench and an overriding plate. Geochemistry, Geophysics, Geosystems, 15(5): 1739-1765. DOI:10.1002/2014GC005257 |
Gerya T V, Yuen D A. 2003. Characteristics-based marker-in-cell method with conservative finite-differences schemes for modeling geological flows with strongly variable transport properties. Physics of the Earth and Planetary Interiors, 140(4): 293-318. DOI:10.1016/j.pepi.2003.09.006 |
Gerya T V, Yuen D A. 2007. Robust characteristics method for modelling multiphase visco-elasto-plastic thermo-mechanical problems. Physics of the Earth and Planetary Interiors, 163(1-4): 83-105. DOI:10.1016/j.pepi.2007.04.015 |
Gerya T V, Connolly J A D, Yuen D A. 2008. Why is terrestrial subduction one-sided?. Geology, 36(1): 43-46. DOI:10.1130/G24060A.1 |
Goes S, Agrusta R, Van Hunen J, et al. 2017. Subduction-transition zone interaction:a review. Geosphere, 13(3): 644-664. DOI:10.1130/GES01476.1 |
Hafkenscheid E, Wortel M J R, Spakman W. 2006. Subduction history of the Tethyan region derived from seismic tomography and tectonic reconstructions. Journal of Geophysical Research:Solid Earth, 111(B8): B08401. DOI:10.1029/2005JB003791 |
He L J. 2015. Thermal regime of the North China Craton:implications for craton destruction. Earth-Science Reviews, 140: 14-26. DOI:10.1016/j.earscirev.2014.10.011 |
Hu J S, Liu L J, Zhou Q. 2018. Reproducing past subduction and mantle flow using high-resolution global convection models. Earth and Planet. Phys., 2: 189-207. DOI:10.26464/epp2018019 |
Ito E, Takahashi E. 1987. Ultrahigh-Pressure Phase Transformations and the Constitution of the Deep Mantle: High-Pressure Research in Mineral Physics. A Volume in Honor of Syun-iti Akimoto, 221-229.
|
Ito E, Akaogi M, Topor L, et al. 1990. Negative pressure-temperature slopes for reactions formign MgSiO3 perovskite from calorimetry. Science, 249(4974): 1275-1278. DOI:10.1126/science.249.4974.1275 |
Karato S, Wu P. 1993. Rheology of the upper mantle:a synthesis. Science, 260(5109): 771-778. DOI:10.1126/science.260.5109.771 |
Karato S I, Riedel M R, Yuen D A. 2001. Rheological structure and deformation of subducted slabs in the mantle transition zone:implications for mantle circulation and deep earthquakes. Physics of the Earth and Planetary Interiors, 127(1-4): 83-108. DOI:10.1016/S0031-9201(01)00223-0 |
Katsura T, Ito E. 1989. The system Mg2SiO4-Fe2SiO4 at high pressures and temperatures:precise determination of stabilities of olivine, modified spinel, and spinel. Journal of Geophysical Research:Solid Earth, 94(B11): 15663-15670. DOI:10.1029/JB094iB11p15663 |
Kirby S H, Kronenberg A K. 1987. Rheology of the lithosphere:selected topics. Reviews of Geophysics, 25(6): 1219-1244. DOI:10.1029/RG025i006p01219 |
Leng W, Gurnis M. 2011. Dynamics of subduction initiation with different evolutionary pathways. Geochemistry, Geophysics, Geosystems, 12(12): Q12018. DOI:10.1029/2011GC003877 |
Li Z H, Ribe N M. 2012. Dynamics of free subduction from 3-D boundary element modeling. Journal of Geophysical Research:Solid Earth, 117(B6): B06408. DOI:10.1029/2012JB009165 |
Li Z H, Gerya T, Connolly J. 2019. Variability of subducting slab morphologies in the mantle transition zone:Insight from petrological-thermomechanical modeling. Earth-Science Reviews, 196: 102874. DOI:10.1016/j.earscirev.2019.05.018 |
Liao J, Gerya T, Thielmann M, et al. 2017. 3D geodynamic models for the development of opposing continental subduction zones:the hindu kush-pamir example. Earth and Planetary Science Letters, 480: 133-146. DOI:10.1016/j.jpgl.2017.10.005 |
Obayashi M, Yoshimitsu J, Nolet G, et al. 2013. Finite frequency whole mantle P wave tomography:improvement of subducted slab images. Geophysical Research Letters, 40(21): 5652-5657. DOI:10.1002/2013GL057401 |
Ranalli G. 1995. Rheology of the Earth. 2nd ed. Netherlands: Springer.
|
Replumaz A, Kárason H, Van Der Hilst R D, et al. 2004. 4-D evolution of SE Asia's mantle from geological reconstructions and seismic tomography. Earth and Planetary Science Letters, 221(1-4): 103-115. DOI:10.1016/S0012-821X(04)00070-6 |
Ribe N M. 2010. Bending mechanics and mode selection in free subduction:a thin-sheet analysis. Geophysical Journal International, 180(2): 559-576. DOI:10.1111/gji.2010.180.issue-2 |
Schellart W P. 2010. Evolution of subduction zone curvature and its dependence on the trench velocity and the slab to upper mantle viscosity ratio. Journal of Geophysical Research:Solid Earth, 115(B11): B11406. DOI:10.1029/2009JB006643 |
Schellart W P, Rawlinson N. 2010. Convergent plate margin dynamics:new perspectives from structural geology, geophysics and geodynamic modelling. Tectonophysics, 483(1-2): 4-19. DOI:10.1016/j.tecto.2009.08.030 |
Schellart W P, Stegman D R, Farrington R J, et al. 2011. Influence of lateral slab edge distance on plate velocity, trench velocity, and subduction partitioning. Journal of Geophysical Research:Solid Earth, 116(B10): B10408. DOI:10.1029/2011JB008535 |
Sheng J, Liao J, Gerya T. 2016. Numerical modeling of deep oceanic slab dehydration:implications for the possible origin of far field intra-continental volcanoes in northeastern China. Journal of Asian Earth Sciences, 117: 328-336. DOI:10.1016/j.jseaes.2015.12.022 |
Shi Y N, Wei D P, Li Z H, et al. 2018. Subduction mode selection during slab and mantle transition zone interaction:numerical modeling. Pure and Applied Geophysics, 175(2): 529-548. DOI:10.1007/s00024-017-1762-0 |
Stegman D R, Farrington R, Capitanio F A, et al. 2010a. A regime diagram for subduction styles from 3-D numerical models of free subduction. Tectonophysics, 483(1-2): 29-45. DOI:10.1016/j.tecto.2009.08.041 |
Stegman D R, Schellart W P, Freeman J. 2010b. Competing influences of plate width and far-field boundary conditions on trench migration and morphology of subducted slabs in the upper mantle. Tectonophysics, 483(1-2): 46-57. DOI:10.1016/j.tecto.2009.08.026 |
Stern R J. 2002. Subduction zones. Reviews of Geophysics, 40(4): 1012. DOI:10.1029/2001RG000108 |
Turcotte D L, Schubert G. 2002. Geodynamics. 2nd ed. Cambridge: Cambridge University Press.
|
Wang Z S, Kusky T M, Capitanio F A. 2016. Lithosphere thinning induced by slab penetration into a hydrous mantle transition zone. Geophysical Research Letters, 43(22): 11567-11577. DOI:10.1002/2016GL071186 |
Zheng Y F, Chen Y X, Dai L Q, et al. 2015. Developing plate tectonics theory from oceanic subduction zones to collisional orogens. Science China Earth Sciences, 58(7): 1045-1069. DOI:10.1007/s11430-015-5097-3 |
Zheng Y F, Chen R X, Xu Z, et al. 2016. The transport of water in subduction zones. Science China Earth Sciences, 59(4): 651-681. DOI:10.1007/s11430-015-5258-4 |
Zhou C Y, Jin Z M, Zhang J F. 2010. Mantle transition zone:an important field in the studies of Earth's deep interior. Earth Science Frontiers (in Chinese), 17(3): 90-113. |
李忠海, 刘明启, Gerya T. 2015. 俯冲隧道中物质运移和流体-熔体活动的动力学数值模拟. 中国科学:地球科学, 45(7): 881-899. |
郑永飞, 陈伊翔, 戴立群, 等. 2015. 发展板块构造理论:从洋壳俯冲带到碰撞造山带. 中国科学:地球科学, 45(6): 711-735. |
郑永飞, 陈仁旭, 徐峥, 等. 2016. 俯冲带中的水迁移. 中国科学:地球科学, 46(3): 253-286. |
周春银, 金振民, 章军锋. 2010. 地幔转换带:地球深部研究的重要方向. 地学前缘, 17(3): 90-113. |
 2019, Vol. 62


