2. 中国科学院大学, 北京 100049;
3. 中国地质调查局青岛海洋地质研究所, 青岛 266071;
4. 中国地质调查局滨海湿地生物地质重点实验室, 青岛 266071;
5. 中国海洋大学海洋地球科学学院, 海底科学与探测技术教育部重点实验室, 青岛 266100;
6. 国家海洋局第一海洋研究所, 青岛 266061;
7. 南方科技大学海洋科学与工程系, 深圳 518055;
8. 青岛海洋科学与技术国家实验室海洋地质过程与环境功能实验室, 青岛 266237
2. University of Chinese Academy of Sciences, Beijing 100049, China;
3. China Geological Survey, Qingdao Institute of Marine Geology, Qingdao 266071, China;
4. Key Laboratory of Coastal Wetland Biogeosciences, China Geological Survey, Qingdao 266071, China;
5. Key Laboratory of Submarine Geosciences and Prospecting Techniques, MOE, College of Marine Geosciences, Ocean University of China, Qingdao 266100, China;
6. The First Institute of Oceanography, SOA, Qingdao 266061, China;
7. Southern University of Science and Technology, Department of Ocean Science and Engineering, Shenzhen 518055, China;
8. Laboratory for Marine Geology and Environment, Qingdao National Oceanography Laboratory for Marine Science and Technology, Qingdao 266237, China
三角洲是海陆相互作用的地带,由河流搬运的物质在河口处沉积形成顶尖向陆的三角洲沉积体,其规模和性质取决于河流的规模、蓄水体动力的强弱以及可容纳空间的变化(Reading, 1978).三角洲既包含河流输送带来的陆源信息(Li et al., 2012),也包含海洋控制的海平面升降等信息(Zhang et al., 2018),因此具有重要的环境气候意义.
黄河三角洲是我国三大重要的三角洲之一,位于渤海莱州湾,是典型的河控三角洲.20世纪80年代,随着油气资源开发和三角洲开发的进展,黄河三角洲的研究也越来越受到重视.目前对黄河三角洲研究主要包括三角洲形成演化机制以及三角洲沉积物记录的区域环境演化两大类.对于黄河三角洲的形成机制,前人主要研究了河道闾尾摆动特点(庞家珍和司书亨, 1982;庞家珍, 1994)、三角洲朵叶划分(庞家珍和司书亨, 1979;薛春汀, 1994)、黄河三角洲的演化和结构及动力过程(Prior et al., 1986;成国栋等, 1986;王爱华和业治铮, 1990)、三角洲的冲淤变化(尹延鸿, 2003; Cui and Li, 2011; Bi et al., 2014; Zhang et al., 2018)以及废弃三角洲的侵蚀(Jiang et al., 2017)等.在环境演化方面,前人对沉积物矿物成分、粒度及沉积环境等进行了详细的研究,如陈小英等(2006)及任韧希子(2012)对黄河三角洲沉积物粒度分布规律进行分析,通过中值粒径、粘土及砂和粉砂的相对含量论述了不同沉积环境的粒度分异.近年来,对于黄河三角洲重金属污染物的监测也取得一定进展,Wang等(2017b)对主要的重金属污染物含量进行测量,认为黄河三角洲主要重金属污染物为Pb、Cu、Hg、As.
河口三角洲沉积物的研究往往受限于定年的精度.对于较老的沉积物,常使用AMS14C定年方法,而现代黄河三角洲距今只有一百多年历史,14C定年并不敏感(Somayajulu et al., 1999).对于这种百年尺度的沉积物测年,目前最常用的方法为210Pb、137Cs放射性同位素定年(Pennington et al., 1973; Appleby and Oldfield, 1978; Mishra et al., 1975; Milan et al., 1995; Zhou et al., 2016).但业渝光等(1987)、李凤业等(1991)、成国栋等(1995)及王福等(2006)均发现:由于受到波浪、风暴等动力作用影响,黄河三角洲大部分地区的210Pb不适用于沉积速率和年龄的测定.此外,前人还根据分流河道的活跃时间及沉积层序进行定年(薛春汀等, 2009),但这种方法对短尺度沉积物存在很大局限性.
沉积物中磁性矿物携带的沉积剩磁是构建磁性地层的主要剩磁类型,传统方法利用岩石和沉积物中记录的地磁场非周期性倒转信息来划分地层,进而构建长序列沉积物年龄格架.但是该方法不适合沉积速率较快的近代沉积物.地磁场长期变化是地球内部原因造成的地球磁场变化,可以反映地磁场百年甚至年尺度上的变化(郭凤霞等, 2007).如Frank等(2002)对比了孟加拉湾三个钻孔的古地磁记录,重建了4400年以来孟加拉湾的地磁场长期变化;Zheng等(2015)对东海沉积物进行研究,重建了4 ka以来的古地磁长期变化曲线,并将东海与东亚其他地区不同记录进行对比,构建了东亚的地球磁场长期变化模式,确定东海沉积物的年龄.但目前尚无利用此方法对现今百年尺度内的沉积物进行定年的报道,因此,本文拟尝试利用地磁场长期变化对黄河三角洲近代沉积物进行定年.
另外,前人在对黄河三角洲的研究中采取的主要研究方法包括矿物成分分析、粒径、粘土矿物、碎屑矿物、以及地球化学元素分析等.但是目前利用环境磁学方法对黄河三角洲沉积物开展的研究工作较少.而环境磁学方法具有快捷、经济、无破坏性等优点,被成功地应用于粉尘、黄土、河流、湖泊及海洋沉积物的环境演化研究(Torrent et al., 2010; Liu et al., 2012; Lascu and Plank, 2013; Hatfield et al., 2013; Duan et al., 2014; Wang et al., 2016; Roza et al., 2016; Suk, 2016; Kars et al., 2017; Shi et al., 2017b).且磁性矿物对环境过程敏感,在三角洲环境研究中具有潜在的应用价值.
因此,为了完善河口区的定年方法,并进一步研究三角洲沉积物的成分特点及动力作用对沉积物的改造作用,本研究采用磁学方法,对位于黄河三角洲的Z07孔沉积物进行研究,主要包括:(1)分析利用地球磁场长期变化进行地层定年的可行性;(2)根据环境磁学参数随深度的变化,分析物源和后期改造对沉积物的影响.
1 区域背景黄河是中国的第二长河,全长5464 km,流域面积达75万平方公里,年均输沙量8.42亿吨,以水少沙多,水沙异源,河道改道频繁,淤积快著称于世.黄河多年平均径流量达到448.2亿立方米,降水主要集中于7、8月,汛期输水量占全年60~70%(成国栋等, 1986).近6000年来,黄河下游经历过数次自然或人为改道,每次改道对应一个三角洲堆积体.现代黄河三角洲是我国三大河口三角洲之一,它位于渤海湾和莱州湾的湾口,于1855年黄河自渤海入海改道后形成.黄河三角洲是典型的河控三角洲,河流搬运的沉积物在河口迅速堆积,沉积物的来源主要为兰州至头道拐水文站之间的黄土高原区(Pan et al., 2016).与此同时,河口的波浪、潮汐、风暴潮也对三角洲的地貌有塑造作用.黄河三角洲处潮汐复杂,为不规则半日潮,清水沟河口平均潮差为1.1~1.5 m,潮流流速随季节变化,春季高值区范围小,流速小;夏季高值区范围及流速明显增大;风向受我国季风影响,冬季由蒙古—西伯利亚冷气团影响,多为东北风和西北风,风速强;夏季受副热带高压外沿影响,多为南风,风速较低;波浪受风向影响,冬季为北向浪,夏季为南向浪(成国栋和薛春汀, 1997).余流的流向为冬季向北,夏季向南,流速0.1~0.25 m·s-1 (Zhang et al., 1990).
黄河的造陆速率取决于来水来沙量,自20世纪70年代起,输沙量和水流量呈逐年下降的趋势(Cui et al., 2014).根据距离黄河入海口最近的水文站—利津站的水文观测结果和遥感图像分析:自1976年黄河改道至清水沟入海以来,黄河三角洲近些年经历了快速堆积—进积与侵蚀平衡-缓慢侵蚀-缓慢进积的过程(Cui and Li, 2011).入海的泥沙量下降,黄河三角洲造陆速度减慢,河流对三角洲的控制作用减弱,由进积建造转为侵蚀作用为主.三角洲保持冲淤平衡的输沙量临界值为2.45亿吨,若来沙量小于这个数值,则三角洲会不断蚀退,这将对三角洲的生态环境和石油开采造成极大影响(李希宁等, 2001).黄河的输沙量输水量下降的原因主要包括人为因素和气候因素,其中人为因素占主导地位(Shi et al., 2017a),如修建水库蓄水(许烔心和孙季, 2003; Xia et al., 2016),在黄土高原区修建梯田、植树造林、调水调沙等(Bi et al., 2014).气候因素同样是影响输水输沙的重要原因,在全球变暖的气候背景下,黄土高原区的降水逐年下降,水通量下降也造成输沙量下降(Shi et al., 2017b;许烔心, 2003).
黄河三角洲的沉积相包括三角洲平原、三角洲前缘、三角洲侧缘和前三角洲,每一种沉积相有不同的沉积特征和动力作用,沉积物整体趋势从近岸向远端由粗变细,整体以粉砂质为主.其沉积的影响因素包括河流的来水来沙、水动力条件、气候以及生物扰动等,越靠近河口区受河流影响越显著(周良勇等, 2014).
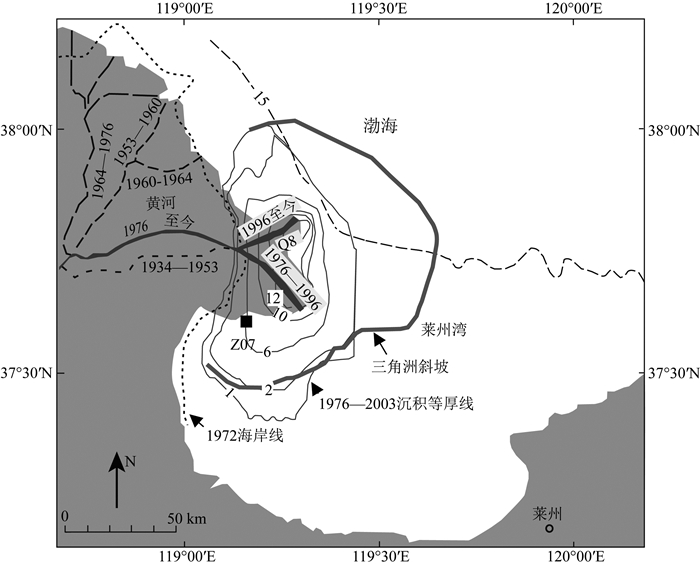
2 材料和方法 2.1 实验材料本研究所用的样品取自黄河三角洲的Z07钻孔(37°31′53″N, 119°10′34″E)(图 1).岩芯全长2.5 m,前期研究导致0~45 cm段和210~250 cm段样品缺失.在实验室里,用规格为2 cm×2 cm×2 cm的无磁性塑料盒连续定向取样,并同时在与塑料盒等位处采集少量散样,取塑料盒中间位置的对应深度作为样品编号.
|
图 1 黄河三角洲地理位置及Z07钻孔位置(修改自Zhou et al., 2016) Fig. 1 Location of the Yellow River Delta and Hole Z07 (after Zhou et al., 2016) |
本研究的所有磁学实验均在中国科学院地质与地球物理研究所古地磁与年代学实验室完成.
实验步骤如下:(1)使用捷克AGICO公司生产的Kappabridge MFK1-FA磁力仪完成高频磁化率(χhf)、低频磁化率(χlf)(高低频所用频率分别为976 Hz和15616 Hz)和磁化率各向异性(AMS)测量.利用公式χfd%=(χlf- χhf)/ χlf×100%计算出频率磁化率百分比,并计算了磁各向异性度(P=K1/K3)、磁线理(L=K1/K2)和磁面理(F=K2/K3)等参数(其中,K1、K2、K3分别是磁化率各向异性椭球的最大轴、中间轴以及最小轴);(2)交变退磁实验在2G-760超导磁力仪上进行,对样品的天然剩磁采用交变退磁方法进行逐步退磁,退磁步长分别为5 mT和10 mT;(3)对交变退磁后的样品进行非磁滞剩磁(ARM)的退磁测量,采用0.1 T的交变场和0.05 mT的直流场(DC),使样品获得ARM,之后对其进行系统交变退磁,退磁步骤与天然剩磁的交变退磁步骤一致,利用公式χARM=ARM/DC对ARM进行归一化;(4)对样品施加正向1 T的磁场,使其获得1 T的等温剩磁,本文将其视为饱和等温剩磁(SIRM),随后分别对样品施加100 mT和300 mT的反向场,进行等温剩磁IRM-100 mT和IRM-300 mT的测量,根据实验结果计算出S-ratio、HIRM等参数,计算公式为S-ratio=-IRM-300 mT/SIRM×100%,HIRM=(SIRM+IRM-300 mT)/2.以上所有的剩磁测量均在无磁空间中进行.
对散装样品,首先在实验室中进行装盒、低温烘干,然后使用Micromag 3900振动样品磁力仪对其进行磁滞回线、IRM获得曲线、一阶反转曲线(FORCs)等岩石磁学实验.磁滞回线设定最大外加磁场为1 T,测量得到饱和磁化强度(Ms)、饱和剩磁(Mrs)、矫顽力(Bc)以及剩磁矫顽力(Bcr)等信息.一阶反转曲线最大外加场为1 T,测量步长为5 mT,每条FORC由120条子曲线组成.
高温磁化率随温度的变化曲线(χ-T)使用MFK1-FA磁力仪及其CS-3温度控制系统中进行测量,由室温25 ℃逐步加热至700 ℃,升温梯度为2 ℃/min,为了避免样品氧化,升温实验在氩气环境中完成.
低温剩磁的加热曲线在低温磁测量系统MPMS中测量,在零场中降温至20 K,使其在2.5 T的外场下获得SIRM,在零场中逐步升温至300 K测量磁矩随温度的变化,升温梯度为5 K.
3 结果 3.1 磁性矿物特征 3.1.1 磁性矿物的组成χ-T曲线可以用于判断样品所含磁性矿物的成分和粒度等信息(Liu et al., 2005).图 2显示所有样品的χ-T曲线具有一致的特征,升温曲线的磁化率在450 ℃开始上升,并在500 ℃左右达到最高点.随后磁化率在580 ℃降低,是典型的磁铁矿特征.580 ℃之后,磁化率继续下降并在680 ℃降至最低点,说明样品中含有少量赤铁矿成分.降温曲线明显高于升温曲线,说明在加热过程中发生了矿物转化,生成了更多的强磁性矿物,根据居里温度判断该矿物为磁铁矿.

|
图 2 代表样品的低温剩磁曲线及高温磁化率曲线(χ-T) Fig. 2 Temperature dependence curves of low temperature remanence and high temperature magnetic susceptibility for selected samples |
低温实验在矿物成分判断上较高温实验有更大的优势,避免了样品在加热过程中产生的矿物转化,因此可以获得更准确的分析结果.不同深度样品的低温剩磁曲线十分相似(图 2),所有样品曲线均在120 K发生Verwey转换,均可以识别出磁铁矿的信号(Verwey, 1939; Kissel et al., 2017).
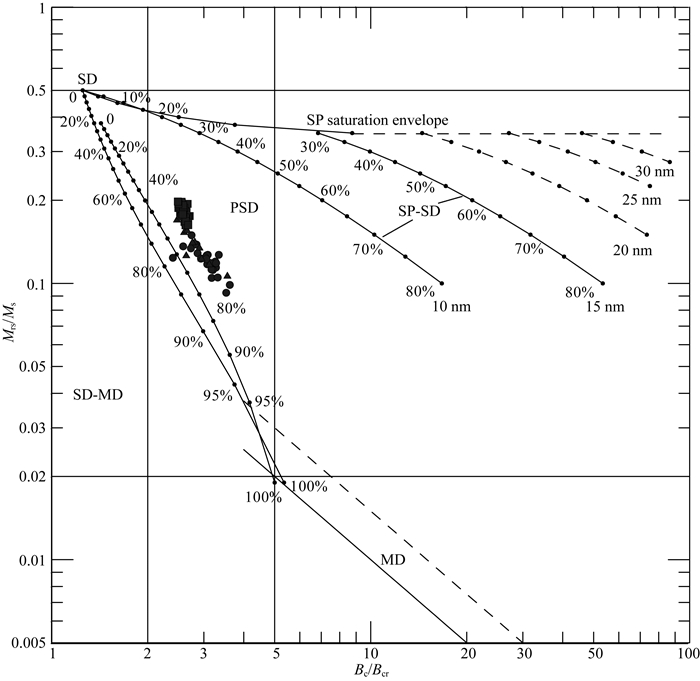
3.1.2 磁性矿物粒径特征不同深度样品的磁滞回线(图 3)均在400 mT闭合,说明载磁矿物为低矫顽力矿物,在进行顺磁校正前高场部分有一定斜率,说明含有顺磁性矿物.将Mrs/Ms和Bcr/Bc投至Day图中(Day et al., 1977; Dunlop et al., 2002a, 2002b),结果如图 4所示,所有的样品均投在准单畴(PSD)区域,说明样品中磁性矿物平均粒径主要在准单畴(PSD)范围内,将岩芯顶部、中部及底部的样品分别作图,可以看出不同部位的样品分布在Day图的不同位置,其中顶部样品明显比中部和底部样品细.

|
图 3 代表样品磁滞回线,其中灰色和黑色曲线分别为顺磁校正前后的结果 Fig. 3 Hysteresis loops for selected samples, gray and black lines represent the loops before and after paramagnetic adjustment, respectively |
|
图 4 Day氏图,其中实心正方形为岩芯顶部样品,实心三角形为中部样品,圆点为底部样品(Day et al., 1977;Dunlop, 2002a, 2002b) Fig. 4 Day-plot, the solid squares, triangles and circles represent samples from the top, the middle and the bottom of the core (after Day et al., 1977;Dunlop, 2002a, 2002b) |
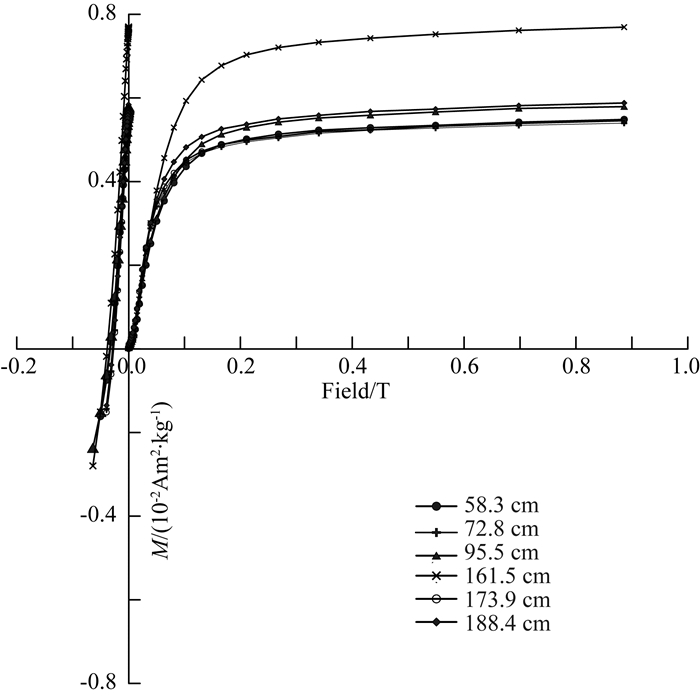
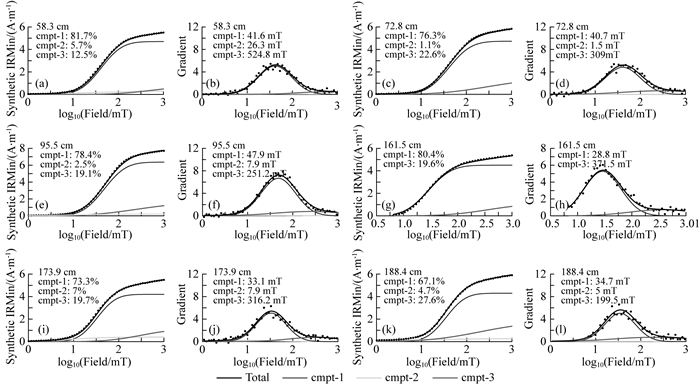
IRM获得曲线可以反映样品中矫顽力信息,由图 5中可以看出,所有成分均在200 mT即达到了饱和磁化强度的90%,样品向上有矫顽力增大的趋势.由于矫顽力的变化是由多种原因造成的,为了判断矫顽力变化的原因,将IRM获得曲线进行分解(Heslop et al., 2002; Egli, 2003).分解曲线显示样品包含三种磁性矿物成分(图 6),其中矫顽力最小的成分仅有1.5~10 mT,该组分可认为是MD组分.其他两种主要成分中,一种的矫顽力在30 mT左右,另一种在300~500 mT之间,可以确定两种矿物分别为磁铁矿和高矫顽力矿物,结合χ-T曲线可以确认这一高矫顽力成分为赤铁矿.在这两种成分中磁铁矿含量占绝对优势.在分解各段IRM获得曲线后,得到不同样品中磁铁矿矫顽力的变化,图中所示的a,b和c样品的主成分矫顽力集中在40~50 mT,d,e和f三个样品主成分矫顽力降至25~35 mT.
|
图 5 代表样品的IRM获得曲线及反向场退磁曲线 Fig. 5 IRM acquisition curves and back field demagnetization of the IRM for selected samples |
|
图 6 代表样品的矫顽力谱分析 Fig. 6 IRM acquisition curves for selected samples |
FORCs图可以确定磁性矿物矫顽力的分布以及磁性矿物颗粒之间磁相互作用的强弱,而且还可以帮助区分磁性矿物的种类和磁畴状态(Roberts et al., 2000;秦华峰等, 2008).代表性样品的FORCs显示(图 7),a样品等值线沿纵轴分布较宽,矫顽力较小,表现出多畴(MD)颗粒的特征,同时沿横轴分布宽,因此a样品为多畴(MD)和单畴(SD)两种磁畴颗粒的混合.b、c、d三个样品的值线分布中心对应的矫顽力集中在10 mT,横轴两侧等值线发散程度低,并且表现出不对称的特征,可以认为是单畴(SD)与准单畴(PSD)颗粒的混合.e和f两个样品存在明显的两个中心的现象,中心矫顽力分别为2 mT和13 mT,可以认为是超顺磁(SP)颗粒和单畴(SD)颗粒的混合.

|
图 7 代表样品的一阶反转曲线(FORCs),采用Forcinel 1.18软件处理(Harrison and Feinburg, 2008),平滑参数(SF)为8 Fig. 7 FORCs diagrams for selected samples, processed using software Forcinel version 1.18 (Harrison and Feinburg, 2008) |
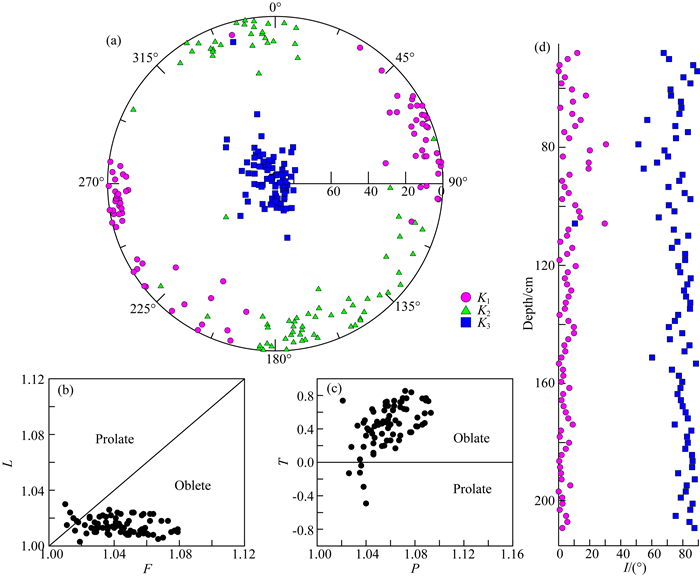
Z07孔的AMS结果如图 8所示,其磁面理与磁线理的比值F/L图及各向异性度与扁平率的比值P/T图显示大部分样品的磁线理(L)小于磁面理(F),形状参数(T)大于0,样品磁化率椭球以扁平形为主.最大轴(K1)沿水平面分布,最小轴(K3)垂直于水平面,是原生沉积组构的特点.最大轴(K1)倾角集中在0~10°之间,均值为6.25°,最小轴(K3)倾角垂直于层理面,倾角集中在70°~90°,平均值为77°.
|
图 8 Z07低频磁化率各向异性(AMS)结果 (a)磁化率长、中、短轴的偏角和倾角的下半球等面积投影;(b)磁线理(L=K1/K2)和磁面理(F=K2/K3)的相关图;(c)形状参数(T=(K2-K1-K3)/(K1-K3))和磁各向异性度(P=K1/K3)相关图. Fig. 8 Anisotropy of low-frequency magnetic susceptibility (AMS) results (a) Lower hemisphere equal-area projections of AMS data; (b) Plot of lineation (L) versus foliation (F); (c) Plot of shape parameter (T) versus anisotropy degree (P). |
AMS结果可以用来判断沉积后泥沙扰动存在的可能性(Marino and Ellwood, 1978),AMS结果显示,顶部样品的K3倾角大部分集中在80°至90°之间,为正常沉积,底部样品K3轴倾角集中于70°~90°之间,岩芯的磁性地层年龄可信度较高(Zhu et al., 2004).
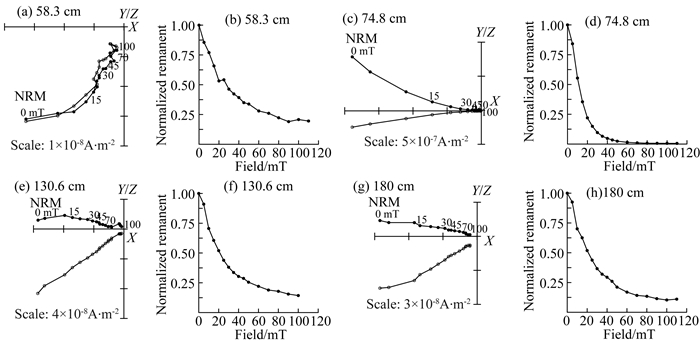
交变退磁结果显示,样品在退磁过程中,剩磁方向稳定地趋向原点,部分样品为单分量特征,也有部分样品为双分量,这部分样品在退磁场为20 mT之后可获得稳定的单一剩磁组分(Zijderveld, 1967;图 9).将交变退磁强度数据进行归一化,结果显示中值退磁场均小于40 mT.80 mT的交变场一般能退掉80%以上的原始剩磁,有些样品可以达到95%以上,说明样品主要载磁矿物为磁铁矿,记录了原生剩磁的方向.沉积物记录的沉积剩磁采用主成分分析法,挑选20~80 mT之间至少四个连续点进行拟合,并将最大角偏差控制到15°以下,得到样品的特征剩磁方向.
|
图 9 Z07样品的交变退磁正交矢量图和交变退磁过程中剩磁衰减曲线,其中实心圆和空心圆分别代表水平和垂直投影图 Fig. 9 Orthogonal projections of progressive alternating field and remanence decay curves for AF demagnetization. The solid and open circles represent projection of the magnetization vector end point on the horizontal and vertical planes |
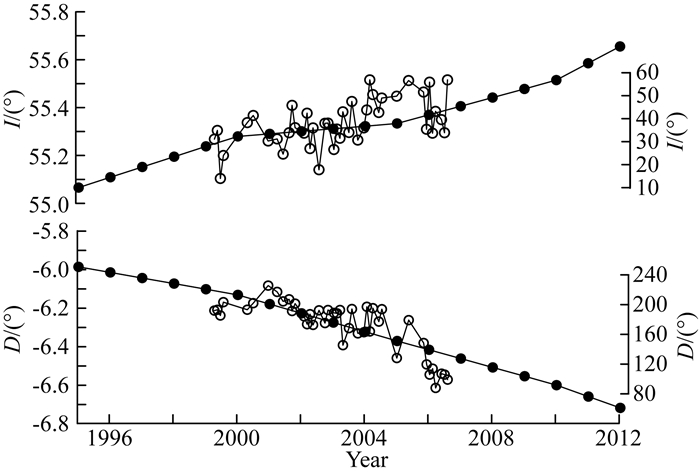
利用沉积剩磁记录进行定年的方法是将样品携带的磁倾角和磁偏角记录同模型计算得到的磁偏角与磁倾角进行相关性分析.如果相关性良好,则说明沉积物记录的剩磁与理论古地磁场数据有良好的一致性,可用来定年(Frank et al., 2002; Usapkar et al., 2016).国际地磁参考场IGRF(International Geomagnetic Reference Field)模型是描述全球地磁场及其长期变化的通用全球地磁场标准模型,本文中使用的是2014年国际地磁学与高空物理学协会(IAGA)发布的第十二代地磁场参考模型,通过模型计算得到采样点的年际磁偏角、磁倾角理论值(Finlay et al., 2015; Thébault et al., 2015).
Z07站位所处的位置属于快速沉积区,根据图 1中水深测量的结果绘制沉积等厚线,1976—2003年沉积厚度约为6 m,计算得到1976—2003年间平均沉积速率约为22 cm·a-1,并简化分析,将此处视为匀速沉积.利用沉积速率对Z07站位进行初步定年,0 m处为取钻时间2012年,沉积速率为22 cm·a-1,则可以根据每个样品对应的深度计算出各自的年龄.计算公式为: t=2012-h/22,其中t为样品年龄,h为样品对应深度.
由于该区域沉积快速,一块样品(2 cm)的时间跨度约为0.09 a,而经由IGRF模型计算出的理论地磁场值为年际变化,因此在进行相关性分析时需获得更精细的理论地磁场值.
具体定年的步骤如下:
(1) 根据水深测量的结果(图 1),该站位1976—2003年的沉积厚度约为6 m,沉积速率约为22 cm·a-1.Z07钻孔全长2.5 m,根据这一数据推测,沉积时间约为11 a,即2001—2012年.
(2) 利用IGRF模型计算出Z07沉积时间段内的古地磁数据,考虑到定年可能存在的误差,提高拟合计算的精确度,取得1995—2012年的地磁数据,计算得到趋势线公式(如图 10 a, b).趋势线公式为:

|

|
图 10 (a) 采样点磁倾角随时间变化曲线及拟合曲线;(b)采样点磁偏角随时间变化曲线及拟合曲线;(c) R随时间变化及其拟合曲线 Fig. 10 (a) Curve of inclination variation with time and its fitting curve; (b) Curve of declination variation with time and its fitting curve; (c) Curve of correlation coefficient versus time and its fitting curve |
其中I为磁倾角,D为磁偏角,t为样品年龄.
将计算得到的样品年龄代入拟合公式中进行计算,得到对应的理论磁偏角及磁倾角值,将理论值与实测值进行相关性分析.经过计算,磁偏角的理论值与实测值相关性RD=0.8,磁倾角理论值与实测值的相关性RI=0.54,相关性均大于0.5,这意味着理论值与实测值具有相关关系.
(3) 为了消除误差的影响,以0.5 a为间隔前后调整样品年龄,再次带入拟合公式进行计算,并计算相关性系数.将磁偏角的相关性系数RD和磁倾角的相关性系数RI计算得到

|
式中R为磁倾角的相关性系数与磁偏角综合相关性系数,t为标记年龄.
利用这一图表计算出相关性最好的年龄,将这一年龄作为岩芯的年龄,即岩芯取样范围年龄为1999-03—2006-06 A.D.(图 11).
|
图 11 Z07孔磁性地层年代,其中实心点为IGRF-12模型计算得到的地磁场理论值,对应左侧纵坐标,空心点为磁倾角及磁偏角实测值,对应右侧纵坐标 Fig. 11 Magnetostratigraphic framework of the cores, the filled points represent the inclination and declination data calculated by IGRF-12. The open points represent inclination and declination data measured by AFD demagnetized, respectively, corresponding to the right coordinate |
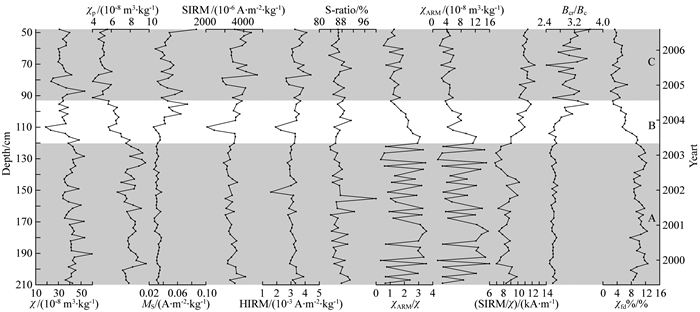
Z07钻孔磁学参数随深度变化曲线如图 12所示.根据磁性特征的不同将钻孔样品以122 cm和95 cm为分界从下至上分为A、B、C三段,A段为124~209 cm,以χfd%、ARM变化幅度大为特点;B段为95~122 cm,频率磁化率和χARM逐渐增大,SIRM逐渐减小,是上下段的过渡;C段深度为48~95 cm,以低χARM、低χfd%为主要识别特征.
|
图 12 环境磁学参数随深度变化图 Fig. 12 Vertical profiles of magnetic parameters of Z07 Hole |
|
|
表 1 环境磁学参数在各段中最大值、最小值和平均值变化 Table 1 The maximum and minimum and mean of magnetic parameters |
A段样品的χ介于3.39~5.96×10⁻⁷m3·kg-1之间,平均值为4.22×10⁻⁷m3·kg-1,表征磁性矿物含量的参数SIRM则处于整个岩芯的低值,均值为3.33×10⁻³Am2·kg-1.频率磁化率均值为10.31%,说明SP颗粒含量较多.代表SD颗粒含量的χARM最小值为4×10⁻⁷m3·kg-1,最大值为16×10-7m3·kg-1,波动幅度大,与χARM相关的参数均存在这一特点.岩芯的S-ratio均值为87%,表征硬磁性矿物含量的HIRM均值为3.07×10⁻³Am2·kg-1.
B段是A、C之间的过渡段,体现了A段特征向C段特征转变的过程.B段样品χ和SIRM呈现相反的变化,χ向上减小,均值为3.54×10⁻⁷m3·kg-1,而SIRM向上增大,在110 cm处有一极小值,二者变化趋势的差异反映了粒径和含量变化对χ的双重控制作用.χfd%呈现显著减小的趋势,均值达到7.29%.Ms的值较底部有所增加,磁性矿物含量增大. χARM波动幅度显著减小,说明SD颗粒的含量有所减少.HIRM有所增大,但S-ratio均值依然为87%,较下部变化不大,可以认为硬磁性矿物含量增加但所占比例没有变化.
C段样品的χfd%平均值降至3.89%,SP颗粒物质显著减少;χ处于低值,均值为3.41×10⁻⁷m3·kg-1,SIRM增大,均值达到3.71×10⁻³ Am2·kg-1,χ与SIRM出现反向变化的趋势,这说明样品中细粒成分的减少对磁化率的影响(Maher, 1988; Maher and Taylor, 1988).C段χARM减小,并趋于稳定.HIRM增大,高矫顽力成分继续增多,但S-ratio均值为86.8%,三个部分S-ratio均没有明显变化,硬磁性矿物成分的相对含量没有明显变化.
综合以上各参数的变化特征,岩芯整体磁性矿物以低矫顽力的磁铁矿为主,硬磁性矿物的相对含量变化不大,SP/SD颗粒含量较丰富.由下至上磁性矿物含量增加,SP颗粒含量减少.
4 讨论 4.1 年龄框架连续稳定的沉积序列是记录地球磁场长期变化的良好介质,目前对于海相、湖相及黄土序列的地球磁场长期变的记录研究较多(Verosub et al., 1986; Lund, 1996; Hyodo et al., 1999;朱日祥等, 2000),在三角洲沉积物中的适用性以及在十年尺度的定年中适用性亟待解决.
根据1987—2003年的水深测量记录(图 1)(Bi et al., 2010),可以得到Z07孔的沉积速率约为22 cm·a-1,大致确定Z07岩芯的顶部及底部年龄,以此作为定年的基础.在这一年代框架内,IGRF模型计算出的理论地磁场与实测结果进行相关分析,磁偏角与磁倾角的相关系数RD和RI分别达到0.8与0.54,均有较好的相关性,说明古地磁定年方法在短尺度沉积物中应用具有一定可行性,但可靠性仍有待进一步检验.
沉积物在沉积过程中,磁性颗粒会沿外场方向定向排列,这部分剩磁称为沉积剩磁(Tauxe, 1993; Tauxe et al., 2005),沉积后,由于压实作用以及孔隙间颗粒的旋转,会对沉积剩磁记录造成影响,比如磁倾角变浅(King, 1955; Anson and Kodama, 1987).本文Z07孔的沉积速率很大,研究结果发现古地磁倾角的测量结果比模型预测结果偏小,这说明压实作用对近代沉积物已经造成倾角变浅的影响,但是二者的变化趋势基本一致.本研究作为一种新定年方法的尝试,取得了较好的结果,但在三角洲等区域的普遍适用性还需要进一步研究和证明.
4.2 环境意义探讨环境磁学参数由下至上的变化显示了铁磁性矿物增多、SP成分减少的变化趋势,底部含有较多SP成分.
对沉积物中磁性矿物而言,其主要影响因素包括物源、沉积动力及沉积后的自生变化.磁性特征显示细颗粒磁铁矿保存良好,且FORC图及χ-T曲线结果均显示没有铁硫化物生成,因此可以认为岩芯的磁学性质变化没有受到沉积后作用的影响.排除了成岩作用对磁学参数的影响,可以认为沉积物的磁学特征是原生特征.
黄河于1996年经人为改道至Q8入海口(图 1),黄河输送的沉积物大部分淤积在河口区,其余粒度较细的泥沙向南北输送,冬季盛行风风向为北风,泥沙向南输送为主,而在夏季,三角洲区盛行风风向为南风,黄河向南输送的泥沙主要由洪水季潮流引起的余流所控制.表层沉积物的再悬浮作用在河口区也十分常见,但并非占主导作用(Liang et al., 2007;Qiao et al., 2011),因此可以认为向南搬运的沉积物均是来自于河口直接输送.研究区所处的旧河口由于没有河流来源物质直接供应,沉积物的供应主要来源于潮流搬运,附近的主要河流包括弥河、小清河和黄河.根据前人的研究,弥河和小清河对黄河三角洲的贡献有限(Li et al., 2017),因此,钻孔区沉积物的主要来源为黄河输送的沉积物,显示出典型的黄河沉积物的特征,即磁性矿物主成分为磁铁矿,SP含量高.由于黄河改道后原清水沟河口遭到废弃,受到海水侵蚀,岸线不断向后退缩(Zhou et al., 2015),这部分旧河口沉积物经过侵蚀搬运,也构成研究区物质来源.可以认为研究区沉积物主要包括黄河的输入和旧河口侵蚀两个来源.
由于近些年黄河水沙通量的不断减少,中国政府对黄河实施了调水调沙工程(李国英, 2002),前三次调水调沙处于试验阶段,分别发生于2002年7月、2003年9月及2004年6月,分别历时11天、12.4天和24天,从2005年开始调水调沙开始进入正式应用阶段.在2002年以前的非调水调沙时期,黄河悬沙的主要源区为黄河中游的黄土区,在运移过程中其粒度较粗的组分会沉入河床,造成分选,因此入海的泥沙较细.自调水调沙实施以来,这一工程对沉积物的性质造成显著影响,不仅造成了下游河道沉积物的粒径粗化,也对黄河口近岸沉积物的粒度造成影响(Miao et al., 2016; Wang et al., 2017a),同时调水调沙的过程造成下游河道冲刷,使黄河入海沙量也有所增加(Yu et al., 2013;龙跃等, 2017).由于调水调沙后,河流下游水动力增强,黄河输沙得到了补给,即河道的粗粒沉积物在强水动力的作用下受到冲刷,无法沉积下来.对比黄河中下游分界线的花园口站(河南郑州)和黄河下游最后一个水文站利津站(山东东营)的记录,利津站的悬沙中值粒径大于花园口的悬沙中值粒径,悬沙含量也明显高于花园口站,这说明黄河下游的河道成为新的黄河悬沙的来源,也改变了调水调沙前黄河输入泥沙全部来自黄河中游的特征(龙跃等, 2017).对比调水调沙实施前后的黄河口输沙输水量,由于气候变化、人为影响等原因,调水调沙前的水沙通量处于较低值,并且呈现逐年下降的趋势.在调水调沙实施之后,下游河道冲刷强烈,利津站观测到的黄河的水沙输入量有明显的增多,每年约带来1亿吨的额外输沙量(Wang et al., 2017a).
Z07钻孔沉积物的ARM及χfd参数可以反映SD/SP颗粒的含量,在岩芯中有很明显的变化.将χ、ARM、χfd等参数做相关图,图 13a显示,A段样品中,χ与χfd有良好的相关性,相关系数达到0.622;而对于B和C段样品其相关系数只有0.2,不受SP控制.图 13b显示对于所有样品χ与Ms有良好的线性关系.这说明磁性矿物的特征受到磁性矿物含量的控制,在A段SP组分对磁性特征有较大影响,这种影响在B段和C段并不明显.图 13c中相关图可以看出A段样品分散成两个不同的端元.图 13d中χfd与ARM相关图显示出两种不同特征的组分:高χfd和ARM组分和低ARM和χfd组分.C段样品ARM及χfd均处于低值,SD/SP含量均较低,B段则显示出了过渡特征.图 13c、13d两相关图显示了岩芯整体SD/SP成分的分异特征,顶部SD/SP含量较低,底部SD/SP含量较高,并显示出两种分量,是一种典型的非均匀沉积.FORC图结果显示(图 7),顶部样品中以SD颗粒为主导,MD/ PSD颗粒含量增多,SP颗粒含量减少,底部以SD/SP为主,并且样品中磁性矿物含量有所增加.根据定年的结果显示,Z07孔的环境磁学参数出现转折的年份约为2003年前后,SD/SP成分减少,MD/PSD成分有所增加,这一磁性矿物粒径产生变化的原因可能是调水调沙之后黄河来源沉积物的粗化造成.调水调沙实施后,下游河床受到侵蚀,这一新增的沉积物来源对Z07钻孔的磁性矿物粒度特征造成影响,同时也造成了磁性矿物含量的增加.此外,由于调水调沙的进行,黄河季节性输入的特征被削弱,由原先的雨季占全年输沙量的87%,变为现在的77%(Yang et al., 2017),并且全年均有输入,这一变化导致Z07钻孔由下部沉积物特征的非均匀性,向上转变为沉积物的均匀性沉积.

|
图 13 (a) 磁化率与频率磁化率相关图,r1和r2分别代表了A段样品和C段样品中磁化率与频率磁化率的相关度;(b)磁化率与饱和磁化强度相关图;(c)磁化率与非磁滞剩磁相关图;(d)频率磁化率与非磁滞剩磁相关图,圆圈代表三个不同端元成分 Fig. 13 Bi-plots of (a) frequency dependent susceptibility (χfd) versus magnetic susceptibility (χ), r1 and r2 represent the relevancy between χ and χfd of samples from A and C respectively; (b) saturation magnetization (Ms) versus χ; (c) anhysteretic remanent magnetization (ARM) versus χ; (d) ARM versus χfd, three circles represent three different elements |
通过对位于黄河三角洲的Z07孔的磁学研究,发现其沉积剩磁的磁偏角和磁倾角实测值与IGRF-12模型计算出的理论值有很好的相关性,变化趋势一致,说明潮滩沉积物可以作为一种地球磁场长期变的记录载体,并且这种定年方法在十年尺度内的沉积物中也可以得到有效应用.
本研究中使用的岩芯由于沉积物的性质变化小,因此在识别沉积相等方面提供的信息较少,而环境磁学由于对环境反应极为敏感,因此可以用来研究沉积环境的细微变化.岩芯以磁铁矿为主要载磁矿物,SP颗粒含量较丰富,继承了黄土源区的特征.磁学参数变化主要体现在磁性矿物粒度上,矿物粒度由下至上逐渐变粗,细粒成分含量逐渐减少,同时磁性矿物总含量有一定增加.
根据地磁场长期变化记录提供的年代框架,沉积物形成的大致年代为1999-03—2006-06 A.D.,这一沉积时间段内,黄河改道至Q8口出海,原河口废弃,沉积物主要由潮流输送.Z07钻孔顶部磁性矿物SD/SP减少,粗粒成分增加,磁性矿物含量增加.这可能是对黄河实施调水调沙工程之后,黄河下游冲刷加剧,下游河床的粗粒沉积物加入补给,入海泥沙粗化,输沙量增多等现象的指示.
致谢 感谢编辑和两位匿名评审专家对本文提出的重要修改意见.
Anson G L, Kodama K P. 1987. Compaction-induced inclination shallowing of the post-depositional remanent magnetization in a synthetic sediment. Geophysical Journal International, 88(3): 673-692. DOI:10.1111/j.1365-246X.1987.tb01651.x |
Appleby P G, Oldfield F. 1978. The calculation of lead-210 dates assuming a constant rate of supply of unsupported 210Pb to the sediment. Catena, 5(1): 1-8. DOI:10.1016/S0341-8162(78)80002-2 |
Bi N S, Yang Z S, Wang H J, et al. 2010. Sediment dispersion pattern off the present Huanghe (Yellow River) subdelta and its dynamic mechanism during normal river discharge period. Estuarine, Coastal and Shelf Science, 86(3): 352-362. DOI:10.1016/j.ecss.2009.06.005 |
Bi N S, Wang H J, Yang Z S. 2014. Recent changes in the erosion-accretion patterns of the active Huanghe (Yellow River) delta lobe caused by human activities. Continental Shelf Research, 90: 70-78. DOI:10.1016/j.csr.2014.02.014 |
Chen X Y, Chen S L, Liu Y S. 2006. Sediment differentiation along nearshore zone of the Yellow river delta. Acta Sedimentologica Sinica (in Chinese), 24(5): 714-721. |
Cheng G D, Ren Y C, Li S Q, et al. 1986. Channel evolution and sedimentary sequence of modern Huanghe River Delta. Marine Geology & Quaternary Geology (in Chinese), 6(2): 1-15. |
Cheng G D, Ye Y G, Diao S B. 1995. 210Pb profile and redeposition of the Yellow River Delta. Marine Geology & Quaternary Geology (in Chinese), 15(2): 1-10. |
Cheng G D, Xue C T. 1997. Sedimentary Geology in Yellow River Delta (in Chinese). Beijing: Geological Publishing House.
|
Cui B L, Li X Y. 2011. Coastline change of the Yellow River estuary and its response to the sediment and runoff (1976—2005). Geomorphology, 127(1-2): 32-40. DOI:10.1016/j.geomorph.2010.12.001 |
Cui B L, Chang X L, Shi W Y. 2014. Abrupt changes of runoff and sediment load in the lower reaches of the Yellow River, China. Water Resources, 41(3): 252-260. DOI:10.1134/S009780781403004X |
Day R, Fuller M, Schmidt V A. 1977. Hysteresis properties of titanomagnetites: grain-size and compositional dependence. Physics of the Earth and Planetary Interiors, 13(4): 260-266. DOI:10.1016/0031-9201(77)90108-X |
Duan Z Q, Liu Q S, Yang X Q, et al. 2014. Magnetism of the Huguangyan Maar Lake sediments, Southeast China and its paleoenvironmental implications. Palaeogeography, Palaeoclimatology, Palaeoecology, 395: 158-167. DOI:10.1016/j.palaeo.2013.12.033 |
Dunlop D J. 2002a. Theory and application of the Day plot (Mrs/Ms versus Hcr/Hc) 1. Theoretical curves and tests using titanomagnetite data. Journal of Geophysical Research: Solid Earth, 107(B3): 2056. DOI:10.1029/2001JB000486 |
Dunlop D J. 2002b. Theory and application of the Day plot (Mrs/Ms versus Hcr/Hc) 2. Application to data for rocks, sediments, and soils. Journal of Geophysical Research: Solid Earth, 107(B3): 2057. DOI:10.1029/2001JB000487 |
Egli R. 2003. Analysis of the field dependence of remanent magnetization curves. Journal of Geophysical Research: Solid Earth, 108(B2): 2081. DOI:10.1029/2002JB002023 |
Finlay C C, Olsen N, Tøffner-Clausen L. 2015. DTU candidate field models for IGRF-12 and the CHAOS-5 geomagnetic field model. Earth, Planets and Space, 67: 114. DOI:10.1186/s40623-015-0274-3 |
Frank U, Schwab M J, Negendank J F W. 2002. A lacustrine record of paleomagnetic secular variations from Birkat Ram, Golan Heights (Israel) for the last 4400 years. Physics of the Earth and Planetary Interiors, 133(1-4): 21-34. DOI:10.1016/S0031-9201(02)00085-7 |
Guo F X, Zhang Y J, Yan M H. 2007. The secular variation characteristics and mechanisms of geomagnetic field. Chinese Journal of Geophysics (in Chinese), 50(6): 1649-1657. |
Harrison R J, Feinberg J M. 2008. FORCinel: An improved algorithm for calculating first-order reversal curve distributions using locally weighted regression smoothing. Geochemistry, Geophysics, Geosystems, 9(5): Q05016. DOI:10.1029/2008GC001987 |
Hatfield R G, Stoner J S, Carlson A E, et al. 2013. Source as a controlling factor on the quality and interpretation of sediment magnetic records from the northern North Atlantic. Earth and Planetary Science Letters, 368: 69-77. DOI:10.1016/j.epsl.2013.03.001 |
Heslop D, Dekkers M J, Kruiver P P, et al. 2002. Analysis of isothermal remanent magnetization acquisition curves using the expectation-maximization algorithm. Geophysical Journal International, 148(1): 58-64. DOI:10.1046/j.0956-540x.2001.01558.x |
Hyodo M, Yoshihara A, Kashiwaya K, et al. 1999. A Late Holocene geomagnetic secular variation record from Erhai Lake, southwest China. Geophysical Journal of the Royal Astronomical Society, 136(3): 784-790. DOI:10.1046/j.1365-246x.1999.00764.x |
Jiang C, Pan S Q, Chen S L. 2017. Recent morphological changes of the Yellow River (Huanghe) submerged delta: Causes and environmental implications. Geomorphology, 293: 93-107. DOI:10.1016/j.geomorph.2017.04.036 |
Kars M, Musgrave R J, Kodama K, et al. 2017. Impact of climate change on the magnetic mineral assemblage in marine sediments from Izu rear arc, NW Pacific Ocean, over the last 1 Myr. Palaeogeography, Palaeoclimatology, Palaeoecology, 480: 53-69. DOI:10.1016/j.palaeo.2017.05.016 |
King R F. 1955. The remanent magnetism of artificially deposited sediments. Geophysical Journal International, 7(S3): 115-134. |
Kissel C, Liu Z F, Li J H, et al. 2017. Magnetic signature of river sediments drained into the southern and eastern part of the South China Sea (Malay Peninsula, Sumatra, Borneo, Luzon and Taiwan). Sedimentary Geology, 347: 10-20. DOI:10.1016/j.sedgeo.2016.11.007 |
Lascu I, Plank C. 2013. A new dimension to sediment magnetism: Charting the spatial variability of magnetic properties across lake basins. Global and Planetary Change, 110: 340-349. DOI:10.1016/j.gloplacha.2013.03.013 |
Li C, Yang S Y, Zhang W G. 2012. Magnetic properties of sediments from major rivers, aeolian dust, loess soil and desert in China. Journal of Asian Earth Sciences, 45: 190-200. DOI:10.1016/j.jseaes.2011.10.010 |
Li F Y, Yuan W, Demaster D J. 1991. Profile model of 210Pb in the South China Sea, South Huanghai Sea and Bohai Sea. Marine Geology & Quaternary Geology (in Chinese), 11(3): 35-43. |
Li G Y. 2002. Water and sand diversion in the Yellow River. China Water Resource (in Chinese), 24(11): 29-33, 5. |
Li X N, Liu S G, Li C X. 2001. Analysis of critical value of inflow sediment for keeping the erosion and sedimentation balance in the Yellow River Delta. Yellow River (in Chinese), 23(3): 20-21. |
Li Y, Zhang H B, Tu C, et al. 2017. Magnetic characterization of distinct soil layers and its implications for environmental changes in the coastal soils from the Yellow River Delta. Catena, 162: 245-254. |
Liang B C, Li H J, Lee D. 2007. Numerical study of three- dimensional suspended sediment transport in waves and currents. Ocean Engineering, 34(11-12): 1569-1583. DOI:10.1016/j.oceaneng.2006.12.002 |
Liu Q S, Deng C L, Yu Y, et al. 2005. Temperature dependence of magnetic susceptibility in an argon environment: implications for pedogenesis of Chinese loess/palaeosols. Geophysical Journal International, 161(1): 102-112. DOI:10.1111/gji.2005.161.issue-1 |
Liu Q S, Roberts A P, Larrasoaña J C, et al. 2012. Environmental magnetism: Principles and applications. Reviews of Geophysics, 50(4): RG4002. DOI:10.1029/2012RG000393 |
Long Y, Wu X, Bi N S, et al. 2017. Evolution of active Yellow River (Huanghe) Delta under the water and sediment regulation scheme (WSRS). Marine Geology Frontiers (in Chinese), 33(3): 7-11. |
Lund S P. 1996. A comparison of Holocene paleomagnetic secular variation records from North America. Journal of Geophysical Research: Solid Earth, 101(B4): 8007-8024. DOI:10.1029/95JB00039 |
Maher B A. 1988. Magnetic properties of some synthetic sub-micron magnetites. Geophysical Journal International, 94(1): 83-96. DOI:10.1111/gji.1988.94.issue-1 |
Maher B A, Taylor R M. 1988. Formation of ultrafine-grained magnetite in soils. Nature, 336(6197): 368-370. DOI:10.1038/336368a0 |
Marino R J, Ellwood B B. 1978. Anomalous magnetic fabric in sediments which record an apparent geomagnetic field excursion. Nature, 274(5671): 581-582. DOI:10.1038/274581a0 |
Miao C Y, Kong D X, Wu J W, et al. 2016. Functional degradation of the water-sediment regulation scheme in the lower Yellow River: Spatial and temporal analyses. Science of the Total Environment, 551-552: 16-22. DOI:10.1016/j.scitotenv.2016.02.006 |
Milan C S, Swenson E M, Turner R E, et al. 1995. Assessment of the 137Cs method for estimating sediment accumulation rates: Louisiana salt marshes. Journal of Coastal Research, 11(2): 296-307. |
Mishra U C, Lalit B Y, Sethi S K, et al. 1975. Some observations based on the measurements on fresh fallout from the recent Chinese and French nuclear explosions. Journal of Geophysical Research, 80(36): 5045-5049. DOI:10.1029/JC080i036p05045 |
Pan B T, Pang H L, Gao H S, et al. 2016. Heavy-mineral analysis and provenance of Yellow River sediments around the China Loess Plateau. Journal of Asian Earth Sciences, 127: 1-11. DOI:10.1016/j.jseaes.2016.06.006 |
Pang J Z, Si S H. 1979. The evolution of the Yellow River estuary. Yellow River (in Chinese), (3): 30-42. |
Pang J Z, Si S H. 1982. Fluvial process of the Huanghe River estuary Ⅲ. influence of the evolution of the Huanghe River estuary on the lower reach. Oceanologia et Limnologia Sinica (in Chinese), 13(3): 218-224. |
Pang J Z. 1994. Fluvial process on the Huanghe River delta and its influence on lower reaches. Transaction of Oceanology and Limnology (in Chinese), (3): 1-9. |
Pennington W, Tutin T G, Cambray R S, et al. 1973. Observations on Lake Sediments using Fallout 137Cs as a Tracer. Nature, 242(5396): 324-326. DOI:10.1038/242324a0 |
Prior D B, Yang Z S, Bornhold B D, et al. 1986. The subaqueous delta of the modern Huanghe (Yellow River). Geo-Marine Letters, 6(2): 67-75. DOI:10.1007/BF02281642 |
Qiao S Q, Shi X F, Saito Y, et al. 2011. Sedimentary records of natural and artificial Huanghe (Yellow River) channel shifts during the Holocene in the southern Bohai Sea. Continental Shelf Research, 31(13): 1336-1342. DOI:10.1016/j.csr.2011.05.007 |
Qin H F, Liu Q S, Pan Y X. 2008. The first-order reversal curve (FORC) diagram: Theory and case study. Chinese Journal of Geophysics (in Chinese), 15(3): 743-751. |
Reading H G. 1978. Sedimentary Environments and Facies. Amsterdam: Elsevier.
|
Ren R X Z. 2012. Sedimentary characteristics and environment evolution of the Yellow River Delta 〖Ph. D. thesis〗. Shanghai: East China Normal University.
|
Roberts A R, Pike C R, Verosub K L. 2000. First-order reversal curve diagrams: A new tool for characterizing the magnetic properties of natural samples. Journal of Geophysical Research: Solid Earth, 105(B12): 28461-28475. DOI:10.1029/2000JB900326 |
Roza J, Jackson B, Heaton E, et al. 2016. Paleomagnetic secular variation and environmental magnetism of Holocene-age sediments from Tulare Lake, CA. Quaternary Research, 85(3): 391-398. DOI:10.1016/j.yqres.2016.03.007 |
Shi H L, Hu C H, Wang Y G, et al. 2017a. Analyses of trends and causes for variations in runoff and sediment load of the Yellow River. International Journal of Sediment Research, 32(2): 171-179. DOI:10.1016/j.ijsrc.2016.09.002 |
Shi M N, Wu H C, Roberts A P, et al. 2017b. Tectonic, climatic, and diagenetic control of magnetic properties of sediments from Kumano Basin, Nankai margin, southwestern Japan. Marine Geology, 391: 1-12. DOI:10.1016/j.margeo.2017.07.006 |
Somayajulu B L, Bhushan R, Sarkar A, et al. 1999. Sediment deposition rates on the continental margins of the eastern Arabian Sea using 210Pb, 137Cs and 14C. Science of the Total Environment, 237-238: 429-439. DOI:10.1016/S0048-9697(99)00155-2 |
Suk D. 2016. Environmental conditions for the presence of magnetofossils in the Last Glacial Maximum inferred from magnetic parameters of sediments from the Ulleung Basin, East Sea. Marine Geology, 372: 53-65. DOI:10.1016/j.margeo.2015.12.009 |
Tauxe L. 1993. Sedimentary records of relative paleointensity of the geomagnetic field: Theory and practice. Review of Geophysics, 31: 319-354. DOI:10.1029/93RG01771 |
Tauxe L, Steindorf J L, Harris A. 2005. Depositional remanent magnetization: toward an improved theoretical and experimental foundation. Earth and Planetary Science Letters, 244(3-4): 515-529. |
Thébault E, Finlay C, Beggan C D, et al. 2015. The International Geomagnetic Reference Field: the twelfth generation. Earth, Planets and Space, 67: 79. DOI:10.1186/s40623-015-0228-9 |
Torrent J, Liu Q S, Barrón V. 2010. Magnetic minerals in Calcic Luvisols (Chromic) developed in a warm Mediterranean region of Spain: Origin and paleoenvironmental significance. Geoderma, 154(3-4): 465-472. DOI:10.1016/j.geoderma.2008.06.020 |
Usapkar A, Dewangan P, Badesab F K, et al. 2016. High resolution Holocene paleomagnetic secular variation records from Bay of Bengal. Physics of the Earth and Planetary Interiors, 252: 49-76. DOI:10.1016/j.pepi.2016.01.004 |
Verosub K L, Mehringer P J Jr, Waterstraat P. 1986. Holocene secular variation in western North America: Paleomagnetic record from Fish Lake, Harney County, Oregon. Journal of Geophysical Research: Solid Earth, 91(B3): 3609-3623. DOI:10.1029/JB091iB03p03609 |
Verwey E J W. 1939. Electronic conduction of magnetite (Fe3O4) and its transition point at low temperatures. Nature, 144(3642): 327-328. |
Wang A H, Ye Z Z. 1990. Framework, developing processes and sedimentary model of the modern Huanghe River Delta. Marine Geology & Quaternary Geology (in Chinese), 10(1): 1-12. |
Wang F, Wang H, Li J F, et al. 2006. Current Study of 210Pb and 137Cs geochronology in the Circum-Bohai Sea Region. Geological Review (in Chinese), 52(2): 244-250. |
Wang H J, Wu X, Bi N S, et al. 2017a. Impacts of the dam-orientated water-sediment regulation scheme on the lower reaches and delta of the Yellow River (Huanghe): A review. Global and Planetary Change, 157: 93-113. DOI:10.1016/j.gloplacha.2017.08.005 |
Wang H Y, Song Y Q, Cheng Y, et al. 2016. Mineral magnetism and other characteristics of sediments from a sub-alpine lake (3080 m a. s. l.) in central east China and their implications on environmental changes for the last 5770 years. Earth and Planetary Science Letters, 452: 44-59. DOI:10.1016/j.epsl.2016.07.031 |
Wang Y, Ling M, Liu R H, et al. 2017b. Distribution and source identification of trace metals in the sediment of Yellow River Estuary and the adjacent Laizhou Bay. Physics and Chemistry of the Earth, Part A/B/C, 97: 62-70. DOI:10.1016/j.pce.2017.02.002 |
Xia X H, Dong J W, Wang M H, et al. 2016. Effect of water- sediment regulation of the Xiaolangdi reservoir on the concentrations, characteristics, and fluxes of suspended sediment and organic carbon in the Yellow River. Science of the Total Environment, 571: 487-497. DOI:10.1016/j.scitotenv.2016.07.015 |
Xu J X. 2003. Sediment fluxes to the sea as influenced by sediment delivery of the lower Yellow River. Oceanologia et Limnologia Sinica (in Chinese), 34(6): 663-670. |
Xu J X, Sun J. 2003. Influence of precipitation and human activities on water fluxes from the Yellow River into the sea in the past 50 years. Advances in Water Science (in Chinese), 14(6): 690-695. |
Xue C T. 1994. Division and recorgnition of modern Yellow River Delta lobes. Geographical Research (in Chinese), 13(2): 59-66. |
Xue C T, Ye S Y, Gao M S, et al. 2009. Determination of depositional age in the Huanghe Delta in China. Acta Oceanologica Sinica (in Chinese), 31(1): 117-124. |
Yang H B, Li E C, Zhao Y, et al. 2017. Effect of water-sediment regulation and its impact on coastline and suspended sediment concentration in Yellow River Estuary. Water Science and Engineering, 10(4): 311-319. DOI:10.1016/j.wse.2017.12.009 |
Ye Y G, Xue C D, Diao S B. 1986. 210Pb evidence of the lobe model in morden Huanghe River Delta. In: Seminar on the technical methods and results of young geological chronology of the isotope geology committee of the Chinese Geological Society (in Chinese).
|
Yin Y H. 2003. Erosion and silting-up and land-making rates of the modern Yellow River Delta coast. Marine Geology Letters (in Chinese), 19(7): 13-18. |
Yu Y G, Shi X F, Wang H J, et al. 2013. Effects of dams on water and sediment delivery to the sea by the Huanghe (Yellow River): The special role of Water-Sediment Modulation. Anthropocene, 3: 72-82. DOI:10.1016/j.ancene.2014.03.001 |
Zhang J, Huang W W, Shi M C. 1990. Huanghe (Yellow River) and its estuary: Sediment origin, transport and deposition. Journal of Hydrology, 120(1-4): 203-223. DOI:10.1016/0022-1694(90)90150-V |
Zhang W G, Xing Y, Yu L Z, et al. 2008. Distinguishing sediments from the Yangtze and Yellow Rivers, China: A mineral magnetic approach. The Holocene, 18(7): 1139-1145. DOI:10.1177/0959683608095582 |
Zhang X D, Yang Z S, Zhang Y X, et al. 2018. Spatial and temporal shoreline changes of the southern Yellow River (Huanghe) Delta in 1976—2016. Marine Geology, 395: 188-197. DOI:10.1016/j.margeo.2017.10.006 |
Zheng Y, Zheng H B, Deng C L, et al. 2015. Holocene paleomagnetic secular variation from East China Sea and a PSV stack of East Asia. Physics of the Earth and Planetary Interiors, 236: 69-78. |
Zhou L Y, Gao M S, Xu G, et al. 2014. Erosion and redeposition in tidal flats of the Yellow River delta: Result of tracer stick monitoring. Geological Bulletin of China (in Chinese), 33(10): 1602-1608. |
Zhou L Y, Liu J, Saito Y, et al. 2016. Modern sediment characteristics and accumulation rates from the delta front to prodelta of the Yellow River (Huanghe). Geo-Marine Letters, 36(4): 247-258. DOI:10.1007/s00367-016-0442-x |
Zhou Y Y, Huang H Q, Nanson G C, et al. 2015. Progradation of the Yellow (Huanghe) River delta in response to the implementation of a basin-scale water regulation program. Geomorphology, 243: 65-74. DOI:10.1016/j.geomorph.2015.04.023 |
Zhu R X, Liu Q S, Jackson M J. 2004. Paleoenvironmental significance of the magnetic fabrics in Chinese loess-paleosols since the last interglacial (< 130 ka). Earth and Planetary Science Letters, 221(1-4): 55-69. DOI:10.1016/S0012-821X(04)00103-7 |
Zhu R X, Guo B, Pan Y X, et al. 2000. Reliability of geomagnetic secular variations recorded in a loess section at Lingtai, north-central China. Science in China (Series D), 43(1): 1-9. |
Zijderveld J D A. 1967. A. C. demagnetization of rocks: analysis of results. Developments in Solid Earth Geophysics, 3: 254-286. |
陈小英, 陈沈良, 刘勇胜. 2006. 黄河三角洲滨海区沉积物的分异特征与规律. 沉积学报, 24(5): 714-721. DOI:10.3969/j.issn.1000-0550.2006.05.013 |
成国栋, 任于灿, 李绍全, 等. 1986. 现代黄河三角洲河道演变及垂向序列. 海洋地质与第四纪地质, 6(2): 1-15. |
成国栋, 业渝光, 刁少波. 1995. 黄河三角洲的210Pb剖面与再沉积作用. 海洋地质与第四纪地质, 15(2): 1-10. |
成国栋, 薛春汀. 1997. 黄河三角洲沉积地质学. 北京: 地质出版社.
|
郭凤霞, 张义军, 言穆弘. 2007. 地磁场长期变化特征及机理分析. 地球物理学报, 50(6): 1649-1657. DOI:10.3321/j.issn:0001-5733.2007.06.004 |
李凤业, 袁巍, Demaster D J, 等. 1991. 南海、南黄海、渤海210Pb垂直分布模式. 海洋地质与第四纪地质, 11(3): 35-43. |
李国英. 2002. 黄河调水调沙. 中国水利, 24(11): 29-33, 5. |
李希宁, 刘曙光, 李从先. 2001. 黄河三角洲冲淤平衡的来沙量临界值分析. 人民黄河, 23(3): 20-21. DOI:10.3969/j.issn.1000-1379.2001.03.011 |
龙跃, 吴晓, 毕乃双, 等. 2017. 黄河调水调沙影响下的现行三角洲叶瓣冲淤演化格局. 海洋地质前沿, 33(3): 7-11. |
庞家珍, 司书亨. 1979. 黄河河口演变初探. 人民黄河, (3): 30-42. |
庞家珍, 司书亨. 1982. 黄河河口演变——Ⅲ. 河口演变对黄河下游的影响.海洋与湖沼, 13(3): 218-224. |
庞家珍. 1994. 黄河三角洲流路演变及对黄河下游的影响. 海洋湖沼通报, (3): 1-9. |
秦华峰, 刘青松, 潘永信. 2008. 一阶反转曲线(FORC)图的原理及应用实例. 地球物理学报, 15(3): 743-751. DOI:10.3321/j.issn:0001-5733.2008.03.015 |
任韧希子. 2012.黄河三角洲沉积特征与环境演变研究〖博士论文〗.上海: 华东师范大学.
|
王爱华, 业治铮. 1990. 现代黄河三角洲的结构、发育过程和形成模式. 海洋地质与第四纪地质, 10(1): 1-12. |
王福, 王宏, 李建芬, 等. 2006. 渤海地区210Pb、137Cs同位素测年的研究现状. 地质论评, 52(2): 244-250. DOI:10.3321/j.issn:0371-5736.2006.02.015 |
许炯心. 2003. 黄河下游泥沙输移特征对入海泥沙通量的影响. 海洋与湖沼, 34(6): 663-670. DOI:10.3321/j.issn:0029-814X.2003.06.011 |
许烔心, 孙季. 2003. 近50年来降水变化和人类活动对黄河入海径流通量的影响. 水科学进展, 14(6): 690-695. DOI:10.3321/j.issn:1001-6791.2003.06.003 |
薛春汀. 1994. 现代黄河三角洲叶瓣的划分和识别. 地理研究, 13(2): 59-66. |
薛春汀, 叶思源, 高茂生, 等. 2009. 现代黄河三角洲沉积物沉积年代的确定. 海洋学报(中文版), 31(1): 117-124. DOI:10.3321/j.issn:0253-4193.2009.01.015 |
业渝光, 薛春汀, 刁少波. 1986.现代黄河三角洲瓣模式的210Pb证据.中国地质学会同位素地质专业委员会年轻地质年代学技术方法和成果讨论会.
|
尹延鸿. 2003. 现代黄河三角洲海岸的冲淤及造陆速率. 海洋地质动态, 19(7): 13-18. DOI:10.3969/j.issn.1009-2722.2003.07.002 |
周良勇, 高茂生, 徐刚, 等. 2014. 黄河三角洲潮滩的侵蚀和再沉积:示踪砂棒法的应用. 地质通报, 33(10): 1602-1608. DOI:10.3969/j.issn.1671-2552.2014.10.018 |
朱日祥, 郭斌, 潘永信, 等. 2000. 甘肃灵台黄土剖面记录地球磁场长期变化的可靠性探析. 中国科学(D辑), 30(3): 324-330. |
 2019, Vol. 62


