2. 中国科学院青海盐湖研究所, 盐湖资源综合高效利用重点实验室, 西宁 810008;
3. 中国科学院青海盐湖研究所, 青海省盐湖地质与环境重点实验室, 西宁 810008
2. Key Laboratory of Comprehensive and Highly Efficient Utilization of Salt Lake Resources, Qinghai Institute of Salt Lakes, Chinese Academy of Sciences, Xining 810008, China;
3. Qinghai Provincial Key Laboratory of Geology and Environment of Salt Lakes, Qinghai Institute of Salt Lakes, Chinese Academy of Sciences, Xining 810008, China
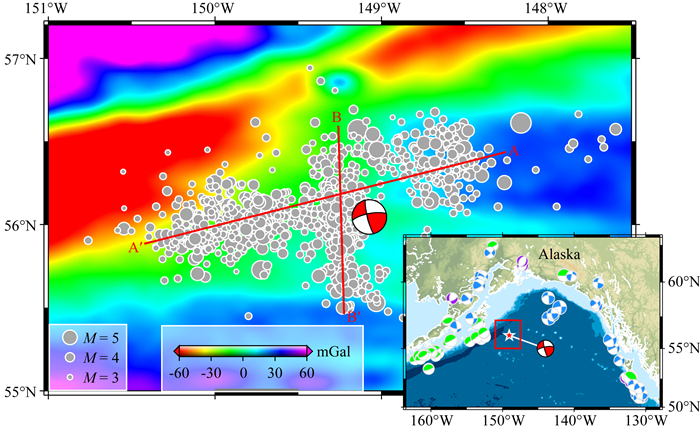
2018年1月23日,美国阿拉斯加湾海域发生了一次MW7.9大地震.根据美国地质调查局(USGS)国家地震信息中心(NEIC)发布的测定结果,此次地震震中位于56.046°N/149.073°W,震源深度为25.0 km,其余震呈非线型分布(图 1).此区域内自1976年以来未曾发生过6.0级及以上强震(Ekström et al., 2012).注意到此次地震的震中区海洋重力异常起伏明显,北部较低,而东部和南部较高(图 1)(Sandwell et al., 2014),且这一带的太平洋板块以~50—60 mm·a-1的速率向北美板块俯冲(Bird, 2003; DeMets et al., 2010).一般而言,俯冲带边界上容易发生逆冲型大地震(Simons et al., 2011; Avouac et al., 2015; Galetzka et al., 2015; Gusman et al., 2015),但根据USGS发布的W-phase矩张量解以及GCMT的矩心矩张量解(表 1),此次地震发生在陡倾角的走滑断层上且具有一定的非双力偶成分.
|
图 1 区域海洋重力异常(Sandwell et al., 2014)及2018年阿拉斯加湾MW7.9地震余震(ML≥2.5)分布 红色沙滩球表示主震震中位置及USGS给出的W-phase震源机制解,灰色圆圈表示震后两周内的余震(来自USGS).红色实线表示余震空间分布的最佳拟合.右下图展示了区域构造及1976年以来当地强震位置及其GCMT震源机制解.蓝色沙滩球表示走滑型地震,绿色沙滩球表示逆冲型地震,紫色沙滩球表示正断层型地震.红框表示主图区域. Fig. 1 Map-view of the regional marine gravity anomaly (Sandwell et al., 2014) and the spatial distribution of aftershocks (ML≥2.5) of the 2018 MW7.9 Gulf of Alaska earthquake The red beach ball refers to the epicenter location and USGS W-phase focal mechanism solution of the main shock, and the gray circles represent the aftershocks within the first two weeks (from the catalog of USGS). The red solid lines are used to show the strikes obtained by linearly fitting the aftershock locations. The subplot on the right bottom shows regional tectonics and focal mechanism solutions of the strong earthquakes with the GCMT focal mechanism solutions since 1976. Strike-slip events are in blue, thrust-slip in green and normal-slip in purple. The red box shows the area shown in the main figure. |
|
|
表 1 主震的震源机制 Table 1 Focal mechanisms of the main shock |
不可忽视的非双力偶成分以及余震的非线型分布特征似乎表明2018年阿拉斯加湾MW7.9地震可能具有复杂的震源结构和破裂过程.事实上, 近期基于远场地震、大地测量和海啸数据的分析给出了近乎相互垂直的4段模型(Lay et al., 2018),另一项基于远场地震和GPS资料的分析给出了5段模型(Ruppert et al., 2018),而基于地震和深海探测数据的解译则倾向于平行于俯冲带以及垂直于俯冲带的多个断层的共同参与(Krabbenhoeft et al., 2018).总而言之,复杂的震源结构是共识,但结构究竟如何则尚存争议.本研究中,我们首先利用视震源时间函数技术分析确定此次事件的总体破裂方向,然后结合余震的空间分布构建一个双断层模型,并基于双断层模型,利用远场P波和SH波联合反演此次地震的时空破裂过程.
1 视震源时间函数分析视震源时间函数分析是认识地震破裂总体特征的重要途径之一(Ammon et al., 2006a, 2006b; Lay et al., 2009).目前有多种方法可以用于提取视震源时间函数(Helmberger and Wiggins, 1971; Chen et al., 1991; Dreger, 1994; Bertero et al., 1997; Piana and Bertero, 1997; Kraeva, 2004),但由于在操作过程中PLD(Projected Landweber Deconvolution)方法便于添加因果约束和非负约束(Bertero et al., 1997; Lanza et al., 1999; Vallée, 2004; 张勇等, 2009, 而且计算效率较高(许力生等,2014;张旭和许力生,2015;张旭等,2016),所以我们采用这种方法.
使用的观测数据是从全球GSN(Global Seismographic Network)台网和FDSN(International Federation of Digital Seismograph Networks)台网选取的震中距为30°~90°、方位角为0°~360°的具有较好信噪比的99条垂直向远场P波记录.格林函数的计算采用反透射系数法(Wang, 1999)、ak135全球速度模型(Kennett et al., 1995; Montagner and Kennett, 1996)以及USGS发布的震源参数(震源位置:56.046°N/149.073°W/25.0 km.震源机制:节面Ⅰ,走向259°/倾角74°/滑动角10°;节面Ⅱ,走向166°/倾角80°/滑动角164°).观测资料和格林函数的频率均限制在0.01~0.05 Hz.
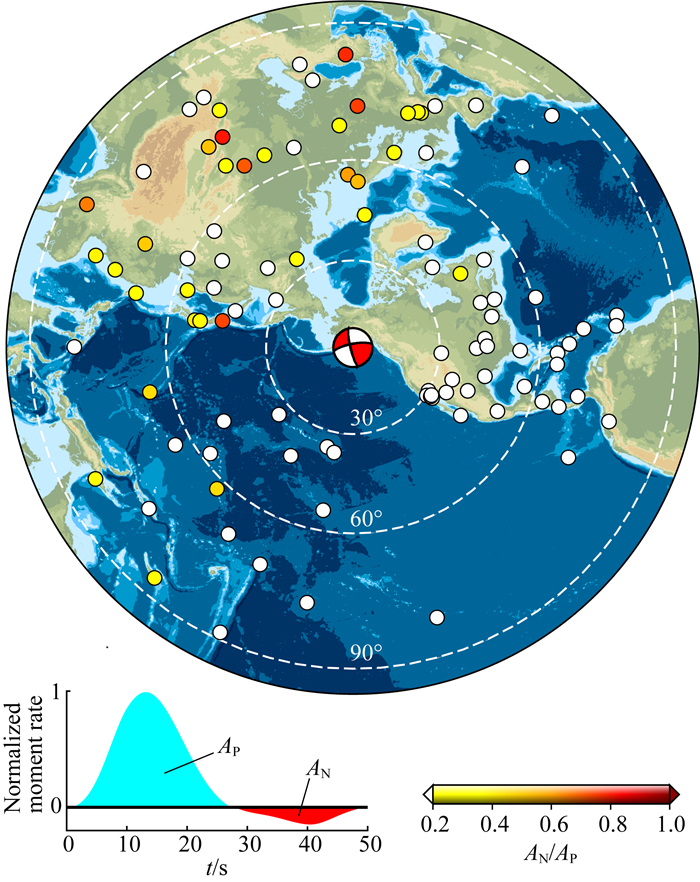
考虑到多断层破裂和/或震源机制变化都会造成在某些方位的视震源时间函数出现在物理上不可接受的负瓣效应(如, Lay et al., 2010),我们在提取视震源时间函数时并未添加非负约束.但为了确保视震源时间函数可靠性,我们引入了正负瓣面积比(AN/AP)(这里AN和AP分别表示负瓣和正瓣的面积),并经验性地以比值0.2为阈值对提取的视震源时间函数进行筛选.图 2展示了基于正负瓣面积比入选(白色)和丢弃(彩色)视震源时间函数的台站, 其中,在68个台站提取的视震源时间函数满足条件,丢弃的台站主要分布于约270°~360°方位.
|
图 2 远场台站分布及视震源时间函数负瓣与正瓣面积比的阐释 红色沙滩球表示主震震中位置及震源机制解.彩色实心圆表示远场台站分布,其中不同颜色表示视震源时间函数正负瓣面积比. Fig. 2 Distribution of the teleseismic stations and illustration of the AN/AP ratio The red beach ball indicates the epicenter location and focal mechanism of the main shock. The colored solid circles represent the stations, where color shows the ratio AN/AP. |
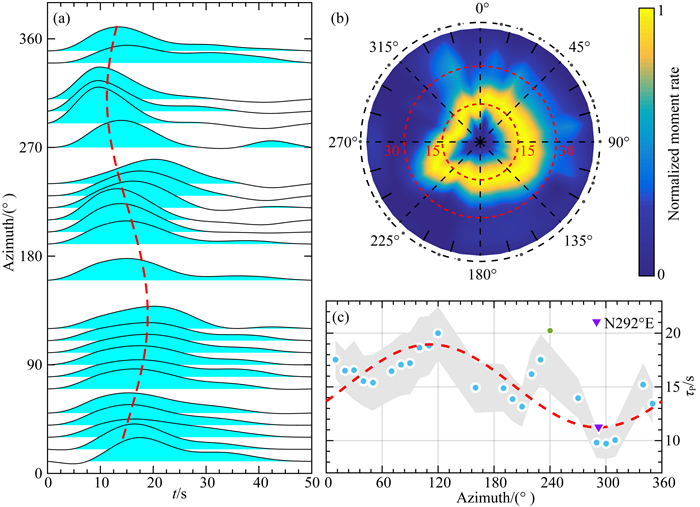
为了压制个别视震源时间函数的奇异形状对于确定总体破裂方向的影响,首先我们将所有视震源时间函数与其平均视震源时间函数进行相关性分析,并进一步经验性地放弃相关系数低于0.5的视震源时间函数.最终,另有4个视震源函数被放弃.然后我们将360°范围等间隔分割成36个区间,为每10°的方位间隔计算平均的视震源时间函数.如图 3a所示,这些平均视震源时间函数几乎均匀地覆盖了所有方位,其形状也表现出渐变的方位依赖性.为了使视震源时间函数的方位依赖性更直观,我们把图 3a中所示的视震源时间函数投影到如图 3b所示的极坐标中.这样,可以清楚地观察到不规则的高亮度环的形状呈现出明显的方位依赖性.注意:在约270°~360°范围内高亮度环的宽度变小,这与前面丢弃的台站所处的方位相同.
|
图 3 基于视震源时间函数方位依赖性的整体破裂方向估计 (a)依赖于方位的视震源时间函数,这里红色虚线即子图(c)中的红色虚线.(b)极坐标中的视震源时间函数,这里径向和切向分别表示时间和方位.红色虚线分别表示15 s和30 s的等时圈.(c)视震源时间函数峰值点时间随方位的变化以及整体破裂方向的最佳估计.垂直轴表示峰值点对应的时间,水平轴表示相应的方位.蓝色点为观测值,灰色条带为观测值的误差范围,红色虚线为最佳拟合曲线.其中,绿色圆圈表示由于观测时间与理论值偏差较大而未参与拟合的观测值. Fig. 3 The best estimation of the overall rupture azimuth based on the azimuth-dependent ASTFs (a) The azimuth-dependent ASTFs, where the red dashed curve is the same as that in subplot (c). (b) The ASTFs projected onto polar coordinate frame in which radial and tangential directions are time and azimuth, respectively. The red dashed circles indicate the times 15 s and 30 s, respectively. (c) Illustration of how to estimate the overall rupture azimuth. The vertical axis shows the observed arrival times of the peaks, and the horizontal one does the azimuths of the observation points. The blue dots represent the observed values and the gray belt shows the range of observation errors. The red dashed curve is the best fitting of the observed values. That green dot is an observed value abandoned in the fitting due to its singularity. |
为了定量估计此次地震的总体破裂方向,我们提取了图 3a中所有视震源时间函数峰值点的时间,并利用破裂方向性分析关系τP=τr-τccos(φ-φr)·sin(γ)(其中τP表示提取的峰值点对应的时间,φ表示台站方位,φr表示破裂方向,γ表示台站离源角,τr和τc表示待拟合的时间常量)对其进行拟合(Lay and Wallace, 1995; Park and Ishii, 2015).如图 3c所示,总体破裂方向被估计为N292°±21°E.注意:这与USGS震源机制解中最接近的节面走向(259°)也存在差异.
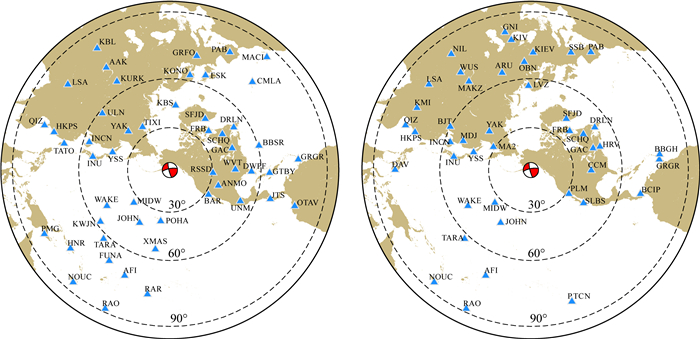
2 有限断层破裂模型我们从全球GSN台网和FDSN台网获取了震中距30°~90°范围内的远场台站,根据记录的信噪水平和空间分布的均匀性,如图 4所示,分别挑选了50条P波以及43条SH波.基于ak135全球速度模型(Kennett et al., 1995; Montagner and Kennett, 1996)以及USGS发布的震源参数信息,利用反透射系数法(Wang, 1999)分别合成相应台站处对应的P波和SH波理论格林函数.并对观测波形和合成理论格林函数均进行0.01~0.05 Hz的带通滤波.
|
图 4 主震震中及用于有限断层反演的台站分布 左图:P波台站分布.右图:SH波台站分布.红色沙滩球表示主震震中位置及USGS给出的W-phase震源机制解,蓝色三角形为台站. Fig. 4 Distribution of the main shock epicenter and the stations used in the finite-fault inversion Left: P-wave stations. Right: SH-wave stations. The red beach balls refer to the epicenter location and the USGS W-phase solution of the main shock, and the blue triangles are stations. |
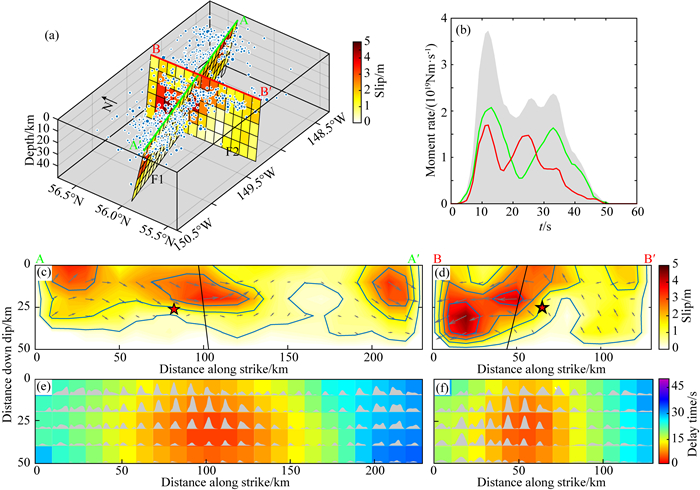
基于余震空间展布特征以及整体破裂方向,我们构建了如图 5a所示的由相互交叉的双断层F1和F2构成的初始模型.断层F1沿N256°E走向方向拓展230 km并沿74°倾向方向自地表向深部拓展50 km;断层F2沿N178°E走向方向拓展130 km并沿80°倾向方向自地表向深部拓展50 km.断层F1和F2均被分割成10 km×10 km尺度的子网格,并将F1和F2的初始滑动角分别设定为10°和164°.基于经验并经多次尝试,在反演过程中设定最大破裂速度为2.5 km·s-1,子断层最大上升时间为20 s.
|
图 5 震源的双断层模型与反演结果 (a)静态滑动以及早期余震(蓝色实心圆)的三维展示; (b)地震矩率函数,其中灰色区域为总体地震矩率函数,绿色和红色曲线分别为断层F1和F2对应的地震矩率函数; (c)和(d)分别为断层F1和F2的静态滑动分布.这里红色五角星表示投影到断层面上的震源位置,黑线表示断层F1和F2的交线; (e)和(f)分别为断层F1和F2各子断层的滑动函数(灰色填充)以及破裂时间(色彩). Fig. 5 The double-fault model and the inverted results (a) 3-D display of the static slip as well as the early aftershocks (blue solid circles); (b) The moment rate functions (MRFs), where the gray filling refers to the overall one while the green and red curves are for the F1 and F2, respectively; (c) and (d) show the static slip on the faults F1 and F2, respectively, where the red stars refer to the hypocenters projected on the fault planes, and the black lines represent the intersection lines of the faults; (e) and (f) exhibit the slip functions of all the sub-faults (gray-filling) and the rupture times (color). |
我们采用张旭(2016)发展的有限断层联合反演方法来反演此次地震的破裂过程.该方法无需事先给定子断层地震矩率函数形状,相反,其形状由反演过程自动确定.该方法允许子断层滑动角在初始滑动角左右两侧±45°的范围变化.此外,为了获取具有物理意义的结果,在反演过程中还可添加时空域光滑约束(Yagi et al., 2004; Zhang et al., 2012)以及标量地震矩最小约束(Hartzell and Heaton, 1983; Antolik and Dreger, 2003; Zhang et al., 2012).
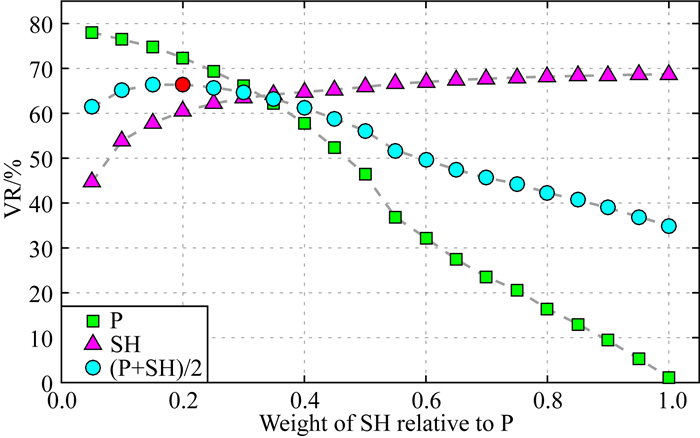
由于使用了P波和SH波两种数据,我们不得不确定两种资料的相对权重.我们期望两种资料能够在反演过程中发挥相同的作用,所以把反演结果对两种资料的解释程度作为确定权的标准.如图 6所示,当SH波数据相对于P波数据的权重值为0.2时,两种资料的平均方差降达到全局最大.
|
图 6 方差降(VR)随SH波相对于P波的权重值的变化 最佳权重值为0.2, 即红色圆圈的对应值. Fig. 6 The variation of the variance reduction with the weight of the SH wave data with respect to the P wave data The best weight is preferred to be 0.2 as shown as the red dot. |
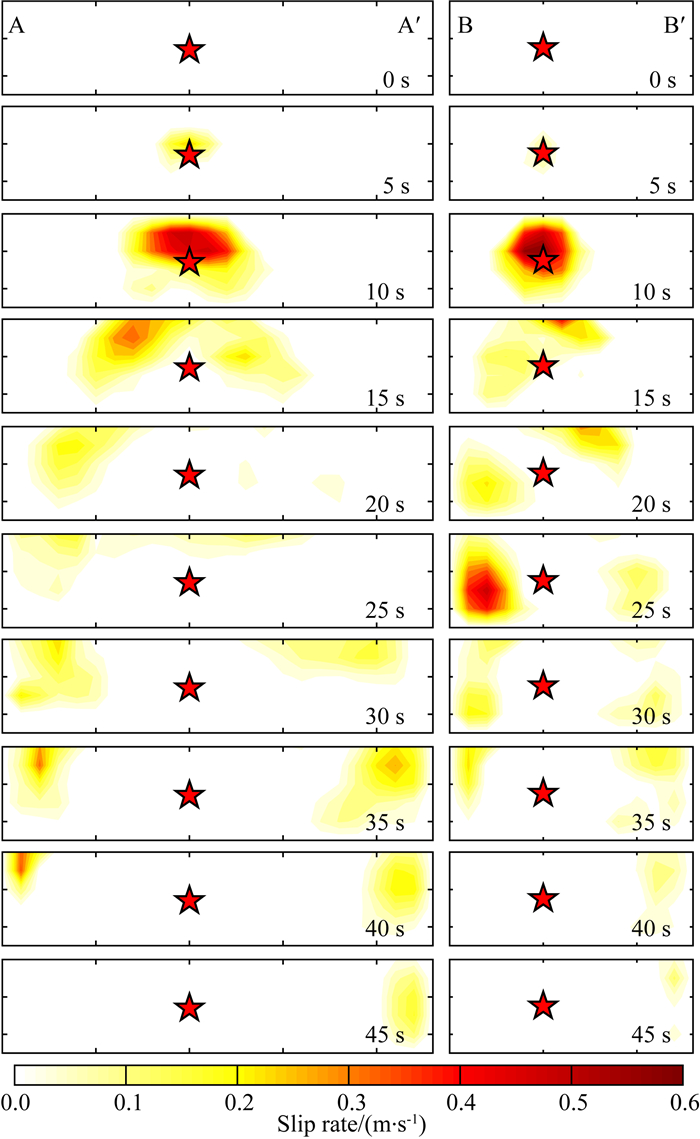
图 5b展示了反演得到的双断层F1和F2的震源时间函数.可以看出,此次事件持续~50 s,在时间上具有多事件特征,且两个断层的时间过程明显不同.图 5c和5d展示了两个断层的同震滑动分布.断层F1主要有三个凹凸体,一个位于震源附近,另两个位于断层两端.断层F2主要有两个彼此相邻的凹凸体,位于断层面上震源以北区域.最大滑动量约为5.0 m,位于断层F2.图 5e和5f展示了两个断层面上各子断层的滑动函数以及破裂时间等信息.为了清楚地展示时空破裂过程,断层F1和F2上的滑动率随时间的变化展示于图 7.
|
图 7 断层F1和F2上滑动速率快照 Fig. 7 Snapshots of the slip rate on the faults F1 and F2, respectively |
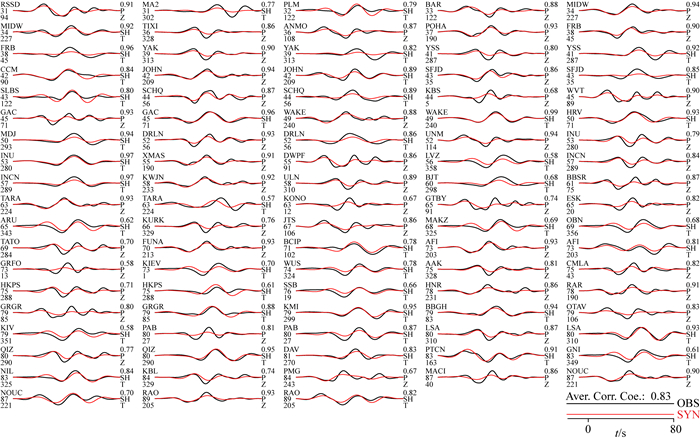
为了评价反演结果的可靠性,我们利用反演结果分别合成了相应的P波及SH波,与观测波形进行了比照.如图 8所示,合成波形和观测波形的平均相关系数达到了0.83,且所有波形均得到较好的拟合.
|
图 8 基于图 5所示的反演结果的合成资料与观测资料的比照 子图左侧自上往下依次为台站名,震中距和方位角;子图右侧自上往下依次为相关系数,震相名和分量名.如右下角所示,平均相关系数达0.83. Fig. 8 Comparison of the observed data with the synthetics calculated using the inverted results as shown in Fig. 5 On the left side of each subplot are station name, epicentral distance and azimuth, respectively, and on the right side are correlation coefficient, phase name and channel, respectively. The average correlation coefficient reaches 0.83, shown at the right bottom. |
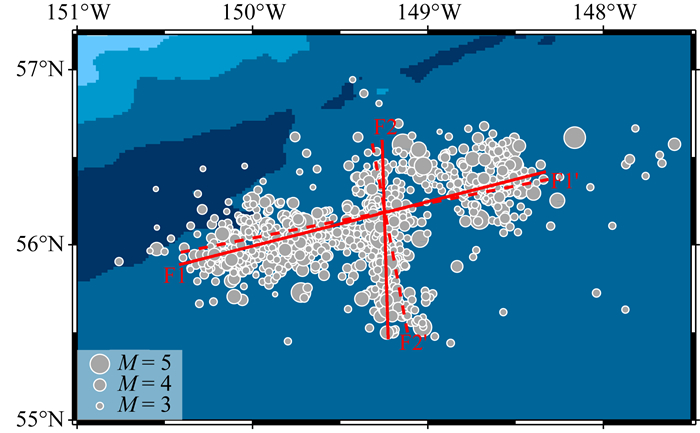
上面使用的双断层模型的断层面走向是通过余震震中的分布拟合确定的,而倾角和滑动角采自USGS给出的震源机制解.为了了解构建的初始模型对反演结果的影响,如图 9所示,我们完全利用USGS给出的W-phase震源机制解构建共轭双断层模型以及基于单一断层模型,在其他反演参数不变的情况下进行反演.
|
图 9 双断层迹线和余震分布 红色实线F1和F2分别表示走向为256°和178°的断层迹线,而红色虚线F1′和F2′分别表示走向为259°和166°的断层迹线.灰色实心圆表示震后两周内的余震分布. Fig. 9 The distribution of the double-fault traces and the aftershocks The red solid lines F1 and F2 correspond to the fault planes of strikes 256° and 178°, respectively, while the red dashed lines F1′ and F2′ refer to the fault planes of strikes 259° and 166°, respectively. The gray solid circles represent the aftershocks within first two weeks. |
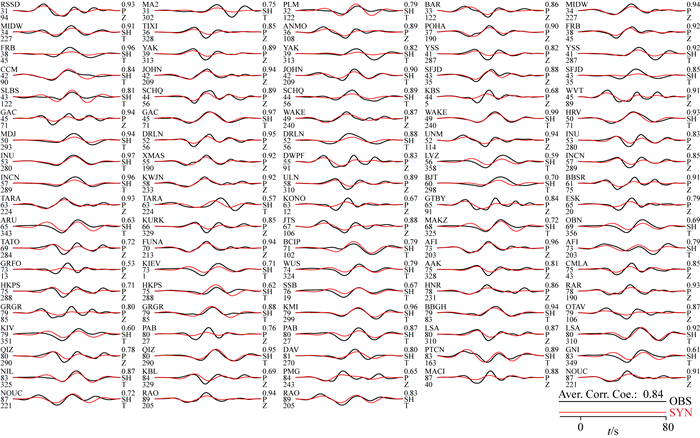
基于共轭双断层模型的反演结果如图 10所示,利用反演结果计算的合成波形与观测波形的比较展示于图 11.需要强调的是,基于共轭双断层模型反演得到的结果与基于非共轭双断层模型得到的结果近乎一致,且两个结果对观测资料的解释程度亦较为接近.这表明走向上的差异对反演结果的影响较小.

|
图 10 基于共轭双断层模型F1′和F2′反演得到的同震滑动分布 (a)断层F1′同震滑动分布;(b)断层F2′同震滑动分布. Fig. 10 The distribution of the inverted coseismic slip based on the conjugate double faults F1′ and F2′ (a) Coseismic slip on fault F1′; (b) Coseismic slip on fault F2′. |
|
图 11 基于图 10所示的反演结果的合成资料与观测资料的比照(参看图 8) Fig. 11 Comparison of the observed data with the synthetics calculated using the inverted results as shown in Fig. 10 (See Fig. 8 for details) |
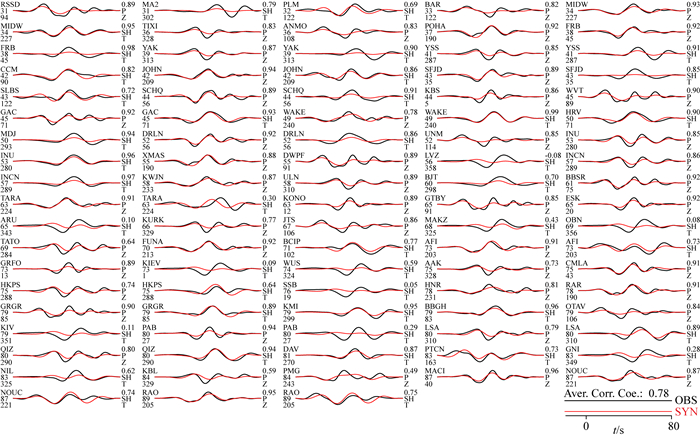
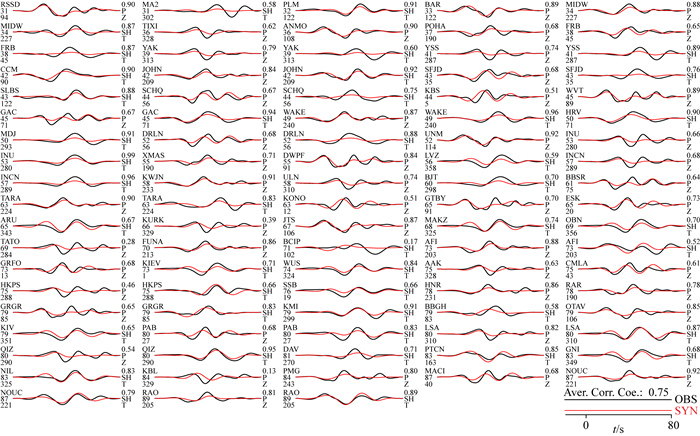
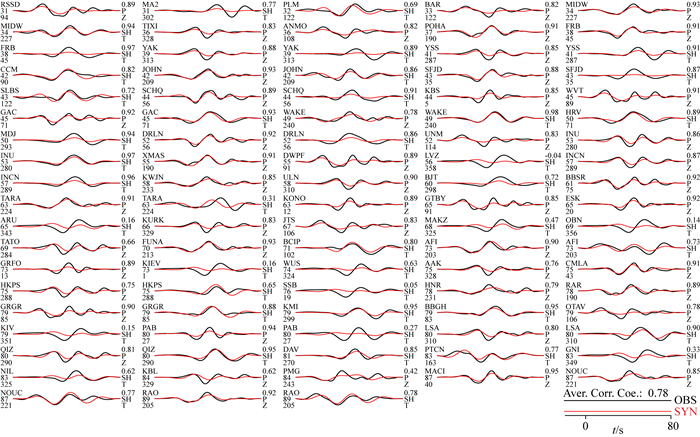
然而,如果采用单断层模型,F1,F2,F1′和F2′中的任何一个,如图 12所示,不但反演结果发生明显的变化,而且,如图 13—16所示,反演结果对观测资料的解释程度明显下降.上述测试表明,对于此次地震,双断层模型更可取.

|
图 12 单断层模型与反演结果 (a)断层F1的同震滑动;(b)断层F2的同震滑动;(c)断层F1′的同震滑动;(d)断层F2′的同震滑动. Fig. 12 The single-fault models and the inverted results (a) Coseismic slip on the fault F1; (b) Coseismic slip on the fault F2; (c) Coseismic slip on the fault F1′; (d) Coseismic slip on the fault F2′. |
|
图 13 基于图 12a所示的单断层模型计算的合成资料与观测资料的比照 注意:平均相关系数达0.78,但是相当数量的台站,如ARU,KIV,NIL,TARA,KIEV,WUS,SSB,PAB,LVZ,MAKZ,OBN和GNI等,SH波的拟合明显变差. Fig. 13 Comparison of the observed data with the synthetics calculated using the inverted results shown in Fig. 12a Note: the average correlation coefficient reaches 0.78, but at a quite number of stations, such as ARU, KIV, NIL, TARA, KIEV, WUS, SSB, PAB, LVZ, MAKZ, OBN, GNI and others, the SH fittings become obviously worse. |
|
图 14 基于图 12b所示的单断层模型计算的合成资料与观测资料的比照 注意:平均相关系数达0.75,但是相当数量的台站,如GAC, TATO, HKPS, QIZ, TIXI, DRLN, KURK, KBL, POHA, FRB, BBSR和CMLA等,P波的拟合明显变差,又如BCIP,BBGH和AFI台站等,SH波的拟合明显变差. Fig. 14 Comparison of the observed data with the synthetics calculated using the inverted results shown in Fig. 12b Note: the average correlation coefficient reaches 0.75, but at a quite number of stations, such as GAC, TATO, HKPS, QIZ, TIXI, DRLN, KURK, KBL, POHA, FRB, BBSR, CMLA and others, the P fittings become obviously worse, and such as BCIP, BBGH, AFI and others, the SH fittings become obviously worse. |
|
图 15 基于图 12c所示的单断层模型计算的合成资料与观测资料的比照 注意:平均相关系数达0.78,但是相当数量的台站,如PMG等,P波的拟合明显变差,又如ARU,KIV,NIL,TARA,KIEV,SSB,PAB,LVZ,MAKZ,OBN和GNI等,SH波的拟合明显变差. Fig. 15 Comparison of the observed data with the synthetics calculated using the inverted results shown in Fig. 12c Note: the average correlation coefficient reaches 0.78, but at a quite number of stations, such as PMG, the P fitting becomes obviously worse, and such as ARU, KIV, NIL, TARA, KIEV, SSB, PAB, LVZ, MAKZ, OBN, GNI and others, the SH fittings become obviously worse. |

|
图 16 基于图 12d所示的单断层模型计算的合成资料与观测资料的比照 注意:平均相关系数达0.77,但是相当数量的台站,如GAC,DRLN,XMAS,KURK,KBL,POHA和CMLA等,P波的拟合明显变差,又如MA2,BCIP,BBGH和AFI台站等,SH波的拟合明显变差. Fig. 16 Comparison of the observed data with the synthetics calculated using the inverted results shown in Fig. 12d Note: the average correlation coefficient reaches 0.77, but at a quite number of stations, such as GAC, DRLN, XMAS, KURK, KBL, POHA, CMLA and others, the P fittings become obviously worse, and such as MA2, BCIP, BBGH, AFI and others, the SH fittings become obviously worse. |
基于余震空间展布、震源机制解以及视震源时间函数的方向性分析,我们构建了相互交叉的双断层模型,并利用远场P波和SH波反演确定了阿拉斯加湾MW7.9大地震的时空破裂过程.
在构建双断层初始模型时,我们尝试了两种方式.第一种方式中,双断层模型的走向由余震的空间分布确定,而倾角和滑动角由震源机制解确定;第二种方式中,走向、倾角和滑动角均由震源机制解确定.根据反演结果,上述两种方式并不对反演结果造成明显影响.反演结果非常接近,且都能很好地解释观测资料.
与此同时,我们利用两种方式中的任何一个断层面作为初始模型进行了反演.反演结果表明,任何一个单断层模型对观测资料的解释都不及双断层模型,且反演结果也明显不同.由此可见,二者相比双断层模型更可取.另外, 我们还利用双断层模型进行了唯一性测试.我们利用反演得到的破裂过程模型计算在采用的台站的合成地震图,然后将添加10%噪声的合成地震图进行反演得到测试结果.测试结果和原反演结果相比非常近似,这表明观测数据足以确定反演参数.
根据双断层模型的反演结果,此次事件持续~50 s,释放标量地震矩约8.11×10²⁰ Nm,相当于矩震级MW7.87.根据震源时间函数,两个断层具有类似的持续时间,但地震矩率随时间的变化表现不同.根据同震滑动的空间分布,近乎东西向断层F1主要包括三个滑动凹凸体;而近乎南北向的断层F2则主要包括有两个.F1的凹凸体在空间上较为均匀,一个位于震源附近,另外两个位于断层两端,且主要位于浅部;F2的凹凸体在空间上位于震源和海沟之间,且主要位于深部.根据时空破裂图像,此次地震破裂起始于F2,很快触发了F1,且F2的破裂速度较慢而F1破裂速度较快.
我们注意到了近期关于这次地震的震源复杂性的研究(Lay et al., 2018;Ruppert et al., 2018;Krabbenhoeft et al., 2018),他们基于不同的观测数据构建了不同的震源结构,当然震源破裂过程也不能简单相提并论.然而,与Lay等(2018)联合反演远场体波和海啸数据得到的结果相比,破裂持续时间与主要滑动特征比较相似,但在一些细节上仍存差异,比如,我们得到的同震滑动在深度方向上分布更广,又如,他们认为此次地震主要滑动位于南北向断层的北端,而我们的结果则与Ruppert等(2018)利用台阵反投影技术和基于GPS地表位移数据得到的结果一致,表明在南北向断裂和东北—西南向断裂均有较强破裂.Krabbenhoeft等(2018)认为发震构造更复杂,但没有给出具体的破裂过程反演结果.概而言之,这次地震的震源结构和破裂过程均表现出复杂性,但限于观测数据,破裂过程尚无定论.我们的研究结果只是基于余震活动、震源机制和远场地震波数据对主要特征的近似.更完善的关于震源复杂性的结果还需要更多的观测数据和更全面的分析.
近年来的研究表明,一些大地震的发生可能会在短期内触发震区及邻近区域的灾害性地震(如, Yue et al., 2012; Lay et al., 2017).2018年阿拉斯加湾MW7.9大地震发生在太平洋板块与北美板块的俯冲带区域,而这里的俯冲已经造成阿拉斯加湾及邻近区域应变能的积累(DeMets et al., 2010),因此,这次地震无疑提高了阿拉斯加湾及邻近区域未来发生灾害性大地震的可能性,继而增加了未来地震及海啸灾害的风险.
致谢 本研究中使用的地震波形数据来自于IRIS数据中心.
Ammon C J, Kanamori H, Lay T, et al. 2006a. The 17 July 2006 Java tsunami earthquake. Geophysical Research Letters, 33(24): 194-199. DOI:10.1029/2006GL028005 |
Ammon C J, Velasco A A, Lay T. 2006b. Rapid estimation of first-order rupture characteristics for large earthquakes using surface waves:2004 Sumatra-Andaman earthquake. Geophysical Research Letters, 33(14): L14314. DOI:10.1029/2006GL026303 |
Antolik M, Dreger D S. 2003. Rupture process of the 26 January 2001 MW76 Bhuj, India, Earthquake from teleseismic broadband data. Bulletin of the Seismological Society of America, 93(3): 1235-1248. DOI:10.1785/0120020142 |
Avouac J P, Meng L S, Wei S J, et al. 2015. Lower edge of locked Main Himalayan Thrust unzipped by the 2015 Gorkha earthquake. Nature Geoscience, 8(9): 708-711. DOI:10.1038/ngeo2518 |
Bertero M, Bindi D, Boccacci P, et al. 1997. Application of the projected Landweber method to the estimation of the source time function in seismology. Inverse Problems, 13(2): 465-486. DOI:10.1088/0266-5611/13/2/017 |
Bird P. 2003. An updated digital model of plate boundaries. Geochemistry, Geophysics, Geosystems, 4(3): 1027. DOI:10.1029/2001GC000252 |
Chen Y T, Zhou J Y, Ni J C. 1991. Inversion of near-source-broadband accelerograms for the earthquake source-time function. Tectonophysics, 197(1): 89-98. DOI:10.1016/0040-1951(91)90402-E |
DeMets C, Gordon R G, Argus D F. 2010. Geologically current plate motions. Geophysical Journal International, 181(1): 1-80. DOI:10.1111/gji.2010.181.issue-1 |
Dreger D S. 1994. Investigation of the rupture process of the 28 June 1992 Landers earthquake utilizing TERRAscope. Bulletin of the Seismological Society of America, 84(3): 713-724. |
Ekström G, Nettles M, Dziewoński A M. 2012. The global CMT project 2004-2010:Centroid-moment tensors for 13, 017 eartquakes. Physics of the Earth and Planetary Interiors, 200-201: 1-9. DOI:10.1016/j.pepi.2012.04.002 |
Galetzka J, Melgar D, Genrich J F, et al. 2015. Slip pulse and resonance of the Kathmandu basin during the 2015 Gorkha earthquake, Nepal. Science, 349(6252): 1091-1095. DOI:10.1126/science.aac6383 |
Gusman A R, Murotani S, Satake K, et al. 2015. Fault slip distribution of the 2014 Iquique, Chile, earthquake estimated from ocean-wide tsunami waveforms and GPS data. Geophysical Research Letters, 42(4): 1053-1060. DOI:10.1002/2014GL062604 |
Hartzell S H, Heaton T H. 1983. Inversion of strong ground motion and teleseismic waveform data for the fault rupture history of the 1979 Imperial Valley, California, earthquake. Bulletin of the Seismological Society of America, 73(6A): 1553-1583. |
Helmberger D, Wiggins R A. 1971. Upper mantle structure of midwestern United States. Journal of Geophysical Research, 76(14): 3229-3245. DOI:10.1029/JB076i014p03229 |
Kennett B L N, Engdahl E R, Buland R. 1995. Constraints on seismic velocities in the Earth from traveltimes. Geophysical Journal International, 122(1): 108-124. DOI:10.1111/gji.1995.122.issue-1 |
Krabbenhoeft A, von Huene R, Miller J J, et al. 2018. Strike-slip 23 January 2018 MW7.9 Gulf of Alaska rare intraplate earthquake:Complex rupture of a fracture zone system. Scientific Reports, 8: 13706. DOI:10.1038/s41598-018-32071-4 |
Kraeva N. 2004. Tikhonov's regularization for deconvolution in the empirical Green function method and vertical directivity effect. Tectonophysics, 383(1-2): 29-44. DOI:10.1016/j.tecto.2004.02.003 |
Lanza V, Spallarossa D, Cattaneo M, et al. 1999. Source parameters of small events using constrained deconvolution with empirical Green's functions. Geophysical Journal International, 137(3): 651-662. DOI:10.1046/j.1365-246x.1999.00809.x |
Lay T, Wallace T C. 1995. Modern Global Seismology. San Diego: Academic Press.
|
Lay T, Kanamori H, Ammon C J, et al. 2009. The 2006-2007 Kuril Islands great earthquake sequence. Journal of Geophysical Research:Solid Earth, 114(B11): B11308. DOI:10.1029/2008JB006280 |
Lay T, Ammon C J, Kanamori H, et al. 2010. The 2009 Samoa-Tonga great earthquake triggered doublet. Nature, 466(7309): 964-968. DOI:10.1038/nature09214 |
Lay T, Ye L L, Ammon C J, et al. 2017. Intraslab rupture triggering megathrust rupture coseismically in the 17 December 2016 Solomon Islands MW7.9 earthquake. Geophysical Research Letters, 44(3): 1286-1292. DOI:10.1002/grl.v44.3 |
Lay T, Ye L L, Bai Y F, et al. 2018. The 2018 MW7.9 Gulf of Alaska earthquake:Multiple fault rupture in the Pacific plate. Geophysical Research Letters, 45(18): 9542-9551. DOI:10.1029/2018GL079813 |
Montagner J P, Kennett B L N. 1996. How to reconcile body-wave and normal-mode reference earth models. Geophysical Journal International, 125(1): 229-248. DOI:10.1111/gji.1996.125.issue-1 |
Park S, Ishii M. 2015. Inversion for rupture properties based upon 3-D directivity effect and application to deep earthquakes in the Sea of Okhotsk region. Geophysical Journal International, 203(2): 1011-1025. DOI:10.1093/gji/ggv352 |
Piana M, Bertero M. 1997. Projected Landweber method and preconditioning. Inverse Problems, 13(2): 441-463. DOI:10.1088/0266-5611/13/2/016 |
Ruppert N A, Rollins C, Zhang A, et al. 2018. Complex faulting and triggered rupture during the 2018 MW7.9 offshore Kodiak, Alaska, earthquake. Geophysical Research Letters, 45(15): 7533-7541. DOI:10.1029/2018GL078931 |
Sandwell D T, Müller R D, Smith W H F, et al. 2014. New global marine gravity model from CryoSat-2 and Jason-1 reveals buried tectonic structure. Science, 346(6205): 65-67. DOI:10.1126/science.1258213 |
Simons M, Minson S E, Sladen A, et al. 2011. The 2011 magnitude 9.0 Tohoku-Oki earthquake:mosaicking the megathrust from seconds to centuries. Science, 332(6036): 1421-1425. DOI:10.1126/science.1206731 |
Vallée M. 2004. Stabilizing the empirical Green function analysis:development of the projected Landweber method. Bulletin of the Seismological Society of America, 94(2): 394-409. DOI:10.1785/0120030017 |
Wang R J. 1999. A simple orthonormalization method for stable and efficient computation of Green's functions. Bulletin of the Seismological Society of America, 89(3): 733-741. |
Xu L S, Zhang X, Yan C, et al. 2014. Analysis of the Love waves for the source complexity of the Ludian MS6.5 earthquake. Chinese J. Geophys (in Chinese), 57(9): 3006-3017. DOI:10.6038/cjg20140925 |
Yagi Y, Mikumo T, Pacheco J, et al. 2004. Source rupture process of the Tecomán, Colima, Mexico Earthquake of 22 January 2003, determined by joint inversion of teleseismic body-wave and near-source data. Bulletin of the Seismological Society of America, 94(5): 1795-1807. DOI:10.1785/012003095 |
Yue H, Lay T, Koper K D. 2012. En échelon and orthogonal fault ruptures of the 11 April 2012 great intraplate earthquakes. Nature, 490(7419): 245-249. DOI:10.1038/nature11492 |
Zhang X, Xu L S. 2015. Inversion of the apparent source time functions for the rupture process of the Nepal MS8.1 earthquake. Chinese J. Geophys (in Chinese), 58(6): 1881-1890. DOI:10.6038/cjg20150604 |
Zhang X. 2016. Study on new methods for analysis of the complexity of source rupture process based on apparent source time functions[Ph. D. thesis] (in Chinese). Beijing: Institute of Geophysics, China Earthquake Administration.
|
Zhang X, Yan C, Xu L S. 2016. Analysis of the Love-waves for the rupture processes of the 2014 earthquake-doublet of Kangding, Sichuan. Chinese J. Geophys (in Chinese), 59(7): 2453-2467. DOI:10.6038/cjg20160712 |
Zhang Y, Xu L S, Chen Y T. 2009. PLD method for retrieving apparent source time function and its application to the 2005 Kashmir MW7.6 earthquake. Chinese J. Geophys (in Chinese), 52(3): 672-680. |
Zhang Y, Feng W P, Chen Y T, et al. 2012. The 2009 L'Aquila MW6.3 earthquake:a new technique to locate the hypocentre in the joint inversion of earthquake rupture process. Geophysical Journal International, 191(3): 1417-1426. |
许力生, 张旭, 严川, 等. 2014. 基于勒夫波的鲁甸MS6.5地震震源复杂性分析. 球物理学报, 57(9): 3006-3017. DOI:10.6038/cjg20140925 |
张旭, 许力生. 2015. 利用视震源时间函数反演尼泊尔MS8.1地震破裂过程. 地球物理学报, 58(6): 1881-1890. DOI:10.6038/cjg20150604 |
张旭. 2016.基于视震源时间函数的震源过程复杂性分析新方法研究[博士论文].北京: 中国地震局地球物理研究所. http://cdmd.cnki.com.cn/Article/CDMD-85401-1016222120.htm
|
张旭, 严川, 许力生. 2016. 2014年四川康定双震震源的勒夫波分析. 地球物理学报, 59(7): 2453-2467. DOI:10.6038/cjg20160712 |
张勇, 许力生, 陈运泰. 2009. 提取视震源时间函数的PLD方法及其对2005年克什米尔MW7.6地震的应用. 地球物理学报, 52(3): 672-680. |
 2019, Vol. 62


