2. 中国科学院大学, 北京 100049;
3. 成都理工大学地质灾害防治与地质环境保护国家重点实验室, 成都 610059;
4. 成都理工大学地球探测与信息技术教育部重点实验室, 成都 610059
2. University of Chinese Academy of Sciences, Beijing 100049, China;
3. State Key Laboratory of Geohazard Prevention and Geoenvironment Protection, Chengdu University of Technology, Chengdu 610059, China;
4. Key Laboratory of Earth Exploration and Information Technology of Ministry of Education, Chengdu University of Technology, Chengdu 610059, China
龙门山断裂带是青藏高原东部的一条边缘断裂带,走向为NE方向,总长约400 km,其西部为松潘—甘孜块体,东部为四川盆地.2008年汶川MW7.9地震即发生在这条断裂带上(图 1),该地震造成巨大人员伤亡,而在此之后的2013年芦山MW6.6地震的发生引发了汶川地震与芦山地震相互关系,以及龙门山断裂带未来地震危险性等相关思考(陈立春等,2013;杜方等,2013;单斌等,2013;徐锡伟等,2013;郑勇等,2013;Shi et al., 2014;Lu et al., 2017;陈运泰等,2013;Pei et al., 2014;Li et al., 2014;Bai et al., 2018).从地震相互关系角度分析,有学者指出,芦山地震是一次独立的地震事件,但其有可能被汶川地震触发而产生(Li et al., 2014).从地震危险性分析方面,有研究表明汶川地震的发生对周缘断裂带有应力加载的作用,使得龙门山断裂带西南段宝兴—小金一带处于潜在强震区域(陈运泰等,2013).另外,芦山地震的发生,使得汶川与芦山地震之间的地震空段危险性增强(陈运泰等,2013;高原等,2013;Lei et al., 2014;Liu et al., 2014).然而,地震层析成像结果表明该地震空段为低速区域,难以积累达到相应强震的应力水平(Pei et al., 2014).紧邻龙门山断裂带的四川盆地,包括四川中东部和重庆大部及云南昭通大部,共11个人口超过400万的城市,对该区地震危险性的判定尤为重要.

|
图 1 研究区域地质构造、断层及LmsSGA台站分布 蓝色圆圈为1990年1月1日至2017年11月21日发生在研究区域内的ML≥2.0地震(数据来自四川省地震局),红色五角星代表汶川地震,黄色五角星代表芦山地震,蓝色五角星代表九寨沟地震,蓝色菱形为LmsSGA台站分布,绿色菱形为四川省地震局的固定台站,紫色方框代表地震空段的位置.粉色和绿色的丛集分别是重定位前的丛集2和丛集4. Figure 1 Tectonic structures, faults and stations in study area The blue circles show seismicity in the study area from January 1st, 1990 to November 21st, 2017 with ML≥2.0 (data from Sichuan Earthquake Administration). The red star shows Wenchuan mainshock, the yellow star shows Lushan mainshock, and the blue star shows Jiuzhaigou mainshock. The blue diamonds show stations of LmsSGA, the green diamonds show permanent stations from Sichuan Earthquake Administration, and the purple rectangle marks the seismic gap. The pink and green clusters shows cluster 2 and cluster 4 before relocation respectively. |
除地震危险性以外,龙门山断裂带的另一个显著特点是其陡峭的地形,横跨该断裂带的地形梯度可达青藏高原地区之最(Thompson et al., 2015).有关该区的隆升机制主要包括两个端元模型:中下地壳流与中上地壳缩短(Clark and Royden, 2000; Hubbard and Shaw, 2009).前者指出在印度板块北向运动的过程中,松潘—甘孜块体软弱的中下地壳物质逐渐东向运移,当遇到较为坚硬的四川盆地阻挡时,物质运移通道转为向上,导致该区地形陡增;而后者则认为逆冲地震的发生可导致中上地壳横向缩短、垂向生长、地形升高.
汶川地震发生距今已近十年,近年来有关该断裂带地震活动分布的研究并不多见,制约了人们对该断裂带地震震源演化的认识.此外,龙门山断裂带地形陡峭且海拔较高,对该区的地震学监测有限(图 1),尤其是对地震空段的监测较为薄弱.这束缚了人们对龙门山断裂带整体地震活动与结构的认识,因此,自2016年11月,中国科学院地质与地球物理研究所与成都理工大学合作在地震空段加密布设23个宽频带地震仪器(梁春涛等,2018),并命名为龙门山断裂带地震空段台阵(Longmenshan Seismic Gap Array,LmsSGA).
本文主要基于LmsSGA台阵新数据,并综合固定台站资料,开展龙门山断裂带最新时段的地震事件识别与定位研究,分别揭示汶川与芦山地震的早期余震与现今余震在空间分布上的差异,并探讨其可能的机制.新获取的地震定位数据,将为龙门山断裂带地震危险性与动力学机制,提供新的地震学信息.
1 数据与方法LmsSGA台阵主要包括14台Guralp CMG-3ESPC地震计,4台Nanometrics Trilium-120PA地震计和5台eentec EP-300地震计,对应的数据采集器依次为REFTEK-130B,DR-4050P(dmx.gz格式)和Centaur(miniseed格式).本文采用数据时长约一年(2016年11月21日—2017年10月28日).野外采集的数据为连续波形且格式不同,因此在数据预处理过程中,首先进行数据格式转换,把上述三种数据格式转为标准SAC格式,并把时间转换至北京时.其次,从连续波形中截取事件波形,具体为根据四川省地震局提供的地震目录信息截取事件波形,最终获取23479个事件资料(图 2).

|
图 2 LmsSGA数据预处理流程图 Figure 2 Flowchart of data preprocessing from LmsSGA |
由于事件波形数量较大,在后续分析中,我们基于已经截取的事件波形,首先采取自动识别震相方法——PSIRpicker (Li and Peng, 2016)拾取P、S到时.另外,为保证自动识别结果的可靠性,把震中距小于120 km的地震事件的P、S到时进行人工检验校正.
综合LmsSGA震相数据与四川省地震局的震相报告,基于HypoDD(Waldhauser and Ellsworth, 2000)方法,开展龙门山断裂带最新地震事件重定位分析,并与汶川地震与芦山地震的早期余震分布特征加以比较,探讨其可能的机制.
1.1 震相拾取PSIRpicker(Li and Peng, 2016)是在传统特征函数方法基础上,结合研究区域的一维速度反演,该方法主要基于已有地震事件目录计算新数据体的体波理论到时信息,正适于LmsSGA台阵数据.该方法需要初始速度模型和地震位置作为输入信息,确定震相到时的可能区间,在此区间内,通过信噪比(SNR)的比对判定震相的准确到时.根据所得的震相到时更新初始速度模型,并用更新后的速度模型寻找更加准确的震相到时.如此迭代反复,直至震相到时和速度模型都足够稳定时,即可得到较为精准的区域速度模型和震相到时.
在利用PSIRpicker拾取震相的准备过程中,赵珠和张润生(1987)关于四川地区地壳上地幔的P波速度模型Ⅰ中的西区部分作为初始速度模型,其中VP/VS值取1.73.采取西部速度模型主要基于两点考虑:其一,LmsSGA台阵的主体位于川西高原;其二,在对台阵数据2017年4月份的数据体进行测试时,我们发现由东部速度模型进行重定位得到的丛集2的均方根残差从0.3838 s降到0.1182 s,降低了69.2%,而由西部速度模型进行重定位得到的丛集2的均方根残差由0.3860 s降到0.1124 s,降低了70.9%,因此我们认为西部速度模型比东部速度模型更加适合本文的数据体.
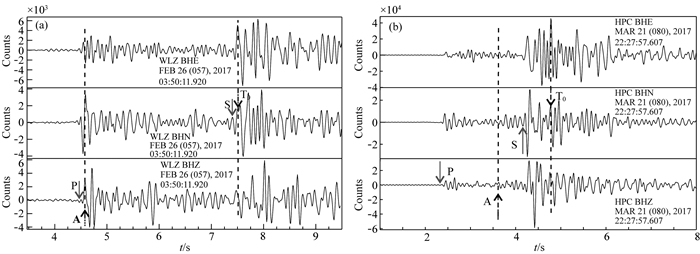
在自动拾取震相之后,将震相到时写入地震波形头段信息中,得到含有P波和S波初至信息的波形.为使震相识别结果更为可靠,我们对震中距在120 km以内的所有事件波形进行人工检验校正,最终获取具有清晰震相的地震事件共2700个.图 3a和图 3b分别展示了自动识别震相准确度较高和不理想状态下,进一步进行人工检验校正的实例.这凸显了自动识别震相与人工检验相结合的必要性.

|
图 3 PSIRpicker震相自动识别与人工震相检验校正的波形示例 2~15 Hz带通滤波后的三分量地震记录,自上而下分别是E、N、Z分量.其中A和T0分别为PSIRpicker拾取的P波初至和S波初至;P和S分别为人工检验校正之后的P波和S波的初至.其中,(a)为震中距21.3 km,震源深度4 km,ML1.3的地震事件;(b)为震中距12.2 km,震源深度12 km,ML1.6的地震事件. Figure 3 Three-component waveform after automatic phase picking and manual checking Three-component seismogram filtered by a butterworth filter in 2~15 Hz, E, N, Z components from upper to lower panels respectively. A is marked as P arrival picked by PSIRpicker while T0 is S arrival picked by PSIRpicker. P and S arrivals are manually adjusted by marking P and S. (a) shows an event with epicenter distance 21.3 km, depth 4 km, ML1.3, while (b) shows an event with epicenter distance 12.2 km, depth 12 km, ML1.6. |
本文采用HypoDD(Waldhauser and Ellsworth, 2000)对龙门山断裂带及其周缘的地震事件进行重定位.如果两个地震间的距离远小于震源距和速度不均匀尺度的话,那么对于同一个台站来说,这两个地震从震源区到该台站的射线路径是相近的.这种情况下,在同一个台站观测到的这两个地震事件的走时差之差(称为双差)主要由两个地震事件的空间分布差异所致.重定位过程中通过联合多个事件对到台站的双差组成矩阵,利用奇异值分解法(SVD)或共轭梯度法(LSQR)获得最小二乘解,并通过多次迭代得到准确的震源参数(Waldhauser and Ellsworth, 2000).
在对LmsSGA记录到的地震事件进行定位的过程中,与识别震相过程一致,采用赵珠和张润生(1987)关于四川地区地壳上地幔的P波速度模型Ⅰ中的西区部分,VP/VS值取1.73.本文组成事件对的条件为:事件对之间的最大距离MAXSEP=8 km,事件对到台站的最远距离MAXDIST=350 km,事件对的最低链接数MINLINK=4.鉴于龙门山断裂带规模较大,设定用于重定位的丛集的质心到台站的最远距离为250 km,迭代3组,每组迭代4次.本文重定位过程中,共得到1097473对事件对,组成矩阵的规模较大,因此采用的是共轭梯度法(LSQR)求解震源参数.
2 重定位结果采用双差定位方法,将组成204个丛集的8747个地震事件进行重定位,共得到6111个精定位的地震事件.以丛集4(九寨沟地震余震构成的丛集)为例,共658个地震事件参与重定位,得到620个重定位结果.重定位后的均方根残差从0.4334 s减小到0.2910 s,水平向和垂直向的平均偏差分别为43.8 m和66.6 km,结果得到较为明显的改善.
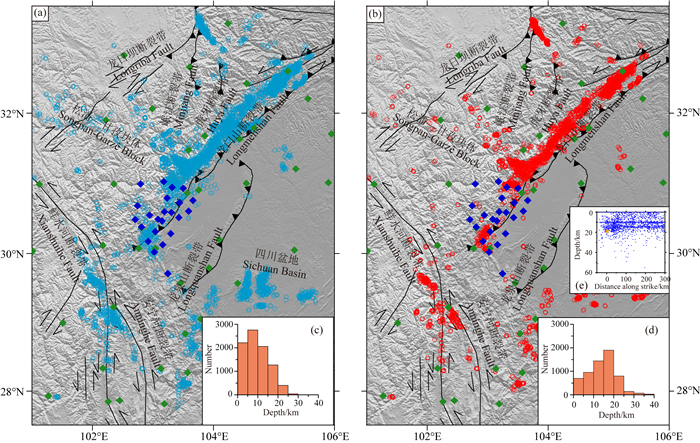
对比重定位前后的震中位置分布图(图 4),可以看出重定位前震中位置聚集于汶川地震余震带、芦山地震余震带、九寨沟地震余震带和鲜水河断裂带附近.由于研究区域中台网分布较为均匀,重定位后的地震事件在空间分布形态上没有太大变化,但是呈现事件集中或收敛到断裂带周缘的特征.

|
图 4 重定位前(a)、后(b)的震中位置分布图 附图(c)、(d)为震源深度统计直方图,附图(e)为IRIS提供的该区域1970年2月24日至2018年2月18日的地震(MW≥3.0)震源深度分布图. Figure 4 Seismicity locations before (a) and after (b) relocation The insets (c) and (d) are histograms of focal depth respectively, and the inset (e) is histogram of focal depth (MW≥3.0) from IRIS (from February 24th, 1970 to February 18th, 2018). |
对比重定位前后的震源深度分布发现,重定位之前,绝大部分地震集中在0~25 km的深度范围内,且分布较为零散.重定位后,54.7%的地震事件分布在10~20 km的深度范围内,且有了较为明显的优势发震层,整体的震源分布有变深的趋势.值得注意的是,重定位之后,有2.9%的地震分布在30 km以深,这与IRIS(Incorporated Research Institution for Seismology)的结果一致(图 4e).
3 讨论 3.1 汶川地震最新余震与早期余震分布比较在汶川地震早期(2008年5月12日—2008年7月8日),地震主要分布在20 km以浅(黄媛等,2008),其中绝大部分集中在10~20 km范围内.该结果与赵博等(2011)依据2008年5月12日—2008年12月31日得到的精定位结果的分布特征一致(图 5).

|
图 5 汶川余震活动沿断裂带走向投影图 以汶川主震为中心沿龙门山断裂带走向投影,投影宽度为西向50 km至东向50 km. (a)红色方框为本文结果,绿色方框为赵博等(2011)结果,蓝色方框为黄媛等(2008)结果,橙色五角星为汶川地震主震;(b)红色圆圈为本文结果中震源深度沿断裂带的投影,黑色方框含义同图 5a中红色方框,附图为重定位后震源深度统计直方图;(c)、(d)中的绿色和蓝色圆圈分别为赵博等(2011)和黄媛等(2008)的结果中震源深度沿断裂带的投影,其他同图 5b. Figure 5 The along-strike projections of Wenchuan aftershocks The projections are centered at Wenchuan mainshock spanning from 50 km in the west to 50 km in the east. (a) The red squares show our result. The green squares show the results of Zhao et al. (2011) and the blue ones show the results of Huang et al. (2008). The orange star represents Wenchuan mainshock. (b) The red circles mark along-strike projection of focal depth in this paper and the black squares are the same as red ones in Fig. 5a. The inset figure is the histogram of focal depth after relocation. The green circles and blue circles in (c) and (d) mark along-strike projection of focal depth in Zhao et al. (2011) and Huang et al. (2008) respectively. Others are the same as in Fig. 5b. |
在汶川地震发生后近十年,汶川最新余震主要分布在25 km以浅,集中在10~25 km范围内,但在30 km以深也有部分余震.依据Kato和Obara(2014)与Wu等(2017)采用的震源深度统计方法,结合汶川地震余震带较长的特点,我们定义沿断裂带走向每5 km作为一个滑动窗口,并设置沿断裂带走向2 km为一个区间,随着断裂带走向统计每个区间内地震事件的平均深度,该深度在图 5中以方框表示.观察震源平均深度统计的曲线图,可以看出汶川地震余震震源分布形态变化不大.将不同时期的汶川余震震源平均深度进行比较,发现在断裂带西南段,新近余震的震源平均深度分布较早期余震变深约5 km,东北段余震震源分布也向深部迁移约3 km(图 5).
3.2 芦山地震最新余震与早期余震分布比较芦山地震发生后,多位学者开展了不同时段余震的精定位工作(张广伟与雷建设,2013;赵博等,2013;Fang et al., 2015).在芦山地震发生后18天内,余震主要分布在20 km以浅,大部分集中在15~20 km范围内(赵博等,2013),这与芦山地震震后48 h的深度分布区间接近(张广伟与雷建设,2013).在芦山地震发生1年后,余震集中分布于20 km以浅,其中绝大部分集中在10~20 km范围内(Fang et al., 2015).
同样,依据Kato和Obara(2014)与Wu等(2017)中采用的震源深度统计方法,我们定量计算地震深度分布形态.由于芦山地震余震带相对较短,我们定义沿断裂带走向上每2 km作为一个滑动窗口以提高空间分辨率,并设置沿断裂带走向2 km为一个区间,随着断裂带走向统计每个区间内地震事件的平均深度,该深度在图 6中以方框表示.本文数据分析表明,芦山地震发生约五年后的余震集中分布在10~15 km的深度范围内.与早期余震相比,现今余震数量明显减少,余震分布几何形态与早期一致,但在深度分布方面则整体向浅部迁移约3 km(图 6).

|
图 6 芦山余震活动沿断裂带走向投影图 以芦山主震为中心沿龙门山断裂带走向投影,投影宽度为西向12 km至东向20 km.(a)红色方框为本文结果,绿色和蓝色方框分别为Fang等(2015)和赵博等(2013)的结果,橙色五角星为芦山地震主震;(b)红色圆圈为本文结果中震源深度沿断裂带的投影,黑色方框含义同图 6a中红色方框,附图为重定位后震源深度统计直方图;(c)、(d)中的绿色和蓝色圆圈分别为Fang等(2015)和赵博等(2013)的结果中震源深度沿断裂带的投影,其他同图 6b. Figure 6 The along-strike projections of Lushan aftershocks The projections are centered at Lushan mainshock spanning from 12 km in the west to 20 km in the east. (a) The red squares show our result. The green squares and blue squares show the results of Fang et al. (2015) and Zhao et al. (2013) respectively. The orange star represents Lushan mainshock. (b) The red circles mark along-strike projection of focal depth in this paper and the black squares are the same as red ones in Fig. 6a. The inset figure is the histogram of focal depth after relocation. The green circles and blue circles in (c) and (d) mark along-strike projections of focal depth in Fang et al. (2015) and Zhao et al. (2013) respectively. Others are the same as in Fig. 6b. |
余震触发机制主要包括以下两个方面:其一为直接源于主震的静态应力与动态应力的触发;其二为由于主震破裂产生的准静态应力作用,其中准静态应力又包含震后余滑、黏弹性松弛、以及流体扩散等(Freed, 2005).
考虑到芦山与汶川地震发生距今已近5~10年之久,因此静态应力与动态应力均难以解释新近的余震活动.此外,准静态应力机制中的震后余滑是揭示早期余震的主要方式(Peng and Zhao, 2009;Tang et al., 2014;Wu et al., 2017),亦不适用于已达数年之久的龙门山断裂带的最新余震活动.准静态应力中的黏弹性松弛与流体扩散机制可以解释长达数年的余震活动,因此较为适用于龙门山断裂带新近的余震活动.然而,汶川余震主要分布在10~25 km深度上,距离该区壳幔边界(40~60 km)(Zhang et al., 2009)仍有距离,与黏弹性松弛模式主要发生在壳幔边界处并不相符,因此汶川余震更有可能因流体扩散机制触发.芦山新近余震主要向中上地壳迁移,与汶川新近余震相近,流体扩散亦是其可能的余震触发机制.
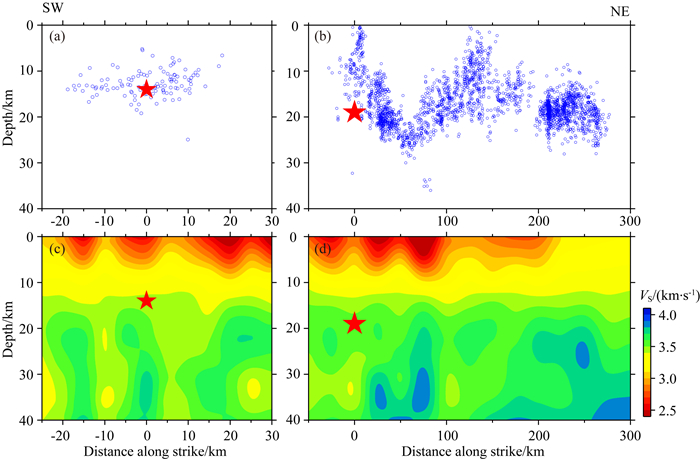
3.4 汶川地震与芦山地震最新余震分布比较由新近的汶川地震和芦山地震的余震分布可以看出(图 7),芦山地震的余震深度较浅,大部分分布在主震以浅,且数量较少.汶川地震的余震较深,大部分分布在25 km以浅,比主震深度更深的余震比例达到37.9%.汶川与芦山地震虽同发生在龙门山断裂带上,但其深部分布存在明显差异.结合该区速度结构可知,芦山地震区域下方高速层不明显,汶川地震段20 km以下有两个明显的高速层,呈现沿断裂带走向方向的速度不均匀性(梁春涛等,2018).我们认为汶川与芦山余震的深度分布趋势的这种差异,除与主震破裂特征密切相关外,亦有可能是龙门山断裂带介质速度不均匀性的表现.Lei和Zhao(2009)根据层析成像结果,指出汶川地震余震之所以主要分布在龙门山断裂带北段,与龙门山断裂带北段存在多个小尺度介质不均匀体相关,与本文结论相近.更详尽的工作,需要我们后期基于LmsSGA与断裂带周缘固定台站数据开展精细结构成像加以完善.

|
图 7 汶川地震与芦山地震最新余震分布 (a)、(b)分别同图 5b,6b;(c)、(d)分别是在芦山地震段和汶川地震段沿断裂带走向的S波速度结构(梁春涛等,2018). Figure 7 Distribution of the most recent aftershocks of Wenchuan and Lushan earthquakes (a) The same as Fig. 5b and (b) The same as Fig. 6b. (c) and (d) are S wave velocity along strike of Longmenshan Fault Zone in Lushan and Wenchuan rupture sections respectively (Liang et al., 2018). |
本文综合利用流动台阵LmsSGA与四川省地震局地震台网资料,对龙门山断裂带新近地震活动进行重定位.我们发现在汶川地震发生之后近十年,其余震活动依然活跃,震源深度主要分布在10~25 km区间内.汶川余震震源深度呈现西南段深而东北段浅的特征,西南段余震相比早期余震有向深部迁移的趋势.芦山余震活动性较弱,余震主要分布在10~15 km的深度区间内,相比早期余震有向浅部迁移的趋势.
考虑到汶川与芦山两次强震发生距今已分别有5~10年的时间,综合最新余震空间分布特征,我们指出现今余震的触发有可能因流体扩散这一准静态应力方式触发.另外,余震迁移现象在龙门山断裂带不同区域存在差异,暗示该断裂带介质存在横向不均匀性特征.未来,我们计划依据LmsSGA台阵的震相与波形数据,开展地震空段内速度结构成像工作,为该区地壳结构特征与地震危险性提供新的地震学依据.
致谢 中国地震局科学探测台阵提供仪器,中国地震局地球物理研究所提供技术支持.成都理工大学余洋洋、何富军、周鲁、刘志强、王朝亮、黄焱羚、曹飞煌、万子轩、江宁波等参与LmsSGA野外台阵布设工作.感谢中国地震局地球物理研究所王宝善研究员、许卫卫副研究员给予的野外工作指导.感谢中国科学院地质与地球物理研究所艾印双研究员、王一博研究员、田小波研究员、徐涛研究员、陈赟副研究员、四川省地震局易桂喜研究员、苏金蓉高级工程师、吴朋工程师、成都市防震减灾局郑松林工程师给予的协助.
Bai M K, Chevalier M L, Pan J W, et al. 2018. Southeastward increase of the late quaternary slip-rate of the Xianshuihe fault, eastern Tibet. Geodynamic and seismic hazard implications. Earth and Planetary Science Letters, 485: 19-31. DOI:10.1016/j.epsl.2017.12.045 |
Chen L C, Ran Y K, Wang H, et al. 2013. The Lushan MS7.0 earthquake and activity of the southern segment of the Longmenshan fault zone. Chinese Science Bulletin, 58(28-29): 3475-3482. DOI:10.1007/s11434-013-6009-6 |
Chen Y T, Yang Z X, Zhang Y, et al. 2013. From 2008 Wenchuan earthquake to 2013 Lushan earthquake. Scientia Sinica Terrae (in Chinese), 43(6): 1064-1072. |
Clark M K, Royden L H. 2000. Topographic ooze:Building the eastern margin of Tibet by lower crustal flow. Geology, 28(8): 703-706. DOI:10.1130/0091-7613(2000)28<703:TOBTEM>2.0.CO;2 |
Du F, Long F, Ruan X, et al. 2013. The M7.0 Lushan earthquake and the relationship with the M8.0 Wenchuan earthquake in Sichuan, China. Chinese Journal of Geophysics (in Chinese), 56(5): 1772-1783. DOI:10.6038/cjg20130535 |
Fang L H, Wu J P, Wang W L, et al. 2015. Aftershock observation and analysis of the 2013 MS7.0 Lushan earthquake. Seismological Research Letters, 86(4): 1135-1142. DOI:10.1785/0220140186 |
Freed A M. 2005. Earthquake triggering by static, dynamic, and postseismic stress transfer. Annual Review of Earth and Planetary Sciences, 33: 335-367. DOI:10.1146/annurev.earth.33.092203.122505 |
Gao Y, Wang Q, Zhao B, et al. 2013. A rupture blank zone in middle south part of Longmenshan Faults:Effect after Lushan MS7.0 earthquake of 20 April 2013 in Sichuan, China. Science China Earth Sciences, 57(9): 2036-2044. DOI:10.1007/s11430-014-4827-2 |
Huang Y, Wu J P, Zhang T Z, et al. 2008. Relocation of the MS8.0 Wenchuan earthquake and its aftershock sequence. Science in China Series D:Earth Sciences, 51(12): 1703-1711. DOI:10.1007/s11430-008-0135-z |
Hubbard J, Shaw J H. 2009. Uplift of the Longmen Shan and Tibetan Plateau, and the 2008 Wenchuan (M=7.9) earthquake. Nature, 458(7235): 194-197. DOI:10.1038/nature07837 |
Kato A, Obara K. 2014. Step-like migration of early aftershocks following the 2007 MW6.7 Noto-Hanto earthquake, Japan. Geophysical Research Letters, 41(11): 3864-3869. DOI:10.1002/2014GL060427 |
Lei J S, Zhao D P. 2009. Structural heterogeneity of the Longmenshan fault zone and the mechanism of the 2008 Wenchuan earthquake (MS8.0). Geochemistry, Geophysics, Geosystems, 10(10): Q10010. DOI:10.1029/2009GC002590 |
Lei J S, Zhang G W, Xie F R. 2014. The 20 April 2013 Lushan, Sichuan, mainshock, and its aftershock sequence:Tectonic implications. Earthquake Science, 27(1): 15-25. |
Li Y Q, Jia D, Wang M M, et al. 2014. Structural geometry of the source region for the 2013 MW6.6 Lushan earthquake:Implication for earthquake hazard assessment along the Longmen Shan. Earth and Planetary Science Letters, 390: 275-286. DOI:10.1016/j.epsl.2014.01.018 |
Li Z F, Peng Z G. 2016. An automatic phase picker for local earthquakes with predetermined locations:Combining a signal-to-noise ratio detector with 1D velocity model inversion. Seismological Research Letters, 87(6): 1397-1405. DOI:10.1785/0220160027 |
Liang C T, Huang Y L, Wang C L, et al. 2018. Progress in the studies of the seismic gap between the 2008 Wenchuan and 2013 Lushan earthquakes. Chinese Journal of Geophysics (in Chinese), 61(5): 1996-2010. DOI:10.6038/cjg2018M0254 |
Liu M, Luo G, Wang H. 2014. The 2013 Lushan earthquake in China tests hazard assessments. Seismological Research Letters, 85(1): 40-43. DOI:10.1785/0220130117 |
Lu R Q, Xu X W, He D F, et al. 2017. Seismotectonics of the 2013 Lushan MW6.7 earthquake:Inversion tectonics in the eastern margin of the Tibetan Plateau. Geophysical Research Letters, 44(16): 8236-8243. DOI:10.1002/2017GL074296 |
Pei S P, Zhang H J, Su J R, et al. 2014. Ductile gap between the Wenchuan and Lushan earthquakes revealed from the two-dimensional Pg seismic tomography. Scientific Reports, 4: 6489. DOI:10.1038/srep06489 |
Peng Z G, Zhao P. 2009. Migration of early aftershocks following the 2004 Parkfield earthquake. Nature Geoscience, 2(12): 877-881. DOI:10.1038/ngeo697 |
Shan B, Xiong X, Zheng Y, et al. 2013. Stress changes on major faults caused by 2013 Lushan earthquake and its relationship with 2008 Wenchuan earthquake. Science China Earth Sciences, 56(7): 1169-1176. DOI:10.1007/s11430-013-4642-1 |
Shi Z M, Wang G C, Wang C Y, et al. 2014. Comparison of hydrological responses to the Wenchuan and Lushan earthquakes. Earth and Planetary Science Letters, 391: 193-200. DOI:10.1016/j.epsl.2014.01.048 |
Tang C C, Lin C H, Peng Z G. 2014. Spatial-temporal evolution of early aftershocks following the 2010 ML6.4 Jiashian earthquake in southern Taiwan. Geophysical Journal International, 199(3): 1772-1783. DOI:10.1093/gji/ggu361 |
Thompson T B, Plesch A, Shaw J H, et al. 2015. Rapid slip-deficit rates at the eastern margin of the Tibetan Plateau prior to the 2008 MW7.9 Wenchuan earthquake. Geophysical Research Letters, 42(6): 1677-1684. DOI:10.1002/2014GL062833 |
Waldhauser F, Ellsworth W L. 2000. A double-difference earthquake location algorithm:Method and application to the northern Hayward fault, California. Bulletin of the Seismological Society of America, 90(6): 1353-1368. DOI:10.1785/0120000006 |
Wu J, Yao D D, Meng X F, et al. 2017. Spatial-temporal evolutions of early aftershocks following the 2013 MW6.6 Lushan earthquake in Sichuan, China. Journal of Geophysical Research:Solid Earth, 122(4): 2873-2889. DOI:10.1002/2016JB013706 |
Xu X W, Chen G H, Yu G H, et al. 2013. Seismogenic structure of Lushan earthquake and its relationship with Wenchuan earthquake. Earth Science Frontiers (in Chinese), 20(3): 11-20. |
Zhang G W, Lei J S. 2013. Relocations of Lushan, Sichuan strong earthquake (MS7.0) and its aftershocks. Chinese Journal of Geophysics (in Chinese), 56(5): 1764-1771. DOI:10.6038/cjg20130534 |
Zhang Z J, Wang Y H, Chen Y, et al. 2009. Crustal structure across Longmenshan fault belt from passive source seismic profiling. Geophysical Research Letters, 36(17). DOI:10.1029/2009GL039580 |
Zhao B, Shi Y T, Gao Y. 2011. Relocation of the Wenchuan MS8.0 Earthquake Sequence. Earthquake (in Chinese), 31(2): 1-10. |
Zhao B, Gao Y, Huang Z B, et al. 2013. Double difference relocation, focal mechanism and stress inversion of Lushan MS7.0 earthquake sequence. Chinese Journal of Geophysics (in Chinese), 56(10): 3385-3395. DOI:10.6038/cjg20131014 |
Zhao Z, Zhang R S. 1987. Primary study of crustal and upper mantle velocity structure of Sichuan province. Acta Seismologica Sinica (in Chinese), 9(2): 154-166. |
Zheng Y, Ge C, Xie Z J, et al. 2013. Crustal and upper mantle structure and the deep seismogenic environment in the source regions of the Lushan earthquake and the Wenchuan earthquake. Science China Earth Sciences, 56(7): 1158-1168. DOI:10.1007/s11430-013-4641-2 |
陈立春, 冉勇康, 王虎, 等. 2013. 芦山地震与龙门山断裂带南段活动性. 科学通报, 58(20): 1925-1932. |
陈运泰, 杨智娴, 张勇, 等. 2013. 从汶川地震到芦山地震. 中国科学:地球科学, 43(6): 1064-1072. |
杜方, 龙锋, 阮祥, 等. 2013. 四川芦山7.0级地震及其与汶川8.0级地震的关系. 地球物理学报, 56(5): 1772-1783. DOI:10.6038/cjg20130535 |
高原, 王琼, 赵博, 等. 2013. 龙门山断裂带中南段的一个破裂空段——芦山地震的震后效应. 中国科学:地球科学, 43(6): 1038-1046. |
黄媛, 吴建平, 张天中, 等. 2008. 汶川8.0级大地震及其余震序列重定位研究. 中国科学D辑:地球科学, 38(10): 1242-1249. |
梁春涛, 黄焱羚, 王朝亮, 等. 2018. 汶川和芦山地震之间地震空区综合研究进展. 地球物理学报, 61(5): 1996-2010. DOI:10.6038/cjg2018M0254 |
单斌, 熊熊, 郑勇, 等. 2013. 2013年芦山地震导致的周边断层应力变化及其与2008年汶川地震的关系. 中国科学:地球科学, 43(6): 1002-1009. |
徐锡伟, 陈桂华, 于贵华, 等. 2013. 芦山地震发震构造及其与汶川地震关系讨论. 地学前缘, 20(3): 11-20. |
张广伟, 雷建设. 2013. 四川芦山7.0级强震及其余震序列重定位. 地球物理学报, 56(5): 1764-1771. DOI:10.6038/cjg20130534 |
赵博, 石玉涛, 高原. 2011. 汶川MS8.0地震及余震序列重新定位. 地震, 31(2): 1-10. |
赵博, 高原, 黄志斌, 等. 2013. 四川芦山MS7.0地震余震序列双差定位、震源机制及应力场反演. 地球物理学报, 56(10): 3385-3395. DOI:10.6038/cjg20131014 |
赵珠, 张润生. 1987. 四川地区地壳上地幔速度结构的初步研究. 地震学报, 9(2): 44-56. |
郑勇, 葛粲, 谢祖军, 等. 2013. 芦山与汶川地震震区地壳上地幔结构及深部孕震环境. 中国科学:地球科学, 43(6): 1027-1037. |
 2019, Vol. 62


