2. 中国科学院大学, 北京 100049
2. University of Chinese Academy of Sciences, Beijing 100049, China
一直以来上地幔都是地球科学研究的一个重点,地震数据显示上地幔广泛存在低速层(The MELT Seismic Team,1998;Krishna et al., 1991;Hansen et al., 2009;Freybourger et al., 2001;James et al., 2004),大地电磁数据测得很多低速层的电导率高达0.1 S·m-1(Jones et al., 2001, 2003;Patro et al., 2009;Evans et al., 2011),对于这些广泛存在的低速高导层的成因,地球物理学家进行了大量的讨论(Presnall et al., 1972;Shankland and Waff, 1977;Tyburczy and Waff, 1983;Karato,1990;Hirschmann,2010).高温高压下矿物和岩石的电导率实验结果也为此提供了许多直接的证据.
通过高温高压电导率实验研究地球内部结构和物质组成这一工作已经进行了近一个世纪,目前认为上地幔高导成因的主流观点有三种:第一种是硅酸盐发生部分熔融形成上地幔低速高导层.Shankland和Waff(1977)及Tyburczy和Waff(1983)通过相关研究,绘制出温度—熔体组分—电导率图,估算出0.1 S·m-1的电导率所需硅酸盐熔体比例大约在5 vol.%~10 vol.%(体积分数比)之间.Yoshino等(2010a)的实验研究认为需要1 vol.%~3 vol.%的硅酸盐熔体才可以解释海洋软流圈的高导现象.Ni等(2011a)也通过测量含水玄武质熔体的电导率指出,在含0.0125 wt.%(质量百分比)水的地幔中(假设水在熔体与矿物中的分配系数为0.006),2 vol.%的玄武质熔体可以解释地震观测到的东太平洋中脊下的低速高导层(0.1 S·m-1).第二种是水对岩石、矿物电导率的影响,Karato(1990)、Huang等(2005)、Wang等(2006)、Yoshino等(2006)、Dai和Karato(2009a)和Yang等(2011)等的研究都证明水增强了矿物的电导率.Wang等(2006)认为只需要约0.008 wt.%的水就可以解释大洋软流圈下部的高导(0.1 S·m-1)现象,但Yoshino等(2006, 2008, 2009)认为至少需要0.1 wt.%的水才能解释海洋软流圈的异常高导(0.1 S·m-1),而该温压条件下橄榄石最多只能溶解0.03 wt.%的水.第三种是碳酸盐熔体对岩石电导率有明显的提升作用.Gaillard等(2008)、Yoshino等(2012)、黄小刚等(2012)和彭伟(2012)发现碳酸盐熔体对橄榄岩电导率的提升要比硅酸盐熔体对橄榄岩电导率的提升高一个数量级以上,其中Gaillard等(2008)、Yoshino等(2012)、黄小刚等(2012)分别估算得出0.1 vol.%、0.17 vol.%和0.1 vol.%~0.3 vol.%的碳酸熔体可解释海洋软流圈0.1 S·m-1的高导.
克拉通作为地球上最稳定的区域,对该类地区进行大地电磁和电磁测深等研究工作有非常重要的意义.Jones等(2003)通过对加拿大Slave克拉通进行大地电磁研究,发现其中部Lac de Gras地区约80~120 km深处存在异常高导(0.1 S·m-1),并提出这一高导层可能是矿物颗粒边界存在连通的石墨或金刚石所导致的.Wang等(2013)指出含1 wt.%碳的橄榄石能够解释一些地区的高导,而Zhang和Yoshino(2017)的研究结果显示石墨存在于橄榄石颗粒边界时需要很高的表面能和很大的二面角(~98°),对于地球内部碳含量及其存在形式,目前还存在很多的争论.Bagdassarov等(2007)也对Slave克拉通地区的地幔包体进行过电导率实验,认为亏损的尖晶石橄榄岩能够解释Slave克拉通大部分区域的电导率,而中部约80~120 km处0.1 S·m-1的高电导率可以用更细矿物颗粒组成的岩石来解释.Nixon(1987)通过对地幔包体的研究得出,一般矿物颗粒粒径都大于10 μm,大部分大于100 μm.而Yang和Heidelbach(2012)则认为,大于5 μm的矿物颗粒在电导率方面并没有明显差异.Patro等(2009)在印度西部Deccan火成岩省进行了大地电磁研究,发现该地区约80~120 km深处存在类似于Slave克拉通中部的异常高导,但并未对这一异常高导给出明确的解释.为了对金伯利岩岩浆产出区域约80~120 km深处的异常高导进行合理解释,我们需要了解金伯利岩岩浆的形成过程.Russell等(2012, 2013)通过实验模拟提出金伯利岩岩浆可由碳酸盐熔体在快速上升过程中吸收同化地幔中的斜方辉石而形成,而这一新模式与Canil和Scarfe(1990)、Ringwood等(1992)、Girnis等(1995)和Ulmer和Sweeney(2002)所提出的模式存在差异.对于这种全新的模式,碳酸盐在其中所扮演的角色和对电导率的影响又是如何?本文通过分别测量含碳酸盐和/或硅酸盐的地幔岩在1.0~3.0 GPa、673~1873 K温压条件下的电导率来讨论这一模式的合理性,并试图对Slave克拉通中部Lac de Gras地区约80~120 km深处存在的异常高导层进行解释.
1 实验和实验结果 1.1 初始样品本次研究的实验样品共有6个,均由90 wt.%(如无说明,均为质量百分比)地幔岩粉末加上不同比例的碳酸盐和/或硅酸盐粉末组成,详见表 1.本次实验所使用的橄榄石、斜方辉石、单斜辉石和石榴子石均挑选于大麻坪二辉橄榄岩和石榴子石橄榄岩中,方解石挑选于沉积的白云岩中.使用前,我们对这些天然矿物和岩石进行单独研磨,使粉末粒度均小于63 μm,并采用X-射线荧光光谱分析法对各天然矿物和岩石做了成分分析(见表 2).依据Ringwood(1975)提出的地幔岩(pyrolite)模型(57%橄榄石,14%石榴子石,17%斜方辉石和12%单斜辉石),使用精度为0.00001 g的电子天平进行称量,首先进行地幔岩的配比,然后按照实验所需加入不同比例的碳酸盐和/或硅酸盐粉末,最后对配好的样品手工研磨6 h以上,以确保样品混合均匀.
|
|
表 1 实验样品组成 Table 1 Components of experiment samples |
|
|
表 2 样品中矿物的成分 Table 2 Compositions of samples |
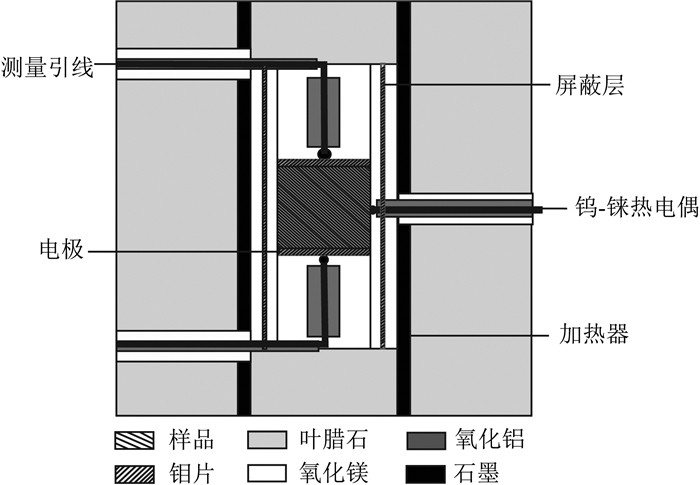
高温高压实验是在中国科学院地球化学研究所地球内部物质高温高压重点实验室的DS 3600 t六面顶压机装置上完成的.实验样品组装见图 1,采用边长约32.5 mm的立方体叶腊石块作为传压介质,外径14 mm、内径12.5 mm的石墨套管作为加热器,外径9 mm、内径6 mm、高18 mm和外径12.5 mm、内径9 mm、高20 mm的双层圆柱状氧化镁套管作为绝缘套管,中间夹入一层厚0.05 mm的钼片作为屏蔽层.在粉末样品两端分别放置直径6 mm、厚度1 mm的钼片作电极片.利用Mo-MoO2的固体反应来控制样品的氧逸度.用W95Re5-W74Re26热电偶来监测样品内的温度.

|
图 1 实验样品组装图 Fig. 1 The experimental assembly |
组装之前,先将叶腊石块、氧化镁套管、氧化铝陶瓷管、氧化镁粉和叶腊石堵头等组件放进马弗炉,然后逐渐升温至1173 K并保持1 h以上,除去其中的吸附水和结晶水,尽可能地减小外界因素对实验结果的影响.将混合均匀的粉末装入如图 1所示的样品腔内,手工压实.样品组装好后,将其放进烘箱,加温至423 K,烘烤12 h以上,尽量去除样品中的吸附水.
将组装好的样品放入DS 3600 t六面顶压机内,进行热压处理.将实验样品所受围压先升至目标压力,然后缓慢升温至目标温度,持续10 h以上,然后降至373 K左右.电导率测量初始温度一般选择773 K(1号和3号样品分别为723 K和673 K),测量温度间隔根据样品内所含组分不同选择20~100 K.每个温度点至少稳定15 min再进行电导率测量,并且会进行多次测量来确保样品内部已达到平衡状态.大部分实验样品在升温-降温-再升温这样一个半来回的升降温过程中进行样品的电导率测量,含碳酸盐的部分样品进行了两个甚至两个半来回的电导率测量,以确保实验数据的准确性和有效性.因为无水Na2CO3粉末样品在常压下的熔点为1124 K,黄小刚等(2012)结果中显示Na2CO3在橄榄岩样品中的熔点约为993 K,所以含Na2CO3的样品在进行第一个来回的电导率测量中,温度控制在973 K以下.
1.3 实验结果使用Solartron 1260阻抗/增益-相位分析仪测量并获取样品的阻抗谱数据,图 2a是1号样品在1.0 GPa、573~953 K条件下第一次升降温及第二次部分升温的阻抗谱图.从图中可以看出升温测量过程中,样品电阻随着温度的升高而降低,阻抗谱图呈现近似半圆弧的形状,且同一温度点升温测量和降温测量得到的阻抗谱基本重合.Huebner等(1995)、王多君等(2005)和代立东等(2005)均提出多晶矿物的高频段半圆弧代表样品颗粒内部的传导机制,中频段半圆弧代表颗粒边界的传导机制,低频段线段代表样品-电极的传导机制.参照相关的研究成果,我们认为图 2a中半圆弧代表着样品颗粒内部和颗粒边界的传导.图 2b是1号样品在1.0 GPa、1073~1373 K温压条件下第一次升温和第一次降温的阻抗谱图,两次测量的阻抗谱多不重合.在1073~1273 K温度区间内,升温过程中得到的阻抗谱虽然随温度的升高而减小,但变化幅度并不明显,甚至在1073 K和1123 K这两个温度点出现阻抗谱基本重合的情况.而该温度区间对应降温的阻抗谱半径则随着温度的降低而增大,意味着样品电阻随温度的降低而增高.对于温度区间1073~1273 K内升降温测得的阻抗谱不重合,我们认为主要是因为样品内部成分发生变化所引起的.

|
图 2 (a), (b)分别是1.0 GPa、773~953 K和1.0 GPa、1073~1373 K的实验条件下1号样品的阻抗谱,其中,(a)中升温和降温过程中获得的阻抗谱基本重合,(b)中升温和降温过程中获得的阻抗谱多不重合 Fig. 2 Representative complex impedance spectra composed of real (Z′) and imaginary (Z″) parts of the complex impedance for sample No.1 at 1.0 GPa、773~953 K (a) and 1.0GPa、1073~1373 K (b). In figure 2a, the impedance arcs in the first heating are coincided with that in the first cooling at the same temperature. In figure 2b, the impedance arcs in the 2nd heating are not coincided with that in the 2nd cooling at the same temperature |
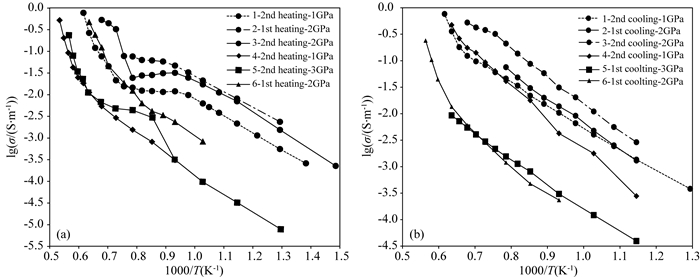
利用一个电阻并联一个恒相元素(CPE)的模拟电路拟合样品在不同温度点的阻抗谱(即拟合如图 2中的每个半圆弧),得到样品的电阻值.由公式σ=L/(πr2R)计算得到样品的电导率,式中σ代表样品的电导率,L代表圆柱状样品的长度,r是圆形电极片的半径,R是拟合得到的样品电阻.电导率测量完成后,我们对恢复样品进行长度、直径的测量,对圆形电极再次进行直径的测量,最终确定样品的长度L和电极的半径r,从而计算得到样品的电导率σ,并在图 3a、3b中分别展示了样品在升温和降温过程中电导率对数与温度倒数的关系.我们选取1号样品为例进行扫描电镜分析(SEM),通过获取其背散射图像(BSE),结合能谱(EDS)数据,确认了1号样品实验后的产物仅包含碳酸盐化的硅酸质熔体、橄榄石和单斜辉石,如图 4.我们将这一图像结果与电导率相结合,认为图 3a、3b分别显示的是样品在熔融和结晶过程中电导率随温度变化的情况.从图 3中可以直观地看出:(1)在样品发生部分熔融之前(低温段),样品的电导率随温度的增加而缓慢增加,含Na2CO3样品的电导率明显高于含CaCO3和MORB样品的;(2)含Na2CO3的样品在1023 K左右发生熔融,在1073~1273 K这一约200 K的温度区间内,其电导率几乎不变,之后,样品的电导率随温度的增加而大幅增加;(3)含MORB的样品,在2.0~3.0 GPa、1473 K之后发生熔融,样品的电导率随温度的增加而快速增加;(4)1.0 GPa下,含10% CaCO3的地幔岩样品在1473 K时地幔岩发生熔融,3.0 GPa下,含5% CaCO3+5% MORB的地幔岩样品在1473 K时MORB开始熔融,在1723 K时又发生了CaCO3的熔融;(5)电导率对数与温度倒数呈分段线性关系.

|
图 3 含碳酸盐熔体和硅酸盐熔体的地幔岩样品在1.0~3.0 GPa、773~1873 K条件下的电导率随温度变化的情况 (a)样品升温至发生熔融后的电导率曲线;(b)样品发生部分熔融后从高温开始降温后的电导率曲线. Fig. 3 The electrical conductivity of bearing-carbonate samples and bearing-MORB sample at 1.0~3.0 GPa、773~1873 K during heating (a) and cooling after the maximum annealing temperature (b) |

|
图 4 1号样品背散射图像(BSE) Fig. 4 Back-scattered electron images of No.1 sample |
样品未发生部分熔融之前(至少在第一次升温之后),样品的电导率几乎不受循环路径和压力的影响,如图 5a和5b所示.对含碳酸盐的样品而言,熔融发生之后,熔体成分不断改变,升温熔融过程中的电导率不再与降温结晶过程中的电导率重合(图 5a),在高温段(1073~1573 K)升温熔融过程中的电导率明显低于降温结晶过程中的(除2号和5号样品,2号样品热压温度偏高,至1173 K,在2.0 GPa下,电导率测量的最高温只到1273 K.5号样品在3.0 GPa下升温到1873 K,样品发生了熔融,但没有降温数据).另外,对比同一样品、同一实验过程(升温过程或降温过程)的实验结果发现:压力对部分熔融样品的电导率有一定的影响,即:相同温度下,部分熔融样品的电导率随着压力的增加而降低,如图 5c所示.

|
图 5 循环路径和压力对样品电导率的影响. (a,b,c)分别对应的是No.1,No.5和No.6样品 Fig. 5 (a, b, c) is the effect of looped pathways and pressures on the electrical conductivity of No 1, No 5 and No 6 sample |
因为样品的电导率对数与温度倒数呈分段线性关系,故此,对图 3中各样品低温段的数据和高温段的数据分别进行线性拟合,得到斜率,利用Arrhenius公式:σ=σ0exp(-ΔH/(RT)),式中σ0为指前因子(S·m-1),ΔH为物质的活化焓(kJ/mol),R为理想气体常数(8.31 J/(K·mol)),T为绝对温度(K),计算得到lnσ0和ΔH,见表 3.
|
|
表 3 由Arrenhius关系式拟合得到实验样品的指前因子和激活焓 Table 3 Fitted parameters for the electrical conductivity of samples by using Arrenhius relationship |
人们进行了大量MORB或碳酸盐熔体对橄榄石集合体电导率影响的研究,并据此讨论了高导层的成因(Presnall et al., 1972;Chan et al., 1973;Gaillard et al., 2008;Hirschmann,2010;Yoshino et al., 2010, 2012;Sifré et al., 2014,2015;黄小刚等,2012;彭伟,2012).但熔体对岩石,如二辉橄榄岩、榴辉岩、地幔岩等电导率影响的研究相对较少(黄晓葛等,2017).本文进行了高温高压下碳酸盐对地幔岩电导率影响的研究,其中1—3号样品中加入了Na2CO3,4—5号样品中加入了CaCO3,通过与前人结果的对比,我们来讨论两种碳酸盐对地幔岩电导率的影响.
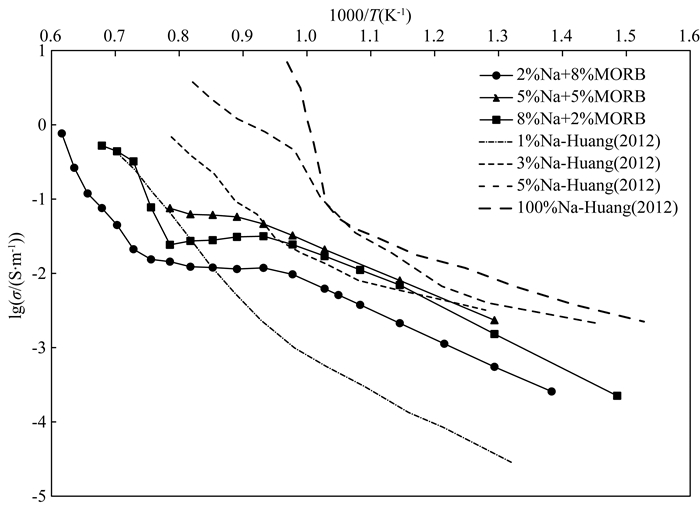
图 6对比了含Na2CO3的地幔岩和含Na2CO3的橄榄岩的电导率实验结果,其中实线是本研究中1号、2号和3号样品升温发生熔融后的电导率曲线,虚线是黄小刚等(2012)第二次升温时的电导率曲线(第一次升降温中最高温度控制在973 K之下,样品内没有发生熔融).从图 6中我们可以看出,样品的电导率随Na2CO3含量的增加而增加.我们的1、2、3号样品在1023 K左右开始熔融,黄小刚等(2012)的含Na2CO3橄榄岩样品在993 K处发生熔融,Russell等(2012)指出纯Na2CO3在常压、1124 K开始熔融,我们的实验结果介于二者之间.黄小刚等(2012)给出的初融温度比我们的低约30 K左右,这可能是初融时低熔体比例对不同样品的电导率具有不同的敏感性,反映在电导率对数和温度倒数图中,二者的初融温度就出现了差别.

|
图 6 在1.0~3.0 GPa、773~1573 K的实验条件下,对比含Na2CO3的地幔岩和橄榄岩的电导率结果 实线是本文的结果,虚线是黄小刚等(2012)的结果. Fig. 6 Comparison of the electrical conductivity of Na2CO3-bearing pyrolite with Na2CO3-bearing peridotite at 1.0~3.0 GPa and 773~1573 K The solid lines indicate our experimental results, the dashed lines indicate those of Huang et al. (2012). |
熔融后,我们的1—3号样品的电导率出现一个非常有意思的现象,即在1073~1273 K区间内随温度的增加,样品的电导率基本不发生变化.Russell等(2012, 2013)基于Na2CO3+斜方辉石体系的高温熔融实验数据,提出了一种新的金伯利岩岩浆的形成机制,即深部碳酸质熔体在快速上升过程中迅速同化混染地幔中的斜方辉石,形成碳酸盐化的硅酸盐熔体,也就是金伯利岩岩浆.在同化混染过程中,熔体中MgO和SiO2的含量线性增加,Na2O刚开始略有上升,之后缓慢下降,熔体中CO2的含量持续下降(见Russell等(2013)文章图 5).根据Russell等(2012, 2013)的实验结果,我们推测:如果熔体中钠离子是主要的导电载体,则在同化混染的过程中,其电导率不会大幅增加,而是略有降低,这与我们1、2、3号样品在1073~1273 K温度区间内,随温度的增加,样品的电导率几乎不变的情况相符合.据此,我们认为:在1073~1273 K温度区间,1—3号样品的电导率不发生变化的现象可能是由Na2CO3熔体吸收同化斜方辉石造成的.在黄小刚等(2012)的实验结果中,当Na2CO3熔融之后,样品的电导率大幅增加,没有出现电导率几乎不变的情况,这主要是由于他们的体系是Na2CO3+橄榄石,而橄榄石很难被含Na2CO3的熔体所同化(Russell et al., 2012, 2013).故此,我们认为,当样品内碳酸质熔体与斜方辉石发生同化作用,熔体成分由最初的碳酸质逐渐变为碳酸盐化的硅酸质,在此过程中,样品内的电导率几乎不变.也就是说,处于地幔深部的碳酸质岩浆快速上升并同化吸收斜方辉石,在形成金伯利岩岩浆的过程中,岩浆的电导率几乎不发生变化.在1273 K之后,样品电导率的大幅增加是由于硅酸盐熔体比例随温度的上升而大幅增加所致.
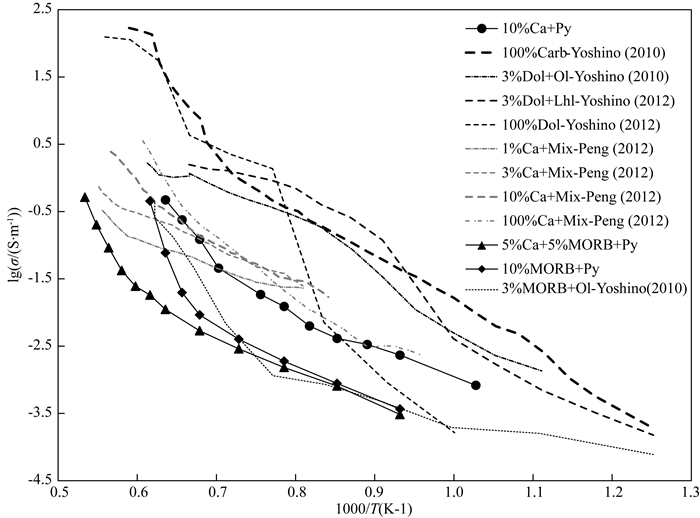
图 7对比了含MORB和CaCO3样品的电导率实验结果.我们的地幔岩+10% MORB样品的电导率在1.0 GPa、1373 K之后快速增加,而Maumus等(2005)和Yoshino等(2010a)也进行过类似的橄榄石+MORB样品的电导率测量,样品的电导率分别在1.0 GPa、1428 K和1.5 GPa、1360 K之后大幅增加,并且认为是样品内MORB的熔融所导致的.我们的实验初始样品与Maumus和Yoshino的略有不同,但所有实验结果得到的MORB初融温度大体一致(1360 K左右),并且在液相线之下(1500 K),我们含10% MORB的地幔岩样品的电导率与Yoshino的含3% MORB的橄榄岩样品的电导率值基本相同.我们的含5% MORB+5% CaCO3的地幔岩样品在3.0 GPa、1473 K开始熔融(图 7),是样品中的MORB发生了熔融(Yasuda et al., 1994;Yaxley,2000;Pertermann and Hirschmann, 2003a,2003b),而不是CaCO3发生了熔融(Irving和Wyllie(1975), Bagdassarov和Slutskii(2003)和Sifré等(2015)分别给出纯CaCO3在3.0 GPa下的熔融温度是1773 K、1700 K和1833 K),这一熔融温度比其他实验给出的结果低约50~100 K(Yasuda等(1994),Yaxley(2000)和Petermann和Hirschmann(2003a, 2003b)给出的实验结果是MORB在3.0 GPa、1523~1583 K发生熔融),这或许是由于我们样品中的化学组分不同所引起的(Pickering-Witter and Johnston, 2000;Dasgupta et al., 2005).在图 3a中,我们发现,在MORB发生熔融之后,含10% MORB和含5% MORB+5% CaCO3的部分熔融样品的电导率在1473~1673 K之间基本吻合,但温度升至1723 K之后,含5% MORB +5% CaCO3的部分熔融样品的电导率似乎增加的幅度远低于含10% MORB的,这或许是由于CaCO3开始熔融所致.

|
图 7 我们的含CaCO3地幔岩和含CaCO3橄榄岩(Yoshino et al., 2010a)、含CaCO3二辉橄榄岩(彭伟,2012)的电导率实验结果对比 实线是本研究的结果,黑色虚线是Yoshino等(2010a, 2012)的结果,灰色虚线是彭伟(2012)的结果. Fig. 7 Comparison of the electrical conductivity of CaCO3-bearing pyrolite with CaCO3-bearing peridotite and CaCO3-bearing lherzolite The solid lines indicate experimental results of this study, the black dashed lines indicate those of Yoshino et al.(2010a, 2012), the gray dashed lines indicate those of Peng (2012). |
从图 7中我们还可以看出,在低温段(≤1423 K),含白云石橄榄岩样品的电导率(Yoshino et al., 2010, 2012)远远高于含MORB样品和含CaCO3样品的电导率(Yoshino et al., 2010;彭伟,2012),我们猜测这主要是因为白云石的电导率本就远远高于CaCO3和MORB的.我们含10% CaCO3地幔岩样品的电导率在低温段(≤1423 K)低于纯CaCO3样品的电导率(彭伟,2012),但两条曲线基本平行,温度升高到1423 K之后,我们样品的电导率开始增加,推测是1.0 GPa下地幔岩本身发生了熔融(Herzberg et al., 2000).Yoshino等(2010, 2012)和彭伟(2012)的实验都是在3.0 GPa下进行的,实验结果都显示在碳酸盐发生熔融之前硅酸质组分并没有发生熔融.Yoshino等(2010, 2012)发现天然碳酸盐岩和白云石的电导率在1625 K(3.0 GPa)之后大幅增加,这一温度点与Irving和Wyllie(1975)的熔融实验结果相一致.但Yoshino等(2012)还在3.0 GPa下进行过含白云石的二辉橄榄岩的电导率测量,其从1500 K淬火下来的实验后样品中发现了碳酸盐熔体,这一温度点比Irving和Wyllie(1975,1623 K)的低约110 K.彭伟(2012)的实验样品为含CaCO3的二辉橄榄岩(60%橄榄石+25%斜方辉石+15%单斜辉石),其结果显示在1723 K之后样品的电导率开始快速增加,并且认为这是CaCO3发生熔融所致.根据Yoshino等(2010, 2012)和彭伟(2012)的实验结果,我们推测本次研究样品中的CaCO3可能也是在1723 K左右才开始熔融(Irving and Wyllie, 1975;Bagdassarov and Slutskii, 2003;Sifré et al., 2015).Yoshino认为碳酸盐在刚发生熔融之后可以极大地增加样品的电导率,之后,随着温度的增加,熔体成分由碳酸质变为硅酸质,部分熔融样品的电导率随熔体比例的增加而增加,图 7中我们的含5% MORB+5% CaCO3的实验样品也显示了这一结果,在1723 K之后因为CaCO3的熔融,其电导率显著增加.
图 7中我们的4号(含10% CaCO3)和5号(含5% MORB+5% CaCO3)地幔岩的电导率分别是在1.0 GPa和3.0 GPa压力下测量获得的,二者相差1个数量级左右,并且随着温度的增加,到1623 K,二者相差近2个数量级.虽然压力对电导率有一定的影响,但这一影响并不是很大(Xu et al., 2000;Sifré et al., 2015;Dai and Karato, 2009b,2014;Dai et al., 2016),而这两个样品的电导率有如此巨大的差别可能还是由样品中所含组分决定的.在图 6中,含Na2CO3样品(我们的1—3号样品)在温度区间1073~1273 K内,随温度的增加,部分熔融样品的电导率几乎不变.在图 7中,含CaCO3(我们的4、5号样品)样品中并没有发现如1—3号样品所示的电导率异常现象,这是因为二者的熔融顺序不同所致.在1—3号样品中,Na2CO3先发生熔融,同化吸收样品中的斜方辉石,导致样品中熔体成分发生变化.尽管熔体比例随温度的增加也在增加,但部分熔融样品的电导率并没有大幅增加.而在4—5号样品中,因为样品中的硅酸质组分先发生熔融,随着温度的增加,熔体比例增加,相应地,部分熔融样品的电导率也在增加.之后,尽管样品中CaCO3发生了熔融,但没有改变熔体仍是硅酸质的这一特性,故也没有极大地增强或减弱部分熔融样品的电导率.
2.2 传导机制样品的电导率对数与温度倒数的分段线性关系反映了样品内导电机制的改变,表 3给出了我们根据Arrhenius公式计算的6个样品在低温段和高温段的活化焓.从表中可以看出,本次研究中含Na2CO3+MORB的地幔岩(1—3号样品)在低温段(≤1023 K)的活化焓介于0.71~0.90 eV之间;当温度高于1323K时,样品活化焓均大于2 eV.黄小刚等(2012)实验获得的含3% Na2CO3的橄榄石样品在熔融前的活化焓为0.62 eV.我们的结果略高于黄小刚等(2012)的,这是因为二者的样品不同而引起的.通过将1—3号样品的电导率值与王欣欣等(2016)所测地幔岩电导率值对比,发现我们含Na2CO3地幔岩的电导率要比同温度下地幔岩的电导率高2个数量级左右.对于含Na2CO3+MORB的地幔岩在低温下的高电导率、低活化焓表现,我们认为此时样品内的载流子以钠离子占主导,小极化子对样品电导率的影响很小(Ni et al., 2011a, b).而对于1073~1273 K温度区间内的超低活化焓,我们推测可能是受到Na2CO3熔体同化混染斜方辉石的影响,熔体中的钠离子先略微增加,后续不断减少,能够导电的钠离子保持在一定的数量范围内.当温度升至1323 K时,我们含Na2CO3+MORB样品的活化焓都大于2 eV,熔体组分已由碳酸盐化的硅酸盐变为硅酸盐,样品内的导电机制由MORB熔体内的导电离子控制,但钠离子仍会参与其中(Katsura et al., 2009;Yoshino,2010).
含10% CaCO3的地幔岩(4号样品)和含10% MORB的地幔岩(6号样品)在1.0~3.0 GPa压力下低温段的活化焓均在1 eV左右,而同时含有5% CaCO3+5% MORB的地幔岩(5号样品)在1.0~3.0 GPa、773~1423 K温压条件下的活化焓分别为0.95 eV、0.86 eV和0.93 eV,略低于4号和6号样品.我们对比了彭伟(2012)、黄小刚等(2012)、王欣欣等(2016)的研究结果,彭伟(2012)给出含1% CaCO3橄榄岩和纯CaCO3(1283~1600 K)活化焓分别为0.90 eV和1.80 eV;黄小刚等(2012)给出含10%MORB的橄榄岩的活化焓为1.02 eV;王欣欣等(2016)的实验结果显示地幔岩的活化焓在1.0~3.0 GPa压力下分别为1.09 eV、1.06 eV和0.99 eV).结合表 2中本次研究所用初始物质的化学组分(MORB含有较高的氧化钠和铁的氧化物,石榴子石中铁的氧化物含量更是达到了~23%),我们认为4—6号样品在低温下以小极化子导电为主.Dingwell和Webb(1990)指出硅酸盐体系内钠离子等小半径碱性离子的扩散受晶体结构影响较小,所以4—6号样品中的钠离子在较低温下也参与导电.4—6号样品在高温段的活化焓均大于2 eV,表明导电机制由小极化子导电转变成离子导电(Katsura et al., 2009;Yoshino,2010),而6号样品的高活化焓是因为其为纯硅酸盐体系,而4号和5号样品在高温条件下MORB先发生熔融,之后可能与样品中的CaCO3相互作用导致熔体中钙含量较多,从而降低了样品的活化焓.
2.3 Slave克拉通中部Lac de Gras地区约80~120 km处电导率解释Jones等(2003)通过大地电磁研究测得Slave克拉通中部Lac de Gras地区约80~120 km深处的电导率高达0.1 S·m-1,无论是矿物颗粒边界连通的碳单质,还是更细的亏损尖晶石橄榄岩,都无法解释这些较浅部位的高导异常(Zhang and Yoshino, 2017;Yang et al., 2012).对于这种深度的异常高导,前人提出过水、硅酸盐熔体和碳酸盐熔体三种可能的解释,而与克拉通地区关系最紧密的就是碳酸盐熔体.Gaillard等(2008)指出碳酸盐对岩石和矿物的电导率提升最为显著,纯碳酸盐熔体在常压下的电导率在100 S·m-1以上.Yoshino等(2012)通过测量加入天然白云岩的橄榄岩样品的电导率指出西北太平洋200~250 km深处的异常高导(0.1 S·m-1)仅需0.5 vol.%的碳酸盐熔体即可解释,彭伟(2012)通过研究加入CaCO3的橄榄岩样品的电导率推算出大洋软流圈上地幔0.1 S·m-1高导区所需的碳酸盐熔体约为0.17 vol.%.
本次研究同时测量了含Na2CO3地幔岩和含CaCO3地幔岩的电导率,测量结果在我们的样品体系中表现出很大差异(见图 3).因为CaCO3在样品中的熔点很高,在3.0 GPa压力下的熔点约1723 K,这一温度远远高于Slave克拉通中部约80~120 km处的温度(Bagdassarov et al., 2007),而且CaCO3在低温段对地幔岩电导率的提升作用远低于Na2CO3,所以,这里我们仅尝试用含Na2CO3地幔岩来解释Slave克拉通中部深约80~120 km处的高导异常.我们选用了Hashin-Shtrikman模型(H-S,Hashin and Shtrikman, 1962)、管状模型(Schmeling,1986)和立方体模型(Waff,1974)来约束本次实验1023 K温度下的实验结果.对于H-S模型、管状模型和立方体模型,我们根据本样品所采用的体系,选用Bagdassarov等(2007)测量的Slave克拉通地幔包体电导率(10-4.5S·m-1)作为固体样品的电导率,根据对黄小刚等(2012)和Sifré等(2015)测量的含钠碳酸盐熔体的电导率综合考虑,选取10 S·m-1作为1023 K温度下的熔体电导率.根据模型约束出区间后(图 8),同时将本次实验含Na2CO3的三块地幔岩在1023 K温度下的测量结果投点到图中(假定1023 K时样品内的Na2CO3全部熔融,且假定Na2CO3的熔体比例与初始物质中所含的质量比大体相同),我们发现1023 K温度下的实验结果落在H-S模型上下边界内,且更靠近上边界.我们依据H-S模型计算出1023 K温度下含Na2CO3熔体的地幔岩电导率达到0.1 S·m-1时需要的熔体比例~1.5 vol.%,这一计算结果与地球物理观测到的数据基本吻合(~1 vol.%-3 vol.%).使用我们1号样品(含2% Na2CO3地幔岩)的激活焓和指前因子,进行了实验数据和Slave克拉通地区大地电磁观测数据的对比,如图 9所示.该剖面所使用的地热梯度是根据Menzies等(2004)和Brey和Köhler(1990)的实验结果拟合得到的.我们可以看到,Bagdassarov等(2007)获得的结果明显要低于场资料给出的Slave克拉通中部Lac de Gras地区的电导率,其结果仅能解释Slave克拉通地区~200 km深处的平均电导率.我们的1号样品拟合得到的含Na2CO3熔体的地幔岩的电导率剖面则与Lac de Gras地区大地电磁数据反演得到的电导率剖面非常相似,且电导率值也非常的接近.结合H-S模型计算结果和我们的实验结果,我们认为熔体比例小于~2%的Na2CO3熔体可以解释Lac de Gras地区约80~120 km深处约0.1 S·m-1的异常高导现象.

|
图 8 将Na2CO3熔体和橄榄岩包体在1023 K温度下的电导率(10 S·m-1和10-4.5S·m-1)分别代入H-S模型、管状模型(tube)和立方体模型(cube),计算不同熔体分布模型下含不同熔体比例样品的电导率.灰色实线和黑色实线分别代表代入计算的熔体相样品电导率和固体相样品电导率,虚线分别代表H-S模型的上下边界、管状模型计算边界和立方体模型计算结果.三角形标记、菱形标记和正方形标记分别表示1号、2号和3号样品实验结果. Fig. 8 Curves of several mixing models predicted by inserting the measured melt conductivity into the melt distribution models. Dashed lines shows the results of H-S boundary, tube model, and cube model. Input data for the melt distribution models and conductivity of the carbonatite melt (101 S·m-1, purple solid line) and peridotite xenoliths (10-4.5 S·m-1, black solid line) are also presented. The triangle, diamond and square indicate the experimental data of sample No.1, 2, 3, respectively. |

|
图 9 Slave克拉通地区一维电导率剖面 实线为本次研究含2%Na2CO3部分熔融地幔岩的计算模拟结果.虚线分别为为Bagdassarov等(2007)模拟计算给出的电导率剖面、Slave克拉通地区平均电导率剖面模型及其中部Lac de Gras地区的电导率剖面模型. Fig. 9 Modeled electrical conductivity profile under Slave Craton derived from laboratory experiments on Na2CO3-bearing pyrolite (solid line) Dashed lines indicates Bagdassarov′s experimental data (Bagdassarov et al., 2007), modified averaged Slave MT response and MT response of Lac de Gras area. |
我们本次研究利用DS 3600 t六面顶压机和Solartron 1260阻抗/增益-相位分析仪在1.0~3.0 GPa、673~1873 K条件下分别测量了含Na2CO3、CaCO3及MORB的地幔岩样品的电导率随温度变化的情况,综合分析,得到以下结论:
(1) 在1.0~3.0 GPa,含Na2CO3的地幔岩在1023 K开始熔融,其样品的电导率不再遵循低温段时的变化规律;在1.0 GPa和3.0 GPa压力下,含大洋中脊玄武岩(MORB)的地幔岩分别在1373 K和1473 K开始熔融,随温度的增加,部分熔融样品的电导率也开始大幅增加;在3.0 GPa,含CaCO3的地幔岩在1723 K开始熔融,随温度的小幅增加,部分熔融样品的电导率快速增加.部分熔融的地幔岩的电导率变化主要受控于温度和组分,压力对其影响较小.
(2) 碳酸盐熔体和硅酸盐熔体都可以极大地增强地幔岩的电导率,但是,当样品内碳酸质(如Na2CO3、白云石等)先于硅酸盐(如MORB等)发生熔融时,碳酸质熔体吸收同化样品中的斜方辉石,使得熔体成分由最初的碳酸盐质变为碳酸盐化的硅酸盐质,在此过程中,样品内的电导率几乎不变.把这一实验结果应用到前人提出的金伯利岩岩浆的形成机理(Russell et al., 2012, 2013)中,我们或许可以说:在金伯利岩岩浆的形成过程中其内部的电导率几乎不发生变化.
(3) 通过场资料和实验数据的对比,我们认为Slave克拉通中部Lac de Gras地区约80~120 km深处约0.1 S·m-1的异常高导可以用熔体比例小于~2%的含Na2CO3熔体的地幔岩来解释.
致谢 本实验完成于中国科学院地球化学研究所地球内部物质高温高压院重点实验室,期间得到朱成明研究员、周文戈研究员、单双明副研究员的指导和帮助,在此深表谢意.
Bagdassarov N S, Slutskii A B. 2003. Phase transformations in calcite from electrical impedance measurements. Phase Transitions, 76(12): 1015-1028. DOI:10.1080/0141159031000098233 |
Bagdassarov N S, Kopylova M G, Eichert S. 2007. Laboratory derived constraints on electrical conductivity beneath Slave craton. Physics of the Earth and Planetary Interiors, 161(1-2): 126-133. DOI:10.1016/j.pepi.2007.01.001 |
Brey G P, Köhler T. 1990. Geothermobarometry in four-phase lherzolites Ⅱ. New thermobarometers, and practical assessment of existing thermobarometers. Journal of Petrology, 31(6): 1353-1378. DOI:10.1093/petrology/31.6.1353 |
Canil D, Scarfe C M. 1990. Phase relations in peridotite+CO2 systems to 12 GPa:Implications for the origin of kimberlite and carbonate stability in the Earth's upper mantle. Journal of Geophysical Research Solid Earth, 95(B10): 15805-15816. DOI:10.1029/JB095iB10p15805 |
Ch an, Nyland E, Gough D I. 1973. Partial melting and conductivity anomalies in the upper mantle. Nature Physical Science, 244: 89-91. DOI:10.1038/physci244089a0 |
Dai L D, Li H P, Liu C Q, et al. 2005. Experimental study on impedance spectra of iherzolite under high temperature and high pressure. Chinese Journal of High Pressure Physics (in Chinese), 19(1): 29-34. |
Dai L D, Karato S I. 2009a. Electrical conductivity of orthopyroxene:Implications for the water content of the asthenosphere. Proceedings of the Japan Academy, Series B, 85(10): 466-475. DOI:10.2183/pjab.85.466 |
Dai L D, Karato S I. 2009b. Electrical conductivity of pyrope-rich garnet at high temperature and pressure. Physics of the Earth and Planetary Interiors, 176(1-2): 83-88. DOI:10.1016/j.pepi.2009.04.002 |
Dai L D, Karato S I. 2014. The effect of pressure on the electrical conductivity of olivine under the hydrogen-rich conditions. Physics of the Earth and Planetary Interiors, 232: 51-56. DOI:10.1016/j.pepi.2014.03.010 |
Dai L D, Hu H Y, Li H P, et al. 2016. Influence of temperature, pressure, and oxygen fugacity on the electrical conductivity of dry eclogite, and geophysical implications. Geochemistry, Geophysics, Geosystems, 17(6): 2349-2407. |
Dasgupta R, Hirschmann M M, Dellas N. 2005. The effect of bulk composition on the solidus of carbonated eclogite from partial melting experiments at 3 GPa. Contributions to Mineralogy and Petrology, 149(3): 288-305. DOI:10.1007/s00410-004-0649-0 |
Dingwell D B, Webb S L. 1990. Relaxation in silicate melts. European Journal of Mineralogy, 2(2): 427-449. |
Evans R L, Jones A G, Garcia X, et al. 2011. Electrical lithosphere beneath the Kaapvaal craton, southern Africa. Journal of Geophysical Research:Solid Earth, 116(B4): B04105. DOI:10.1029/2010JB007883 |
Freybourger M, Gaherty J B, Jordan T H, et al. 2001. Structure of the Kaapvaal Craton from surface waves. Geophysical Research Letters, 28(13): 2489-2492. DOI:10.1029/2000GL012436 |
Gaillard F, Malki M, Iacono-Marziano G, et al. 2008. Carbonatite melts and electrical conductivity in the asthenosphere. Science, 322(5906): 1363-1365. DOI:10.1126/science.1164446 |
Girnis A V, Brey G P, Ryabchikov I D. 1995. Origin of Group 1A kimberlites:Fluid-saturated melting experiments at 45~55 kbar. Earth and Planetary Science Letters, 134(3-4): 283-296. DOI:10.1016/0012-821X(95)00120-2 |
Hansen S E, Nyblade A A, Julià J, et al. 2009. Upper-mantle low-velocity zone structure beneath the Kaapvaal craton from S-wave receiver functions. Geophysical Journal International, 178(2): 1021-1027. DOI:10.1111/gji.2009.178.issue-2 |
Hashin Z, Shtrikman S. 1962. A variational approach to the theory of the effective magnetic permeability of multiphase materials. Journal of Applied Physics, 33(10): 3125-3131. DOI:10.1063/1.1728579 |
Herzberg C, Raterron P, Zhang J. 2000. New experimental observations on the anhydrous solidus for peridotite KLB-1. Geochemistry, Geophysics, Geosystems, 1: 1051. DOI:10.1029/2000GC000089 |
Hirschmann M M. 2010. Partial melt in the oceanic low velocity zone. Physics of the Earth and Planetary Interiors, 179(1-2): 60-71. DOI:10.1016/j.pepi.2009.12.003 |
Huang X G, Xu Y S, Karato S I. 2005. Water content in the transition zone from electrical conductivity of wadsleyite and ringwoodite. Nature, 434(7034): 746-749. DOI:10.1038/nature03426 |
Huang X G, Huang X G, Bai W M. 2012. Study on the electrical conductivity of carbonated peridotite. Chinese Journal of Geophysics (in Chinese), 55(9): 3144-3151. DOI:10.6038/j.issn.0001-5733.2012.09.032 |
Huang X G, Wang X X, Chen Z A, et al. 2017. The experimental research on electrical conductivity for minerals and rocks under condition of upper mantle. Scientia Sinica (Terrae) (in Chinese), 47(5): 518-529. DOI:10.1360/N072016-00305 |
Huebner J S, Dillenburg R G. 1995. Impedance spectra of hot, dry silicate minerals and rock:Qualitative interpretation of spectra. American Mineralogist, 80(1-2): 46-64. DOI:10.2138/am-1995-1-206 |
Irving A J, Wyllie P J. 1975. Subsolidus and melting relationships for calcite, magnesite and the join CaCO3-MgCO3 36 kb. Geochimica et Cosmochimica Acta, 39(1): 35-53. DOI:10.1016/0016-7037(75)90183-0 |
James D E, Boyd F R, Schutt D, et al. 2004. Xenolith constraints on seismic velocities in the upper mantle beneath southern Africa. Geochemistry, Geophysics, Geosystems, 5(1): Q01002. DOI:10.1029/2003GC000551 |
Jones A G, Ferguson I J, Chave A D, et al. 2001. Electric lithosphere of the Slave craton. Geology, 29(5): 423-426. DOI:10.1130/0091-7613(2001)029<0423:ELOTSC>2.0.CO;2 |
Jones A G, Lezaeta P, Ferguson I J, et al. 2003. The electrical structure of the Slave craton. Lithos, 71(2-4): 505-527. DOI:10.1016/j.lithos.2003.08.001 |
Karato S. 1990. The role of hydrogen in the electrical conductivity of the upper mantle. Nature, 347(6290): 272-273. DOI:10.1038/347272a0 |
Katsura T, Yoshino T, Manthilake G, et al. 2009. Electrical conductivity of the major upper mantle minerals:A review. Russian Geology and Geophysics, 50(12): 1139-1145. DOI:10.1016/j.rgg.2009.11.012 |
Krishna V G, Kaila K L, Reddy P R. 1991. Low velocity layers in the subcrustal lithosphere beneath the Deccan Traps region of western India. Physics of the Earth and Planetary Interiors, 67(3-4): 288-302. DOI:10.1016/0031-9201(91)90025-D |
Maumus J, Bagdassarov N, Schmeling H. 2005. Electrical conductivity and partial melting of mafic rocks under pressure. Geochimica et Cosmochimica Acta, 69(19): 4703-4718. DOI:10.1016/j.gca.2005.05.010 |
Menzies A, Westerlund K, Grütter H, et al. 2004. Peridotitic mantle xenoliths from kimberlites on the Ekati Diamond Mine property, N. W. T., Canada:Major element compositions and implications for the lithosphere beneath the central Slave craton. Lithos, 77(1-4): 395-412. DOI:10.1016/j.lithos.2004.04.013 |
Ni H W, Keppler H, Behrens H. 2011a. Electrical conductivity of hydrous basaltic melts:Implications for partial melting in the upper mantle. Contributions to Mineralogy and Petrology, 162(3): 637-650. |
Ni H W, Keppler H, Manthilake M A G M, et al. 2011b. Electrical conductivity of dry and hydrous NaAlSi3O8 glasses and liquids at high pressures. Contributions to Mineralogy and Petrology, 162(3): 501-513. DOI:10.1007/s00410-011-0608-5 |
Nixon P H. 1987. Mantle xenoliths. New York: John Wiley & Sons.
|
Patro P K, Sarma S V S. 2009. Lithospheric electrical imaging of the Deccan trap covered region of western India. Journal of Geophysical Research:Solid Earth, 114(B1): B01102. DOI:10.1029/2007JB005572 |
Peng W. 2012. Electrical conductivity of carbonatite melt-bearing lherzolite in the upper mantle[Master's thesis](in Chinese). Beijing: Graduate University of Chinese Academy of Sciences.
|
Pertermann M, Hirschmann M M. 2003a. Anhydrous partial melting experiments on MORB-like eclogite:Phase relations, phase compositions and mineral-melt partitioning of major elements at 2-3 GPa. Journal of Petrology, 44(12): 2173-2201. DOI:10.1093/petrology/egg074 |
Pertermann M, Hirschmann M M. 2003b. Partial melting experiments on a MORB-like pyroxenite between 2 and 3 GPa:Constraints on the presence of pyroxenite in basalt source regions from solidus location and melting rate. Journal of Geophysical Research:Solid Earth, 108(B2): 183-185. |
Pickering-Witter J, Johnston A D. 2000. The effects of variable bulk composition on the melting systematics of fertile peridotitic assemblages. Contributions to Mineralogy and Petrology, 140(2): 190-211. DOI:10.1007/s004100000183 |
Presnall D C, Simmons C L, Porath H. 1972. Changes in electrical conductivity of a synthetic basalt during melting. Journal of Geophysical Research, 77(29): 5665-5672. DOI:10.1029/JB077i029p05665 |
Ringwood A E. 1975. Composition and Petrology of the Earth's Mantle. New York: McGraw-Hill.
|
Ringwood A E, Kesson S E, Hibberson W, et al. 1992. Origin of kimberlites and related magmas. Earth and Planetary Science Letters, 113(4): 521-538. DOI:10.1016/0012-821X(92)90129-J |
Russell J K, Porritt L A, Lavallée Y, et al. 2012. Kimberlite ascent by assimilation-fuelled buoyancy. Nature, 481(7381): 352-356. DOI:10.1038/nature10740 |
Russell J K, Porritt L A, Hilchie L. 2013. Kimberlite: Rapid Ascent of lithospherically modified carbonatitic melts.//Proceedings of 10th International Kimberlite Conference. New Delhi: Springer, 195-210.
|
Schmeling H. 1986. Numerical models on the influence of partial melt on elastic, anelastic and electrical properties of rocks. Part Ⅱ:Electrical conductivity. Physics of the Earth and Planetary Interiors, 43(2): 123-136. DOI:10.1016/0031-9201(86)90080-4 |
Shankland T J, Waff H S. 1977. Partial melting and electrical conductivity anomalies in the upper mantle. Journal of Geophysical Research, 82(33): 5409-5417. DOI:10.1029/JB082i033p05409 |
Sifré D, Gardés E, Massuyeau M, et al. 2014. Electrical conductivity during incipient melting in the oceanic low-velocity zone. Nature, 509(7498): 81-85. DOI:10.1038/nature13245 |
Sifré D, Hashim L, Gaillard F. 2015. Effects of temperature, pressure and chemical compositions on the electrical conductivity of carbonated melts and its relationship with viscosity. Chemical Geology, 418(4): 189-197. |
The MELT Seismic Team. 1998. Imaging the deep seismic structure beneath a mid-ocean ridge:The MELT experiment. Science, 280(5367): 1215-1218. DOI:10.1126/science.280.5367.1215 |
Tyburczy J A, Waff H S. 1983. Electrical conductivity of molten basalt and andesite to 25 kilobars pressure:Geophysical significance and implications for charge transport and melt structure. Journal of Geophysical Research:Solid Earth, 88(B3): 2413-2430. DOI:10.1029/JB088iB03p02413 |
Ulmer P, Sweeney R J. 2002. Generation and differentiation of group Ⅱ kimberlites:Constraints from a high-pressure experimental study to 10 GPa. Geochimica et Cosmochimica Acta, 66(12): 2139-2153. DOI:10.1016/S0016-7037(02)00898-0 |
Waff H S. 1974. Theoretical considerations of electrical conductivity in a partially molten mantle and implications for geothermometry. Journal of Geophysical Research, 79(26): 4003-4010. DOI:10.1029/JB079i026p04003 |
Wang D J, Yi L, Xie H S, et al. 2005. Impedance spectroscopy and its application to material science of the earth's interior. Earth Science Frontiers (in Chinese), 12(1): 123-129. |
Wang D J, Mookherjee M, Xu Y S, et al. 2006. The effect of water on the electrical conductivity of olivine. Nature, 443(7114): 977-980. DOI:10.1038/nature05256 |
Wang D J, Karato S I, Jiang Z T. 2013. An experimental study of the influence of graphite on the electrical conductivity of olivine aggregates. Geophysical Research Letters, 40(10): 2028-2032. DOI:10.1002/grl.50471 |
Wang X X, Huang X G, Bai W M. 2016. Experimental study on electrical conductivity of pyrolite and piclogite at high temperature and high pressure. Chinese Journal of Geophysics (in Chinese), 59(2): 624-632. DOI:10.6038/cjg20160219 |
Xu Y S, Shankland T J, Duba A G. 2000. Pressure effect on electrical conductivity of mantle olivine. Physics of the Earth and Planetary Interiors, 118(1-2): 149-161. DOI:10.1016/S0031-9201(99)00135-1 |
Yang X Z, Keppler H, McCammon C, et al. 2011. Effect of water on the electrical conductivity of lower crustal clinopyroxene. Journal of Geophysical Research:Solid Earth, 116(B4): B04208. DOI:10.1029/2010JB008010 |
Yang X Z, Heidelbach F. 2012. Grain size effect on the electrical conductivity of clinopyroxene. Contributions to Mineralogy and Petrology, 163(6): 939-947. DOI:10.1007/s00410-011-0707-3 |
Yasuda A, Fujii T, Kurita K. 1994. Melting phase relations of an anhydrous mid-ocean ridge basalt from 3 to 20 GPa:Implications for the behavior of subducted oceanic crust in the mantle. Journal of Geophysical Research:Solid Earth, 99(B5): 9401-9414. DOI:10.1029/93JB03205 |
Yaxley G M. 2000. Experimental study of the phase and melting relations of homogeneous basalt+peridotite mixtures and implications for the petrogenesis of flood basalts. Contributions to Mineralogy and Petrology, 139(3): 326-338. DOI:10.1007/s004100000134 |
Yoshino T, Matsuzaki T, Yamashita S, et al. 2006. Hydrous olivine unable to account for conductivity anomaly at the top of the asthenosphere. Nature, 443(7114): 973-976. DOI:10.1038/nature05223 |
Yoshino T, Nishi M, Matsuzaki T, et al. 2008. Electrical conductivity of majorite garnet and its implications for electrical structure in the mantle transition zone. Physics of the Earth and Planetary Interiors, 170(3-4): 193-200. DOI:10.1016/j.pepi.2008.04.009 |
Yoshino T, Yamazaki D, Mibe K. 2009. Well-wetted olivine grain boundaries in partially molten peridotite in the asthenosphere. Earth and Planetary Science Letters, 283(1-4): 167-173. DOI:10.1016/j.epsl.2009.04.007 |
Yoshino T, Laumonier M, Mcisaac E, et al. 2010. Electrical conductivity of basaltic and carbonatite melt-bearing peridotites at high pressures:Implications for melt distribution and melt fraction in the upper mantle. Earth and Planetary Science Letters, 295(3-4): 593-602. DOI:10.1016/j.epsl.2010.04.050 |
Yoshino T. 2010. Laboratory electrical conductivity measurement of mantle minerals. Surveys in Geophysics, 31(2): 163-206. DOI:10.1007/s10712-009-9084-0 |
Yoshino T, Mcisaac E, Laumonier M, et al. 2012. Electrical conductivity of partial molten carbonate peridotite. Physics of the Earth and Planetary Interiors, 194-195: 1-9. DOI:10.1016/j.pepi.2012.01.005 |
Zhang B H, Yoshino T. 2017. Effect of graphite on the electrical conductivity of the lithospheric mantle. Geochemistry, Geophysics, Geosystems, 18(1): 23-40. DOI:10.1002/2016GC006530 |
代立东, 李和平, 刘丛强, 等. 2005. 高温高压下二辉橄榄岩的阻抗谱实验研究. 高压物理学报, 19(1): 29-34. DOI:10.3969/j.issn.1000-5773.2005.01.006 |
黄小刚, 黄晓葛, 白武明. 2012. 碳酸盐化橄榄岩的电性研究. 地球物理学报, 55(9): 3144-3151. DOI:10.6038/j.issn.0001-5733.2012.09.032 |
黄晓葛, 王欣欣, 陈祖安, 等. 2017. 上地幔矿物和岩石电导率的实验研究. 中国科学:地球科学, 47(5): 518-529. DOI:10.1360/N072016-00305 |
彭伟. 2012.含碳酸盐熔体的二辉橄榄岩电性研究[硕士论文].北京: 中国科学院研究生院.
|
王多君, 易丽, 谢鸿森, 等. 2005. 交流阻抗谱法及其在地球深部物质科学中的应用. 地学前缘, 12(1): 123-129. DOI:10.3321/j.issn:1005-2321.2005.01.016 |
王欣欣, 黄晓葛, 白武明. 2016. 高温高压下地幔岩和苦橄质榴辉岩的电导率实验. 地球物理学报, 59(2): 624-632. |
 2019, Vol. 62


