2. 吉林省地震局, 长春 130117
2. Jilin Earthquake Agency, China Earthquake Administration, Changchun 130117, China
据中国地震台网测定,2017年9月23日16时29分16秒,在朝鲜咸镜北道花台山(北纬41.36°,东经129.06°)发生ML3.4地震,震源深度0 km.震中位置在朝鲜咸镜北道核试验场附近,因为此次地震事件的发震机制尚不明确,所以很难给出是朝鲜进行的地下核试验,还是坑道塌陷、山体滑坡或者是构造地震事件等的准确判定.
震源机制可以利用地震矩张量较为准确地描述(Chapman and Leaney, 2012).地震矩张量可以分解为表示断层面剪切错动的双力偶分量(DC)、震源体膨胀或收缩的各向同性分量(ISO)、震源体优势方向的张裂或挤压变形(CLVD)等(Vavryčuk,2001;许忠淮和李世愚,2013).通常,构造地震是由断层两盘的剪切位错触发,其矩张量分解后的双力偶DC分量占主要部分,而诱发地震、塌陷地震和人工地震大多为塌陷或膨胀型震源机制,其显著的特征是矩张量解中表示震源体的体积变化的分量(ISO+CLVD)占很大比重.这类地震另一个典型的特征是均具有较浅的震源深度.因此可以根据地震矩张量分解后各个分量的比重大小以及震源深度来研究一次地震的发震机制(Benetatos et al., 2013;Cesca et al., 2014).
近年来,地震矩张量反演已经广泛应用于震源机制的研究,例如,研究构造地震的震源机制(赵翠萍等,2008;郑勇等,2009;易桂喜等,2015)、调查火山或地热区域地震的震源机制(Julian and Sipkin, 1985;Foulger,1988;Foulger et al., 2004;Minson et al., 2007;张广伟和雷建设,2015)和研究地下核试验或采矿区的地震等(Ford et al., 2009;Cesca et al., 2017;刘俊清等,2017).
地震矩张量的研究主要包含矩张量反演、矩张量分解、参数稳定性评估及其解的图形化(Chapman and Leaney, 2012).本研究采用矩张量反演方法ISOLA(Sokos et al., 2016;Zahradník et al., 2017)对2017年9月23日朝鲜ML3.4地震进行矩张量反演研究判定地震的发生机制,并且使用Jackknifing(刀切法)方法对参数的稳定性进行评估,最后将矩张量解投影到Hudson源类型图上(Hudson et al., 1989).
1 数据资料据朝鲜中央通讯社报道,朝鲜于2017年9月3日12时00分进行了地下核试验,是一次成功的氢弹(H-bomb)核聚变爆炸试验(http://www.kcna.co.jp/index-e.htm).根据美国地质调查局(USGS)的报道,此次核试验的震级为mb6.3,约8.5 min后在同一位置发生了一次余震事件,震级为ML4.6.根据地震矩张量反演研究,前者为膨胀型地震事件而后者为收缩型地震事件(Liu et al., 2018),震中均位于朝鲜核试验场(Wen and Long, 2010;Zhang and Wen, 2013;Zhao et al., 2014, 2016, 2017a).此前,朝鲜分别于2006年、2009年、2013年和2016年的1月和9月进行了5次地下核试验. 2017年9月3日朝鲜核试验为第6次核试验,震级较大,爆炸当量远大于前5次(赵连锋等,2017b).
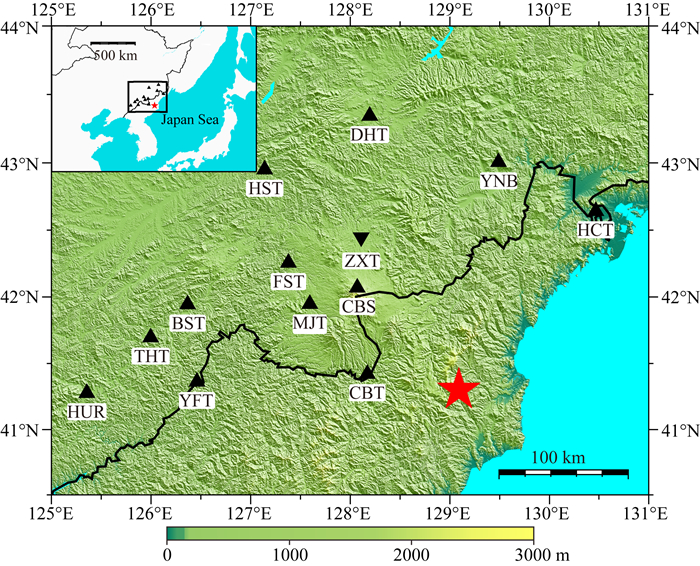
2017年9月23日在朝鲜核试验场附近再次发生ML3.4地震(图 1),地震监测机构,包括中国地震台网中心(CENC)、美国地质调查局(USGS)和欧洲地中海地震中心(EMSC)很快给出事件的定位结果(表 1).地震发生后约4 h,中国科学院地质与地球物理研究所报道指出此次疑似爆炸的地震事件具有天然地震的谱比值特征,给出了不是朝鲜进行地下核试验的初步判断(http://www.igg.cas.cn/xwzx/kyjz/201709/t20170923_4863959.html).
|
图 1 ML3.4地震震中与地震台站 红色五角星位置为震中,黑色三角为宽频带地震台站,黑色倒三角为短周期地震台站. Fig. 1 The epicenter of ML3.4 earthquake and location of the seismic stations The red star, the black triangle and inverted triangle represent location of event, broadband station and short period station, respectively. |
|
|
表 1 2017年9月23日朝鲜ML3.4地震定位 Table 1 Location of the DPRK ML3.4 earthquake on September 23, 2017 |
在中国境内,震中距300 km范围内分布有中国地震台网的地震台站,主要包括国家地震台网和区域地震台网的台站,观测到此次地震高质量的波形记录.我们选取12个宽频带地震台站(图 1)的波形记录进行矩张量反演研究,其中YNB和THT为国家地震台,分别配置JCZ-1型和CTS-1型地震计,其他为区域地震台,配置BBVS-60型和CMG-3ESPC型地震计.为了考察不同的地壳速度结构对地震矩张量反演结果的影响,我们分别使用了3个模型进行反演(表 2):全球速度模型ak135(Kennett et al., 1995)、修正的CRUST 2.0模型和“Ford 2009”模型.其中,修正的CRUST 2.0模型主要是以CRUST 2.0导出模型为基础,参考近年来松辽盆地及东北地区地球物理探测的研究成果(杨宝俊等,1996;卢造勋等,2002)等,对莫霍面深度和中间层速度界面深度进行了细微调整后的模型. “Ford 2009”模型,是Ford等(2009)研究2009年朝鲜核试验震源机制用到的地壳速度模型,该模型来自面波导出模型MDJ(Nguyen et al., 1994).
|
|
表 2 地壳速度模型 Table 2 Crust velocity models used in this study |
地震矩张量是对多种震源类型的统一描述,用一个二阶张量表示,其结果有多种分解方法,如将矩张量结果分解为DC(Double couple)、CLVD(Compensated linear vector dipole)和ISO(Volumetric)三个部分.通常将只包含DC与CLVD两个分量的解称为偏矩张量解,包含DC、CLVD和ISO三个分量的解称为全矩张量解.我们采用ISOLA方法对ML3.4地震进行全矩张量反演,考察结果中DC、CLVD和ISO三个分量的大小,从而判定地震的震源机制.
ISOLA方法是将时间域迭代反卷积多点源矩张量反演方法(Kikuchi and Kanamori, 1991)发展到全波形矩张量反演中,并采用网格搜索及最小二乘法获得地震的最佳矩张量解,该方法具有纯DC、偏矩张量(DC+CLVD)及全矩张量(DC+CLVD+ISO)三种反演模式.另外,该方法既可将震源看作单点源也可将震源区视作多点源来处理,且能在4个维度中(经度、纬度、深度、时间)搜索矩心位置.
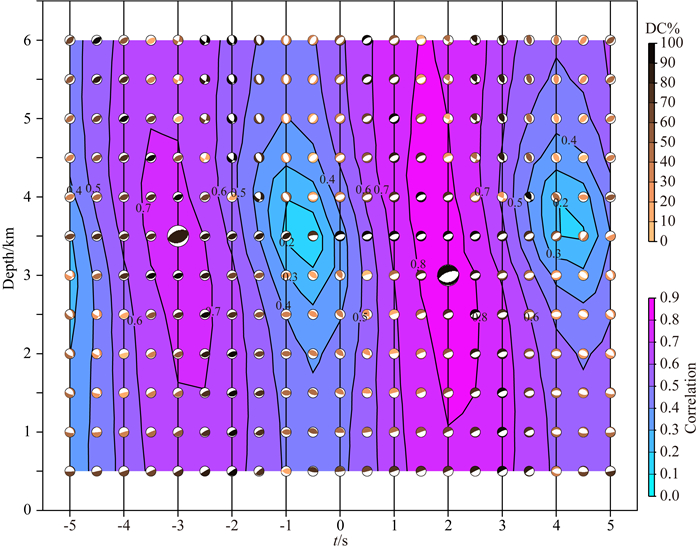
2.2 矩张量反演我们使用频率波数法(Bouchon,1981)分别计算三个地壳速度模型(表 2)的全波场格林函数,按台站震中距合成理论地震图.在进行全矩张量反演时,将震中固定,矩心深度限制在0~6 km范围内,步长0.5 km,计算格林函数,其矩心时间在发震时刻前后5 s范围以0.5 s作为搜索步长,滤波频段为0.08~0.12 Hz,矩张量反演结果见表 3.参数VR(Variance Reduction)称为约化方差,用来表示观测波形和合成波形的拟合程度,用(1)式计算:

|
(1) |
|
|
表 3 矩张量反演结果 Table 3 The results of moment tensor inversion |
式中,o、s分别表示观测波形和合成波形.三个模型的反演结果显示,约化方差VR均大于70%,表明观测波形与合成的理论波形有很好的相似度.矩震级分别为MW3.4和MW3.5,矩心深度分别为2.5 km和3.0 km,DC分量均大于90%.由断层剪切错动引起的地震,其DC分量通常大于80%,可见朝鲜ML3.4地震属于典型的由断层剪切错动引起的地震. K-angle表示空间任意两个震源球之间最小的夹角,用来判断两个震源机制的相似程度,在20°范围内认为是相同的震源机制(Kagan,1991).选取修正的CRUST 2.0模型反演的矩张量结果作为参照,获得其他两个模型反演结果相对它的K-angle值(表 3),分别为3.6°和5.8°,K-angle值均小于20°,表示三个矩张量反演结果为相同的震源机制,可见不同的速度模型对矩张量反演没有影响.条件数CN(Condition Number)来自格林函数矩阵,是最大特征值和最小特征值的比值,地震矩张量反演中用来综合考察台站几何分布、速度模型、滤波频段、波形信噪比等是否合理的一个指标,值越小,表示矩张量解的可靠性越高,计算公式如下:

|
(2) |

|
(3) |
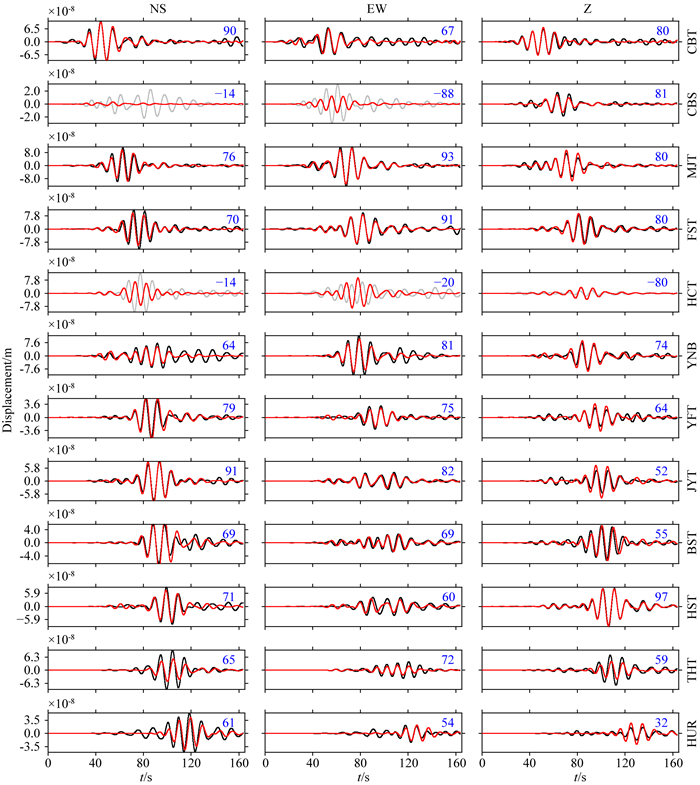
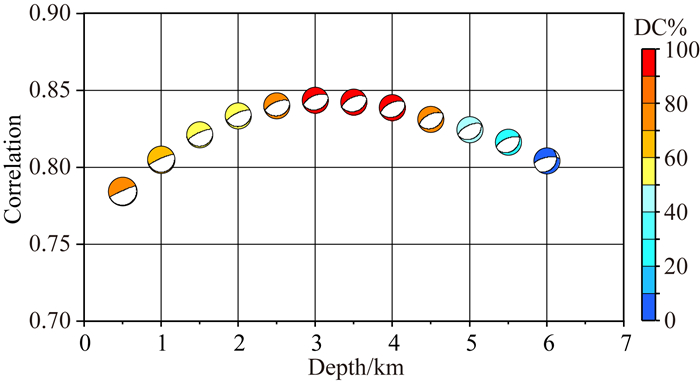
在(2)、(3)式中,d表示观测波形,G为格林函数,m表示模型参数. maxeigenval和mineivenval分别表示矩阵G的最大和最小特征值.由于采用修正的CRUST 2.0速度模型获得的反演结果取得了最小的CN值,为4.4,故我们选择该结果为最终解. 图 2是随着矩心时间、矩心深度的变化,观测波形与合成波形的相关系数变化情况.图中显示,相对于发震时刻,在矩心时间+2 s、地下3 km处与-3 s、地下3.5 km处,地震矩心在这两个位置时,观测波形与合成波形有较高的互相关系数,分别为0.84和0.79,相差极其微小,这两个位置的震源机制分别为正断层型与逆冲型,最优的震源机制解有可能是这两解中的一个.程序选择了互相关系数较高的+2 s、地下3 km处的震源机制作为最终结果(表 3),其主压应力P轴方位角为144°,倾角为74°,主张应力T轴方位角为341°,倾角为15°.这一结果具有一定的不可靠性,在3.1节我们采用P波极性在震源球上分布的合理性讨论矩张量反演结果的可靠性. 图 3表示最终解的合成理论地震图与观测波形的比较情况,12个台站中,HCT台三分量,CBS台南北向、东西向波形发生畸变,在反演过程中剔除,其他通道波形与合成波形能够较好的拟合,平均约化方差VR=76%. 图 4显示,随着矩心深度的变化,最终解的观测波形与合成波形的互相关系数的变化情况,在地下3 km处,互相关系数达到最高值0.84.
|
图 2 矩心时间、矩心深度及互相关系数变化的关系图 Fig. 2 Relationship between centroid time, centroid depth and cross correlation coefficient |
|
图 3 台站三分量波形和合成的理论地震图的比较(矩心:+2 s,3 km) 黑色曲线为观测波形,红色曲线为合成的理论地震图,灰色曲线表示不参与反演.每组波形右上角的数字表示约化方差VR值,右侧三字母表示台站名称. Fig. 3 Comparison of observation and synthetic theory waveforms on the three components of seismic station (Centroid:+2 second, 3 km) The black curve, red curve and gray curve represent observation waveform, synthetic theory waveform and waveform excluded in the inversion, respectively. The number on the upper right corner of each waveforms represent Variance Reduction (%). The three letters on the right represent seismic station name. |
|
图 4 波形拟合的相关系数随矩心深度的变化(矩心:+2 s,3 km) Fig. 4 The correlation coefficient between synthetic records and observations versus the centroid depth (Centroid:+2 second, 3 km) |
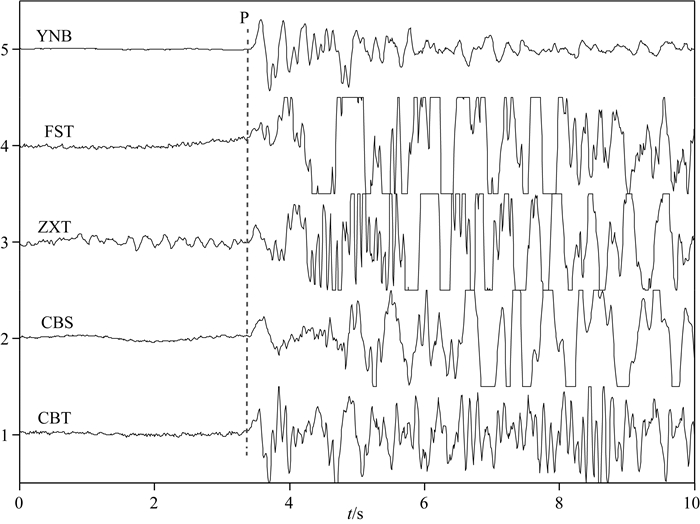
通常利用地震台站垂直分向的P波极性符号在震源球上的分布位置判断地震震源机制解的合理性.首先利用修正的CRUST 2.0速度模型、震中距和矩心深度计算地震台站的离源角,根据台站方位角和离源角将其投影到震源球上,位于压缩区域的P波初动向上,位于拉张区域的P波初动向下,根据这一原则将台网中可识别初动符号的台站投影到ML3.4地震的震源球上,考察极性与震源机制解的一致性.由于地震震级较小,台站震中距普遍较大,波形信噪比较低,我们最终在5个台站的垂直向记录中读取了可靠的P波极性符号,5个台站的平面位置参见图 1,方位角、初至震相和离源角等信息见表 4与图 5.将图 2中(+2 s,3 km)与(-3 s,3.5 km)处的矩张量反演结果用沙滩球表示(图 6),图 6a为本研究反演获得的最终结果,5个台站均位于压缩区,其P波初动方向向上(用“+”号表示),与反演结果一致. 图 6c中,P波初动向上的5个台站均位于震源球的拉张区域,与震源机制结果相矛盾,由此可见图 2中(-3 s,3.5 km)处的矩张量反演结果是不合理的.另外根据朝鲜半岛GNSS (Global Navigation Satellite System,全球导航卫星系统)观测资料反演的近地表应变率场结果(Jin and Park, 2007),该区域张应变率场方向呈北西向分布(图 6b),与图 6a震源机制的主张应力T轴方向(方位角341°)较一致.综合分析认为图 2中(+2 s,3 km)处的震源机制较为合理.
|
|
表 4 5个台站的初至震相信息 Table 4 The information of first phase at five seismic stations |
|
图 5 5个台站垂直分向的P波极性示意图 横轴表示时间,纵轴表示通道数,垂直虚线表示P波初至时刻. Fig. 5 Sketch map of P wave polarity in vertical channel of five stations The horizontal, vertical axis and dashed line represent the time, the number of channel and the first arrival time of P wave, respectively. |

|
图 6 台站P波极性在震源球上的分布 (a、c) 图 2中(+2 s,3 km)和(-3 s,3.5 km)处的震源机制解沙滩球与P波极性,“+”号表示P波初动向上;(b)震中附近区域的应变率场(Jin and Park, 2007). Fig. 6 The distribution of P wave polarities of seismic stations on the beachball (a, c) The beachball and P wave polarities of (+2 second, 3 km) and (-3 second, 3.5 km) on the Fig. 2, respectively. '+'indicates the P wave with upward polarity. (b) The strain rate field around epicenter region (Jin and Park, 2007). |
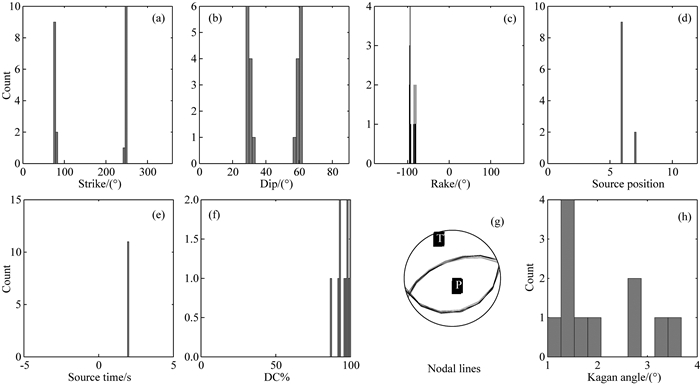
在矩张量反演的参数不确定度分析中,通常利用刀切法(Jackknifing)、自举法(Bootstrap)等,本研究使用Jackknifing方法(Sokos and Zahradník,2013;Boyd et al., 2015).我们选择参与反演的12个地震台站,按每次增减一个台站、增减一个通道,利用修正的CRUST 2.0地壳速度模型进行多次反演,用95%的置信度来确定参数的置信区间,结果显示各个参数的置信区间非常窄,表明本研究利用修正的CRUST 2.0地壳速度模型反演获得的地震矩张量结果各参数非常稳定. 图 7a、b、c是偏矩张量结果的节面参数(走向、倾向、滑动角)的直方图,图 7d、e是矩心位置和矩心时间的直方图,图 7f是DC分量的直方图,图 7g是所有的解的节线图,图 7h是所有的解与最优解的K-angle值直方图,图中显示K-angle在1°~4°很小的区间内变化.
|
图 7 ML3.4地震矩张量反演参数的不确定度评估 Fig. 7 The estimation of parameters uncertainty from seismic moment tensor inversion result of ML3.4 earthquake |
本研究使用Hudson震源类型图进一步确定震源矩张量类型.由于矩张量的分解方法不是唯一的(Julian et al., 1998),即MT=ISO+DEV,而DEV(偏矩张量)可以进一步分解,因此我们根据所研究的问题选择Vavryčuk(2001)提出的分解方法,即将DEV分解为DC和CLVD,相当于人为的加入了先验约束.为更客观地研究震源机制类型,将矩张量解投影到Hudson震源类型图上. Hudson震源类型图是由T和k两参数表示的二维矩张量投影图,具体计算公式如下:

|
(4) |

|
(5) |
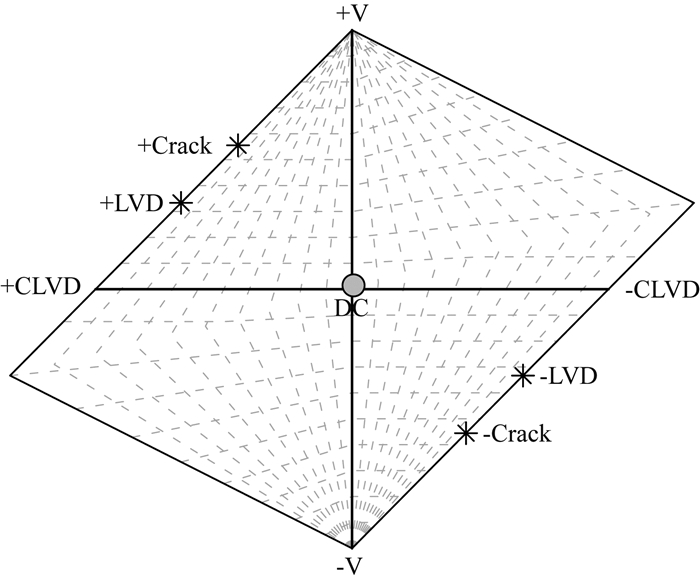
在(4)(5)式中,Miso是矩张量的ISO分量,M′x、M′y和M′z是偏矩张量的3个理论特征值. T表示震源的偏矩张量部分,取值范围为[-1,+1],即纯负CLVD到纯正CLVD. k表示震源的ISO部分,在图上用-V和+V表示,取值范围为[-1,+1],即震源的收缩与膨胀. T与k的交点坐标为(0,0),表示纯DC解. LVD(Linear vector dipole)表示震源区只有一个方向的拉伸与压缩,是CLVD的一种特殊情况,Crack(Tensile crack)是ISO一种特殊情况,表示震源的不对称膨胀与收缩,在某一方向变化量较大.我们将ML3.4地震矩张量反演结果投影到Hudson震源类型图上(图 8),图中显示灰色圆斑靠近中心DC位置,表明震源的力学特征为断层剪切位错.
|
图 8 ML3.4地震矩张量的Hudson震源类型图 灰色圆斑表示矩张量的投影位置. Fig. 8 Hudson source type diagram of seismic moment tensor of ML3.4 earthquake The gray circle represents the projection position of the moment tensor. |
通过对2017年9月23日朝鲜ML3.4地震进行全矩张量反演,在震源球上用5个台站的垂直分量的P波极性进行了解的可靠性检验,利用Jackknifing方法分析了矩张量反演结果参数的稳定性,并且将矩张量反演结果投影到Hudson震源类型图上,结果显示2017年9月23日朝鲜ML3.4事件为一次典型的地震事件,具有正断层类型的震源机制解,是由断层剪切错动引起.朝鲜ML3.4地震发生在核试验场附近,而且震源较浅,中国地震台网定位结果中震源深度为0 km,本文矩张量反演结果显示矩心深度为3 km.因为地壳速度模型的不精确性,地震学获得的震源深度的分辨率较低,可以粗略地认为地震发生在离地表较近的位置,我们推断朝鲜ML3.4地震事件很可能是核试验场附近山体滑动所致. 2017年9月3日朝鲜地下核试验震级是mb6.3.核试验释放的巨大能量对附近区域的应力场进行了扰动,致使试验场附近地壳岩石处于破裂的临界状态,很可能发生山体岩石破裂滑动事件.
致谢 捷克布拉格查理大学的Jiri教授提供了ISOLA矩张量反演程序,并且非常热情地指导了矩张量反演程序的使用和结果分析;吉林省地震局台网中心提供了该次地震的波形资料;两位匿名审稿专家针对研究方法及文章写作提出了非常宝贵的修改意见和建议,在此一并致谢!
Benetatos C, Málek J, Verga F. 2013. Moment tensor inversion for two micro-earthquakes occurring inside the Háje gas storage facilities, Czech Republic. Journal of Seismology, 17(2): 557-577. DOI:10.1007/s10950-012-9337-0 |
Bouchon M. 1981. A simple method to calculate Green's functions for elastic layered Media. Bulletin of the Seismological Society of America, 71(4): 959-971. |
Boyd O S, Dreger D S, Lai V H, et al. 2015. A systematic analysis of seismic moment tensor at the geysers geothermal field, California. Bulletin of the Seismological Society of America, 105(6): 2969-2986. DOI:10.1785/0120140285 |
Cesca S, Şen A T, Dahm T. 2014. Seismicity monitoring by cluster analysis of moment tensors. Geophysical Journal International, 196(3): 1813-1826. DOI:10.1093/gji/ggt492 |
Cesca S, Heimann S, Kriegerowski M, et al. 2017. Moment tensor inversion for nuclear explosions:what Can We learn from the 6 January and 9 September 2016 nuclear tests, North Korea?. Seismological Research Letters, 88(2A): 300-310. DOI:10.1785/0220160139 |
Chapman C H, Leaney W S. 2012. A new moment-tensor decomposition for seismic events in anisotropic media. Geophysical Journal International, 188(1): 343-370. DOI:10.1111/gji.2012.188.issue-1 |
Ford S R, Dreger D S, Walter W R. 2009. Source analysis of the Memorial Day explosion, Kimchaek, North Korea. Geophysical Research Letters, 36(21): L21304. DOI:10.1029/2009GL040003 |
Foulger G R. 1988. Hengill triple junction, SW Iceland 2. Anomalous earthquake focal mechanisms and implications for process within the geothermal reservoir and at accretionary plate boundaries. Journal of Geophysical Research:Solid Earth, 93(B11): 13507-13523. DOI:10.1029/JB093iB11p13507 |
Foulger G R, Julian B R, Hill D P, et al. 2004. Non-double-couple microearthquakes at Long Valley caldera, California, provide evidence for hydraulic fracturing. Journal of Volcanology and Geothermal Research, 132(1): 45-71. DOI:10.1016/S0377-0273(03)00420-7 |
Hudson J A, Pearce R G, Rogers R M. 1989. Source type plot for inversion of the moment tensor. Journal of Geophysical Research:Solid Earth, 94(B1): 765-774. DOI:10.1029/JB094iB01p00765 |
Jin S, Park P H. 2007. Tectonic activities and deformation in South Korea constrained by GPS observations. International Journal of Geology, 2(1): 11-15. |
Julian B R, Sipkin S A. 1985. Earthquake processes in the long valley Caldera Area, California. Journal Geophysical Research:Solid Earth, 90(B13): 11155-11169. DOI:10.1029/JB090iB13p11155 |
Julian B R, Miller A D, Foulger G R. 1998. Non-double-couple earthquakes 1. Theory. Reviews of Geophysics, 36(4): 525-549. DOI:10.1029/98RG00716 |
Kagan Y Y. 1991. 3-D rotation of double-couple earthquake sources. Geophysical Journal International, 106(3): 709-716. DOI:10.1111/gji.1991.106.issue-3 |
Kennett B L N, Engdahl E R, Buland R. 1995. Constraints on seismic velocities in the Earth from traveltimes. Geophysical Journal of the Royal Astronomical Society, 122(1): 108-124. DOI:10.1111/gji.1995.122.issue-1 |
Kikuchi M, Kanamori H. 1991. Inversion of complex body waves-Ⅲ. Bulletin of the Seismological Society of America, 81(6): 2335-2350. |
Liu J, Li L, Zahradník J, et al. 2018. North Korea's 2017 test and its nontectonic aftershock. Geophysical Research Letters, 45(7): 3017-3025. DOI:10.1002/grl.v45.7 |
Liu J Q, Liu C, Lei J S, et al. 2017. The moment tensors of the 2013 Qianguo MS5.8 seismic swarm. Chinese Journal of Geophysics (in Chinese), 60(9): 3418-3431. DOI:10.6038/cjg20170912 |
Lu Z X, Jiang X Q, Pan K, et al. 2002. Seismic tomography in the northeast margin area of Sino-Korean platform. Chinese Journal of Geophysics (in Chinese), 45(3): 338-351. |
Minson S E, Dreger D S, Bürgmann R, et al. 2007. Seismically and geodetically determined nondouble-couple source mechanisms from the 2000 Miyakejima volcanic earthquake swarm. Journal Geophysical Research:Solid Earth, 112(B10): B10308. DOI:10.1029/2006JB004847 |
Nguyen M, Watanabe H, Budson A E, et al. 1994. Elevated levels of an angiogenic peptide, basic fibroblast growth factor, in the urine of patients with a wide spectrum of cancers. Journal of the National Cancer Institute, 86(5): 356-361. DOI:10.1093/jnci/86.5.356 |
Sokos E, Zahradník J R. 2013. Evaluating centroid moment tensor uncertainty in the new version of ISOLA software. Seismological Research Letters, 84(4): 656-665. DOI:10.1785/0220130002 |
Sokos E, Zahradník J, Gallovič F, et al. 2016. Asperity break after 12 years:the MW6.4 2015 Lefkada (Greece) earthquake. Geophysical Research Letters, 43(12): 6137-6145. DOI:10.1002/2016GL069427 |
Vavryčuk V. 2001. Inversion for parameters of tensile earthquakes. Journal Geophysical Research:Solid Earth, 106(B8): 16339-16355. DOI:10.1029/2001JB000372 |
Wen L X, Long H. 2010. High-precision location of North Korea's 2009 nuclear test. Seismological Research Letters, 81(1): 26-29. DOI:10.1785/gssrl.81.1.26 |
Xu Z H, Li S Y. 2013. Seismological encyclopedia knowledge (two)-Source Physics (Part 2). Recent Developments in World Seismology (in Chinese), (3): 34-40. |
Yang B J, Mu S M, Jin X, et al. 1996. Synthesized study on the geophysics of Manzhouli-Suifenhe geoscience transect, China. Chinese Journal of Geophysics (in Chinese), 39(6): 772-782. |
Yi G X, Long F, Wen X Z, et al. 2015. Seismogenic structure of the M6.3 Kangding earthquake sequence on 22 Nov. 2014, Southwestern China. Chinese Journal of Geophysics (in Chinese), 58(4): 1205-1219. DOI:10.6038/cjg20150410 |
Zahradník J, Čížková H, Bina C R, et al. 2017. A recent deep earthquake doublet in light of long-term evolution of Nazca subduction. Scientific Reports, 7: 45153. DOI:10.1038/srep45153 |
Zhang G W, Lei J S. 2015. Mechanism of the 2011 Tengchong, Yunnan, MS5.2 double earthquakes. Chinese Journal of Geophysics (in Chinese), 58(4): 1194-1204. DOI:10.6038/cjg20150409 |
Zhang M, Wen L X. 2013. High-precision location and yield of North Korea's 2013 nuclear test. Geophysical Research Letters, 40(12): 2941-2946. DOI:10.1002/grl.50607 |
Zhao C P, Chen Z L, Zheng S H, et al. 2008. Moment inversion of moderate earthquakes and the locally perturbed stress field in the Jiashi source region. Chinese Journal of Geophysics (in Chinese), 58(3): 782-792. |
Zhao L F, Xie X B, Wang W M, et al. 2014. The 12 February 2013 North Korean underground nuclear test. Seismological Research Letters, 85(1): 130-134. DOI:10.1785/0220130103 |
Zhao L F, Xie X B, Wang W M, et al. 2016. Seismological investigation of the 2016 January 6 North Korean underground nuclear test. Geophysical Journal International, 206(3): 1487-1491. DOI:10.1093/gji/ggw239 |
Zhao L F, Xie X B, Wang W M, et al. 2017a. The 9 September 2016 North Korean underground nuclear test. Bulletin of the Seismological Society of America, 107(6): 3044-3051. DOI:10.1785/0120160355 |
Zhao L F, Xie X B, He X, et al. 2017b. Seismological discrimination and yield estimation of the 3 September 2017 Democratic People's Republic of Korea (DPRK) underground nuclear test. Chinese Science Bulletin (in Chinese), 62(35): 4163-4168. DOI:10.1360/N972017-00979 |
Zheng Y, Ma H S, Lv J, et al. 2009. Source mechanism of strong aftershocks (MS5.6) of the 2008/05/12 Wenchuan earthquake and the implication for seismotectonics. Science in China Series D:Earth Sciences, 52(6): 739-753. DOI:10.1007/s11430-009-0074-3 |
刘俊清, 刘财, 雷建设, 等. 2017. 2013年前郭MS5.8震群矩张量研究. 地球物理学报, 60(9): 3418-3431. DOI:10.6038/cjg20170912 |
卢造勋, 蒋秀琴, 潘科, 等. 2002. 中朝地台东北缘地区的地震层析成像. 地球物理学报, 45(3): 338-351. DOI:10.3321/j.issn:0001-5733.2002.03.006 |
许忠淮, 李世愚. 2013. 地震学百科知识(二)——震源物理(下). 国际地震动态, (3): 34-40. DOI:10.3969/j.issn.0235-4975.2013.03.008 |
杨宝俊, 穆石敏, 金旭, 等. 1996. 中国满洲里-绥芬河地学断面地球物理综合研究. 地球物理学报, 39(6): 772-782. DOI:10.3321/j.issn:0001-5733.1996.06.007 |
易桂喜, 龙锋, 闻学泽, 等. 2015. 2014年11月22日康定M6.3级地震序列发震构造分析. 地球物理学报, 58(4): 1205-1219. DOI:10.6038/cjg20150410 |
张广伟, 雷建设. 2015. 2011年云南腾冲5.2级双震发震机理. 地球物理学报, 58(4): 1194-1204. DOI:10.6038/cjg20150409 |
赵翠萍, 陈章立, 郑斯华, 等. 2008. 伽师震源区中等强度地震矩张量反演及其应力场特征. 地球物理学报, 51(3): 782-792. DOI:10.3321/j.issn:0001-5733.2008.03.019 |
赵连锋, 谢小碧, 何熹, 等. 2017b. 2017年9月3日朝鲜地下核试验的地震学鉴别和当量估计. 科学通报, 62(35): 4163-4168. DOI:10.1360/N972017-00979 |
郑勇, 马宏生, 吕坚, 等. 2009. 汶川地震强余震(MS ≥ 5.6)的震源机制解及其与发震构造的关系. 中国科学D辑:地球科学, 39(4): 413-426. |
 2019, Vol. 62


