2. 中国地震局地壳应力研究所(地壳动力学重点实验室), 北京 100085;
3. 中国地震台网中心, 北京 100045;
4. 黑龙江省地震局, 哈尔滨 150090
2. Key Laboratory of Crustal Dynamics, Institute of Crustal Dynamics, China Earthquake Administration, Beijing 100085, China;
3. China Earthquake Networks Center, Beijing 100045, China;
4. Heilongjiang Province Earthquake Administration, Harbin 150090, China
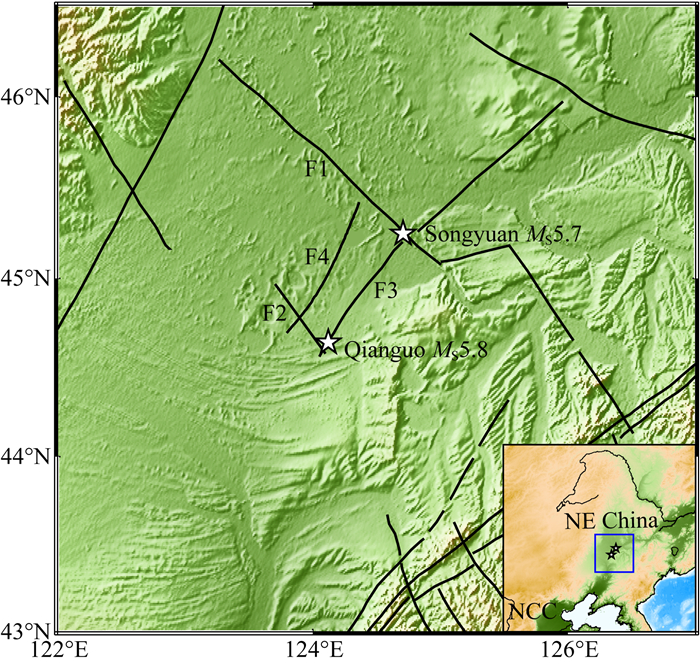
根据中国地震台网测定,2013年11月23日在吉林省前郭县发生5.8级地震(以下简称前郭MS5.8地震).时隔四年半,2018年5月28日1时50分在前郭东北地区的松原市发生5.7级地震(以下简称松原MS5.7地震).前郭MS5.8地震和松原MS5.7地震震源区均位于松辽盆地中央坳陷区(图 1).松辽盆地地处中国东北地区中部,是中生代以来构造伸展活动形成的断陷盆地.盆地内部北东向或北西向断裂交错分布,断裂的交汇区域是这两次中强地震活动的主要场所.与两次地震活动有关的构造主要包括4条断裂:北东向扶余—肇东断裂、北东向克山—大安断裂、北西向第二松花江断裂、北西向查干泡—道字井断裂(邓起东等,2002;邵博等,2016;万永魁等,2016)(图 1).自2013年前郭震群发生以来,众多学者对该地震序列从不同方面开展了相关研究.张洪艳等(2015)的双差定位结果显示,前郭震群的震源深度多集中在6~14 km范围内,表明孕震层主要集中在中上地壳.吴微微等(2014)通过矩张量反演,给出了前郭震群的震源机制解,并推测该震群的发震构造可能与北西向的隐伏逆冲断裂有关.卢燕红等(2017)采用地震双差层析成像技术,获取了前郭震群上地壳P波和S波速度结构,结果显示前郭震区下方上地壳范围内具有明显的低速结构,地震多发生在速度异常过渡区域.2018年松原MS5.7地震的震中位于北西向第二松花江断裂和北东向扶余—肇东断裂交汇区,距2013年前郭MS5.8地震的震中大约90 km,且前郭地震震中也位于北东向扶余—肇东断裂与北西向查干泡—道字井断裂交汇部位.然而,这两次地震发生机理如何目前并不清楚,可能与震源区地壳波速细结构不清楚有关.
|
图 1 研究区区域地质构造 F1—F4代表主要断裂(邓起东等,2002;邵博等,2016;万永魁等,2016),其中F1为第二松花江断裂,F2为查干泡—道字井断裂,F3为扶余—肇东断裂,F4为克山—大安断裂.白色五角星分别表示2013年11月23日吉林前郭MS5.8和2018年5月28日吉林松原MS5.7震中位置.右下角小图表示研究区域所在位置.NE China:中国东北地区; NCC,华北克拉通. Fig. 1 Sketch map of regional geological tectonics in the study region F1—F4 denote main faults(Deng et al., 2002; Shao et al., 2016; Wan et al., 2016); F1, the second Songhuajiang fault; F2, the Chaganpao-Daozijing fault; F3, the Fuyu-Zhaodong fault; F4, the Keshan-Daan fault. The white stars are the epicenter locations of the 23 November 2013 Qianguo MS5.8 earthquake and the 28 May 2018 Songyuan MS5.7 earthquake. The lower-right insert map shows the location of the study region. NE China, Northeast China; NCC, North China Craton. |
背景噪声成像被认为是获取高质量地壳细结构的有效方法之一(如Weaver and Lobkis, 2004; Shapiro and Campillo, 2004; Shapiro et al., 2005; Sabra et al., 2005a, b).该方法不依赖于地震事件,利用台站记录到的长时间连续波形进行互相关计算提取台站间的经验格林函数,获取较短周期的面波频散信息.在中国东北地区,该方法已经得到了较好的实践应用(如Zheng et al., 2011; Li et al., 2012; 潘佳铁等, 2014; Guo et al., 2015, 2016; Shen et al., 2016).相对于传统的地震面波层析成像方法,利用该方法提取的中短周期面波图像可为认识浅部地壳细结构提供更强有力的地震学约束.
本文将中国东北地区的中国地震局(CEA,China Earthquake Administration)固定台站、NECESSArray (Northeast China Extended Seismic Array)密集流动台阵以及中国地震局地壳应力研究所和中国科学院地质与地球物理研究所在五大连池地区合作布设的WAVESArray(Wudalichi Active Volcano Experiment of Seismology Array)流动台站三种观测资料相结合,使用背景噪声成像方法,获得松原和前郭地震源区5~35 s的Rayleigh波相速度分布,随后采用邻域算法(NA)(Sambridge, 1999a, b),反演了研究区三维S波速度结构.本文主要阐述与这两个地震相关的速度结构结果,其他整个东北地区的成像结果,请参阅Yang等(2019).为更好分析地震分布与速度结构之间的关系,本文采用双差定位方法(Waldhauser and Ellsworth, 2000)对2013年10月至2018年6月发生在研究区的地震进行了重定位.本文研究结果,对于认识研究区孕震环境提供了重要地震学依据.
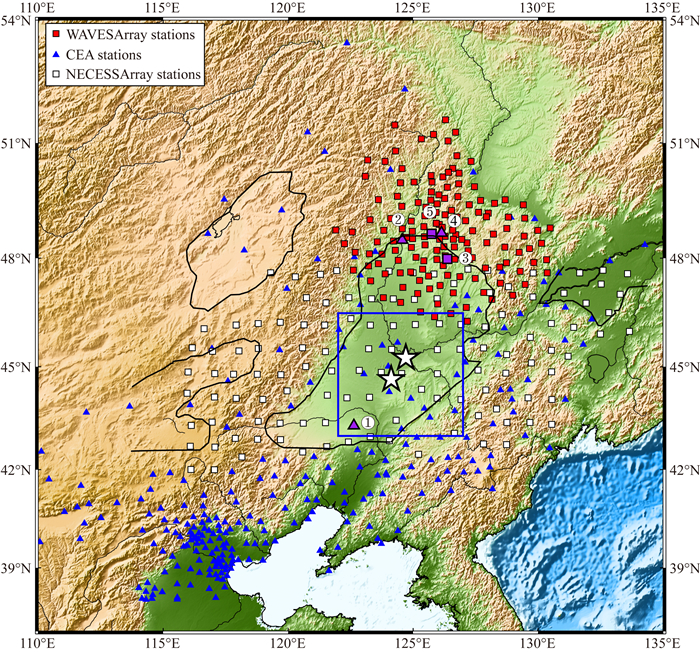
1 数据和方法 1.1 背景噪声层析成像本文使用了中国东北地区CEA固定台网、NECESSArray流动台网和五大连池地区WAVESArray流动台网共529个台站的观测资料(图 2),具体包括260个CEA固定台站2016年1月至2017年4月的连续波形记录(郑秀芬等,2009;Zheng et al., 2010)、120个NECESSArray流动台站2009年9月至2011年8月的连续波形记录(Guo et al., 2016)以及149个WAVESArray流动地震台站记录到的连续波形资料.WAVESArray资料中的46个台站和60个台站均由中国地震局地壳应力研究所分两期布设,本研究中分别使用了其2015年9月至2017年10月和2016年9月至2017年10月观测到的连续波形资料.另外,43个台站是由中国科学院地质与地球物理研究所布设,本研究使用了其2015年6月至2016年9月期间观测到的连续波形记录.
|
图 2 背景噪声层析成像所用台站分布示意图 蓝色三角代表CEA固定台站,白色方块表示NECESSArray流动台站,红色方块为WAVESArray流动台站.蓝色方框为研究区域所在位置.白色五角星分别表示2013年11月23日吉林前郭MS5.8和2018年5月28日吉林松原MS5.7震中位置.①—⑤分别代表图 3中选取的固定台和流动台的位置,其中①为固定台NM.AGL;②为固定台HL.NEH;③为流动台WAVES.L008;④为固定台HL.WDL;⑤为流动台WAVES.TA14. Fig. 2 Distribution of seismic stations used in ambient noise tomography Blue triangles represent CEA stations, white squares are NECESSArray portable stations, and red squares indicate WAVESArray portable stations. The blue square shows the location of the study region. The white stars are epicenter locations of the 23 November 2013 Qianguo MS5.8 earthquake and the 28 May 2018 Songyuan MS5.7 earthquake. The numbers ①—⑤ represent CEA provincial seismic stations and WAVESArray stations as shown in Fig. 3, where ① is CEA provincial seismic station NM.AGL; ② represents CEA provincial seismic station HL.NEH; ③ denotes WAVESArray station WAVES.L008; ④ is CEA provincial seismic station HL.WDL, and ⑤ represents WAVESArray station WAVES.TA14. |
对原始的连续波形记录,采用Bensen等(2007)提出的方法进行预处理.处理流程包括:(1)对原始的垂向连续记录重采样至1 Hz,去均值、去倾斜、去仪器响应和5~35 s的带通滤波;(2)采用时间域归一化方法去除地震信号和仪器畸变信号的干扰,频率域归一化方法拓宽频带范围;(3)以天为单位,对预处理后的每个台站对进行互相关运算并叠加,得到双台间的噪声互相关函数.图 3分别展示了固定台NM.AGL与其他固定台以及WAVESArray流动台的互相关波形,并选取了四条穿越研究区域的台站对(图 2)的互相关波形进行了展示.由图 3可知,不论固定台与固定台,还是固定台与流动台的互相关波形,均具有良好的对称性和相干性.从信噪比分析结果来看,四组台站对互相关波形的信噪比均大于15,表明穿越研究区域的互相关波形具有较好的信噪比.

|
图 3 噪声波形互相关与信噪比 (a) CEA固定台站NM.AGL分别与其他固定台站的互相关波形;(b) CEA固定台站NM.AGL与WAVESArray流动台站的互相关波形;(c, e)选取(a)中的穿过研究区的台站对(NM.AGL与HL.NEH)和(NM.AGL与HL.WDL)互相关波形以及信噪比示意图;(d, f)选取(b)中的穿过研究区的台站对(NM.AGL与WAVES.L008)和(NM.AGL与WAVES.TA14)互相关波形以及信噪比示意图.图中台站位置参阅图 2中标示的台站. Fig. 3 Ambient noise waveform cross-correlation and the Signal-to-Noise ratio (SNR) (a) Cross-correlation waveforms between CEA provincial seismic station NM.AGL and other CEA seismic stations; (b) Cross-correlation waveforms between CEA provincial seismic station NM.AGL and WAVESArray stations; (c, e) Cross-correlation waveforms between NM.AGL and HL.NEH and between NM.AGL and HL.WDL and their SNRs, and these stations pass through the study area and waveforms are selected from (a); (d, f) Cross-correlation waveforms between NM.AGL and WAVES.L008 and between NM.AGL and WAVES.TA14 and their SNRs, and these stations pass through the study area and waveforms are selected from (b). The locations of selected stations are shown in Fig. 2. |
在获取互相关函数的基础上,采用Yao等(2006)提出的基于图像分析技术的时间域方法对相速度频散曲线进行提取.在提取的过程中主要遵循以下三个原则.第一,对于给定的周期,只选取互相关信噪比大于10的观测结果,其中信噪比定义为信号窗口振幅峰值与噪声窗口振幅均方根的比值(Bensen et al., 2007);第二,选取台间距大于两倍波长的观测数据,以满足远场近似条件;第三,在反演过程中,剔除拟合残差较大的路径数据,以保持整体观测结果的一致性.对5~35 s的Rayleigh波相速度频散曲线, 采用Montagner(1986)发展的区域化反演算法获取不同周期的面波相速度分布图像.图 4展示出反演中使用的射线路径和对应周期的检测板实验结果,可以看出两个地震震源区的射线路径在中短周期(< 20 s)覆盖较为密集,研究区反演结果可以达到0.8°×0.8°的空间分辨率;对于中长周期来说,反演可以恢复1°×1°尺度的速度异常.

|
图 4 射线路径与相应检测板实验结果 (a, c, e) 10, 20和30 s周期相速度射线路径覆盖图.蓝色三角代表所用的所有台站位置.(b, d)波速异常尺度为0.8°×0.8°模型下10 s和20 s周期相速度检测板实验结果.(f)波速异常尺度为1.0°×1.0°模型下30 s周期相速度检测板实验结果.其他符号与图 1中的相同. Fig. 4 Ray paths and their corresponding results of checkerboard resolution tests (a, c, e) Ray paths at 10, 20 and 30 s periods. Blue triangles denote seismic stations used. (b, d) Results of the checkerboard resolution tests of phase velocities at 10 and 20 s periods with a velocity anomaly size of 0.8°×0.8°. (f) Results of the checkerboard resolution test of phase velocity at 30 s period with a velocity anomaly size of 1.0°×1.0°. Other labeling is the same as that in Fig. 1. |
图 5展示了不同周期的面波相速度分布图像.Rayleigh面波相速度对于S波速度比较敏感,一般认为基阶Rayleigh面波相速度对S波速度结构的最大敏感深度约为1/3波长深度处.不同周期的Rayleigh波相速度分布图像反映了不同深度的速度结构特征.其中,周期为8 s的相速度结果基本反映了上地壳8 km深度左右的速度结构,在该深度范围表现为明显的低速异常(图 5a);12和16 s周期的相速度图像主要反映了中地壳12~20 km深度范围的速度变化特征,可以看出两个震源区均表现为较强低波速异常,呈北北东向展布(图 5b和5c);随着周期的增加,松辽盆地中部的低波速异常逐渐减弱,在30 s中长周期的图像上,呈现出相对高波速的结构特征(图 5d—f).

|
图 5 不同周期瑞利波相速度分布 红色和蓝色分别代表低波速和高波速异常,色标位于图右侧.AV(Average velocity)表示区域相速度的平均值.其他符号与图 1中的相同. Fig. 5 Rayleigh wave phase velocities at different periods Red and blue colors represent low and high velocity anomalies, respectively, the scale of which is shown on the right. AV, Average velocity. The other labeling is the same as that in Fig. 1. |
在获得相速度分布的基础上,本文对研究区域进行了0.5°×0.5°的网格划分,采用邻域算法(NA)(Sambridge, 1999a, b),反演每个节点下方的一维S波速度结构(Yao et al., 2008).在模型参数化的过程中,将地壳中设置为5 km为一个层厚,上地幔设置为10 km为一个层厚,每一层的速度值采用了Shen等(2016)三维速度模型作为本研究区域相应节点上S波的参考值,具体模型深度层参数的设置及其速度变化范围如表 1所示.Moho面的深度由Tao等(2014)的接收函数结果进行插值得到.地壳中的P波速度可由Tao等(2014)地壳平均纵横波速度比值获得,密度则通过经验公式来获得(Brocher, 2005).在上地幔顶部,我们采用另一经验公式来计算P波速度和密度相对于S波速度的变化(Masters et al., 2000; Yao et al., 2008):

|
|
|
表 1 NA反演中初始S波速度模型参数化及速度变化范围 Table 1 Parameterization of initial S-wave velocity model and their velocity perturbation ranges in the NA inversion |
反演过程中,第一步通过应用维诺单元的分割方法,在模型空间中不断搜索可被接受的模型,每次迭代生成新模型的总数NS设置为100,在生成的模型中选取50个(Nr=50)拟合最好的模型,如此反复迭代直至收敛.然后,将生成的模型进行贝叶斯统计分析,得到后验平均模型及其标准差以及每一层S波速度的1-D和2-D边际后验概率密度函数.其中,一维边际后验概率密度函数可通过与高斯函数分布的偏离程度来判断反演结果的可靠性,该图像的宽度可表征模型的不确定性;而二维边际后验概率密度函数的分布可衡量不同模型参数之间的折衷.该图像分布越接近圆形,表明两个模型参数之间的折衷性越小(Yao et al., 2008;袁艺等,2016).图 6展示了前郭MS5.8和松原MS5.7两个地震震中节点位置处反演的频散曲线拟合情况以及反演的一维S波初始模型、后验平均模型及其标准偏差的对比,可以看出这两个节点处由后验模型计算得到的理论频散曲线与观测频散曲线的拟合程度(0.4544和0.5387),相对于初始模型(2.7334和1.904)得到了有意义改进.从搜索得到的后验平均模型可以看到,两个地震震中节点下方5~10 km的深度范围表现为相对高波速异常,而在10~20 km深度呈现相对低的波速结构.通过后验平均模型的标准偏差可以看到地壳深度范围内各层S波速度的标准差均小于0.2 km·s-1.

|
图 6 松原MS5.7和前郭MS5.8震中节点位置频散曲线与一维速度模型 (a, c)不同周期Rayleigh波相速度观测频散曲线(黑色圆点)、初始模型拟合的频散曲线(红色实线)与后验模型拟合的频散曲线(蓝色实线)对比图.(b, d) NA反演的一维S波初始模型(红色实线)和后验平均模型(蓝色实线)对比.其中,灰色区域表示后验平均模型的标准偏差. Fig. 6 Dispersion curves and 1-D velocity models at the grid points of the Songyuan MS5.7 and Qianguo MS5.8 earthquake hypocenters (a, c) Comparison between observed (black dots) and synthetic (red and blue lines) Rayleigh wave dispersion curves in the initial and posterior models. (b, d) Comparison of 1-D initial S-wave model (red lines) and posteriori mean model (blue lines) inferred from NA inversion. The grey regions give the standard error of the posteriori mean model. |
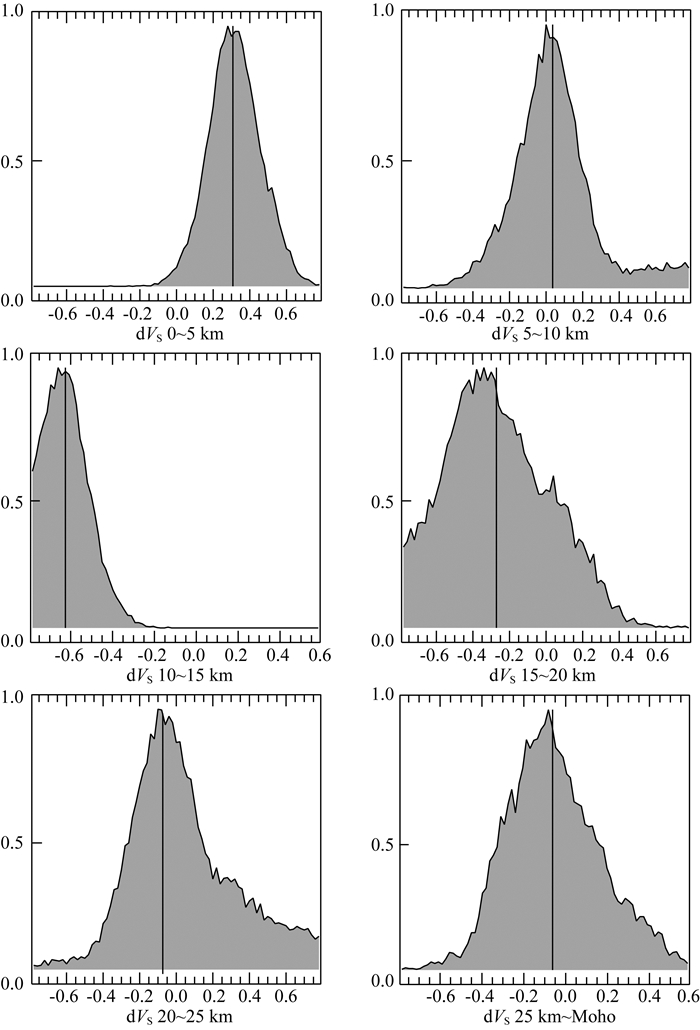
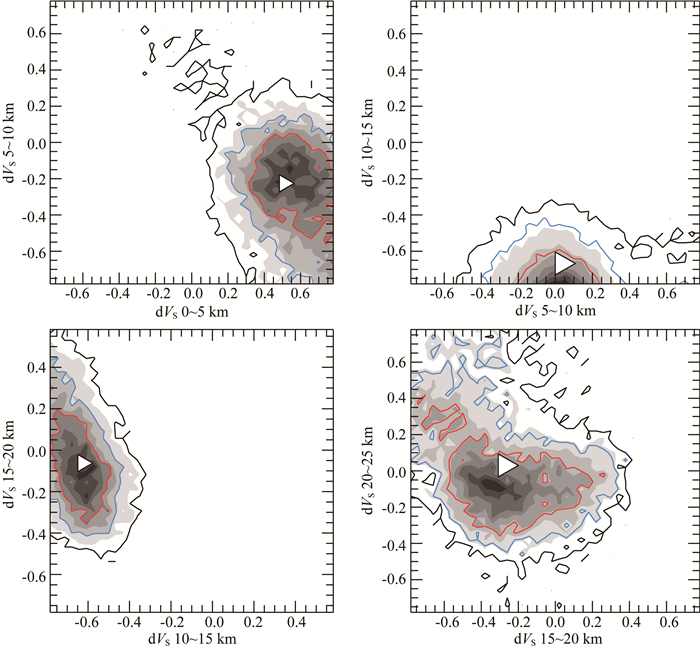
图 7和图 8分别展示了松原MS5.7震群节点位置下方地壳内不同层S波速度的一维和二维边际后验概率密度分布.由图 7可以看出,地壳中每一层S波速度的一维边际后验概率密度函数近似呈现为高斯分布,而后验平均模型的值(黑色实线)与一维边际后验概率密度函数的峰值(最可能的模型)较为接近.由图 8可知,研究区域下方地壳内不同层S波速度之间的二维边际后验概率密度函数分布等值线近似为圆形,表明不同参数在反演过程中具有较小折衷特性.根据图 4检测板实验结果,地壳中层厚为5 km可获得研究区波速异常特征的较好还原,因此认为地壳纵向分辨率为5 km.
|
图 7 松原MS5.7震中节点位置地壳内每一层S波速度的一维边际后验概率密度函数 横坐标代表每一层S波速度(km·s-1)的变化范围,纵坐标表示归一化的后验概率密度.每张小图中的黑色实线代表后验平均模型.每幅图中的后验平均模型的值与一维边际后验概率密度函数的峰值即最可能的模型相接近. Fig. 7 1-D marginal posterior probability density functions (PPDF) of the VS at the grid points of the Songyuan MS5.7 earthquake hypocenter The horizontal axis shows the perturbation range of VS (km·s-1) in each layer, whereas the vertical axis is the normalized posterior probability density. The black solid line in each plot is the parameter value of the posterior mean model. Note that the VS value of each layer in the posterior mean model is close to the peak value of each 1-D marginal PPDF that is the most possible model. |
|
图 8 松原MS5.7震中节点位置地壳内每一层S波速度的二维边际后验概率密度函数 每张小图中的横纵坐标分别表示不同层VS(km·s-1)的变化范围.黑色、蓝色和红色实线分别代表 60%、90%和99%置信级的等值线.白色三角表示后验平均模型的值.图中等值线越集中越接近圆形,表示不同层的VS的折衷越小. Fig. 8 2-D marginal posterior probability density functions of VS at the grid points of the Songyuan MS5.7 earthquake hypocenter in each layer of the crust The horizontal and vertical axes show the perturbation of VS (km·s-1) for each layer in each plot. Black, blue and red lines are the contours of 60%, 90% and 99% confidence levels. The white triangle in each panel represents the value of posterior mean model. Note that the more circular the contour is, the smaller the trade-off between velocities in different layers is. |
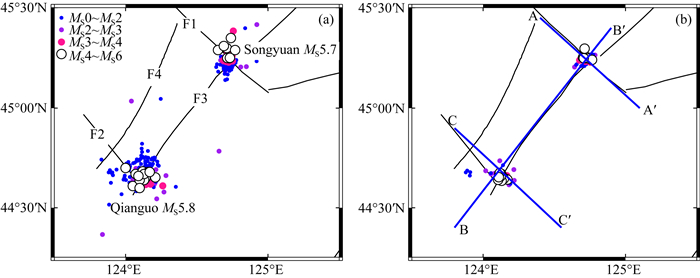
为较好地研究速度结构和地震活动的相关性,则需获取较可靠的震源参数信息.然而,由于受所用速度模型和地震定位方法等因素所致,中国地震台网中心提供的观测报告中的震源参数存在一定不确定性,因此用观测报告中的震源参数分析其与速度模型之间的关系受到一定制约(如张广伟等,2011;张广伟和雷建设,2013;梁姗姗等, 2017, 2018;王健等, 2016, 2018).为此,本研究需采用双差重定位方法(Waldhauser and Ellsworth, 2000)重新确定前郭震群和松原震群震源参数.双差定位方法主要利用两个相近地震事件到达同一台站的走时残差之差进行重新定位,从而能够有效地降低由于速度结构的不确定性对定位结果的影响.前人利用这种方法,已对2013年前郭震群开展了研究,且获得了相关定位结果.譬如,张洪艳等(2015)利用该方法对2013年10—12月发生在吉林前郭震群进行了重定位,获得了336次地震的重定位结果.盛书中等(2017)对2013年10月—2014年7月的观测数据进行了双差重定位,结果显示2013年前郭震群呈NW-SE向条带状分布,深度主要集中在7~11 km.李君和王勤彩(2018)使用该方法对前郭震群的发震机制进行了较为详细的研究,定位后的震群空间展布形态和震源深度范围与盛书中等(2017)基本一致.本研究开展了2013年10月至2018年6月期间发生在研究区内的406次地震的双差定位工作,所用地震的初始位置和到时资料均由中国地震台网中心观测报告提供.在重定位过程中,共使用了9163条P波和7892条S波到时资料.为了确保重定位结果的可靠性,保留地震台站记录数大于5的地震事件,并根据P波和S波的时距曲线,选择震中距在300 km范围内的到时资料和事件对最大距离为5 km的搜索半径,最终共有288次地震配对并参与重新定位.速度模型参考了温岩等(2007)和张洪艳等(2015)的一维P波模型(图 9).P波权重1.0,S波权重0.5,利用共轭梯度法求取阻尼最小二乘解,最终得到了252次地震事件的重定位结果.走时均方根残差由重定位前的0.39 s变为重定位后的0.13 s.图 10为前郭MS5.8和松原MS5.7震群双差定位前后震中平面分布图,可以看到重定位后的地震分布更为集中,其中前郭震群呈现出沿NW-SE向断裂分布,而松原震群呈现出沿NE-SW向断裂分布的趋势.图 11a—c展示了前郭MS5.8和松原MS5.7震群不同纵剖面的重定位后的震源深度分布,可以看出松原震群重定位后的震源深度主要分布在6~13 km,而前郭震群除个别微震或小震的震源深度较浅外,大部分地震特别是MS4.0以上的中强震主要分布在5~14 km的深度范围.

|
图 9 本研究所用的一维速度模型与前人区域模型(温岩等,2007;吴微微等,2014;张红艳等,2015)及CRUST1.0全球模型(Laske et al., 2013) Fig. 9 1-D velocity model used in this study and previous regional models (Wen et al., 2007; Wu et al., 2014; Zhang et al., 2015) and CRUST1.0 global model (Laske et al., 2013) |
|
图 10 前郭MS5.8和松原MS5.7震群重定位前(a)后(b)震中对比图 Fig. 10 Comparison of earthquake hypocenters of Qianguo MS5.8 and Songyuan MS5.7 swarms before (a) and after (b) relocation |

|
图 11 不同速度模型(图 9)重定位后的地震不同纵剖面(图 10b)分布图 (a—c)采用本研究所用速度模型(图 9中红色虚线)重定位结果;(d—f)采用温岩等(2007)速度模型(图 9中蓝色虚线)重定位结果;(g—i)采用吴微微等(2014)速度模型(图 9中黑色虚线)重位结果;(j—l)采用张洪艳等(2015)速度模型(图 9中橙色虚线)重定位结果;(m—o)采用CRUST1.0全球速度模型(Laske et al., 2013)(图 9中绿色虚线)重定位结果. Fig. 11 Distributions of earthquakes relocated from different velocity models (Fig. 9) along different profiles (Fig. 10b) (a—c) Relocated results from the velocity model used in this study (red dashed line in Fig. 9); (d—f) Relocated results from the velocity model of Wen et al. (2007) (blue dashed line in Fig. 9); (g—i) Relocated results from the velocity model of Wu et al. (2014) (black dashed line in Fig. 9); (j—l) Relocated results from the velocity model of Zhang et al. (2015) (orange dashed line in Fig. 9); (m—o) Relocated results from the CRUST1.0 global velocity model (Laske et al., 2013) (green dashed line in Fig. 9). |
为了验证不同速度模型对重定位结果的影响,我们采用包括本研究使用模型在内的5种不同的速度模型(图 9)(温岩等,2007;吴微微等,2014;张洪艳等,2015;Laske et al., 2013)对比前郭和松原震群的定位结果(图 11).通过图 11的对比可以看到,虽然单个地震事件的重定位深度会有所变化,但震群的整体优势深度分布均较为一致.表 2列出了前郭震群中5次MS5.0以上的地震分别采用上述5种模型(图 9)的重定位结果.由表 2可知,尽管2013年10月31日5.3级地震与2013年11月23日5.8级地震采用不同的速度模型其定位结果的震源深度差异可达2.9 km和1.9 km,但大部分差异性集中在0.4~1.0 km左右,由此我们认为本研究的重定位结果对模型的依赖性较小.将这5种不同速度模型的定位结果与前人前郭震群的重定位结果(张洪艳等,2015;盛书中等,2017)进行对比,结果显示我们的结果与盛书中等(2017)的重定位结果较为一致,但与张洪艳等(2015)研究结果中的前郭震群部分地震在震源深度方面存在约3~4 km差异,这可能与张洪艳等(2015)所用反演参数和观测资料不同有关.此外,我们还考虑了震源深度处速度明显跳变(即间断面)的深度变化对重定位结果的影响情况(表 3),可以看出间断面深度变化会对震源深度产生一定影响,但震源深度均在较小(0.8 km或更小0.2~0.3 km)范围内变化,因此我们认为本研究的重定位结果具有比较好的稳定性和可靠性.
|
|
表 2 本研究使用的速度模型与使用前人模型的重定位结果的对比 Table 2 Comparison of relocations from velocity model used in this and previous studies |
|
|
表 3 本研究与利用改变间断面(速度跃变明显位置)深度后形成不同速度模型的重定位震源深度的对比 Table 3 Comparison of earthquake depths in this study and those relocated in velocity models with various depth discontinuities where velocity variations are obvious |
通过将不同深度节点的S波速度进行插值,最终可以获得研究区地壳三维S波速度结构.图 12展示了研究区域下方5~30 km不同深度的S波速度成像结果,可以看出两个地震震中下方5~7.5 km深度范围内存在明显的大面积低波速结构(图 12a和12b),结合松辽坳陷区上覆约8 km厚度沉积层的推测(Wang et al., 2016),因此认为该区8 km以浅部分低波速异常主要是由地表沉积层影响所致.随着深度的增加,在10 km深度,尽管震源区以北和以南地区均存在弱低波速异常,但在震源区却呈现出相对高波速结构(图 12c).在12.5~17.5 km深度上,波速基本呈现出近北北东向低波速异常(图 12d—f),但在15 km深度的低波速异常明显增强(图 12e).在20和30 km深度上,尽管也呈现出北北东向低波速异常,但已明显减弱(图 12g, 12h).

|
图 12 不同深度S波速度分布 红色表示低速,蓝色表示高速,色标位于图右侧.其他符号与图 1中的相同. Fig. 12 S-wave velocities at different depths Red and blue colors represent low and high velocities, respectively, the scale of which is shown on the right. The other labeling is the same as that in Fig. 1. |
为更清晰地了解前郭地震和松原地震与速度结构之间的关系,我们展示穿过这两个地震的四条纵剖面(图 13),并用S波速度值(图 13a, 13c, 13e, 13g)和波速异常值(图 13b, 13d, 13f, 13h)两种方式来表达.其中,A-A′是穿过松原地震震源区自西向东的纵剖面,B-B′剖面是沿着第二松花江断裂走向、垂直于扶余—肇东断裂、穿过松原地震震源区自西北向东南的纵剖面,C-C′剖面是沿着扶余—肇东断裂、垂直于查干泡—道字井断裂和第二松花江断裂、自西南向北东方向分别穿过前郭地震震源区和松原地震震源区,D-D′剖面是沿着查干泡—道字井断裂、垂直于扶余—肇东断裂、自东北向西南穿过前郭地震震源区的纵剖面.由图 13可以清楚地看到,这些剖面有着共同的明显的波速结构特征,即在8 km以浅和13~20 km的深度上分别存在明显的低波速异常, 而两者之间的8~13 km深度范围内却存在相对高波速异常区,前郭地震和松原地震恰好位于此高波速异常区.

|
图 13 穿过震中的纵剖面波速分布 (a, c, e, g) S波绝对速度;(b, d, f, h) S波相对速度;(i)纵剖面位置.红色和蓝色分别代表低波速和高波速异常,其色标位于图底.白色圆圈表示MS4.0以上的重定位后的地震位置.图顶部黑色曲线表示沿剖面地形. Fig. 13 Velocities along vertical cross-sections passing through the earthquake hypocenters (a, c, e, g) S-wave absolute velocities. (b, d, f, h) S-wave relative velocities. (i) Locations of vertical cross-sections. Red and blue colors denote low and high velocities, the scale of which is shown at the bottom. White circles are the relocated earthquakes with magnitudes greater than MS4.0. Black curves on the top of each plot is topography along the profile. |
由图 12和图 13可知,松辽盆地内部自地表至8 km深度范围内呈现出明显的S波低速异常结构特征.这种结构特征与前人在该区域的面波成像结果(如Li et al., 2012; Guo et al., 2015, 2016; Kang et al., 2016; Shen et al., 2016; Liu et al., 2017)较为一致.根据地质学和人工地震测深研究结果,认为松辽盆地自白垩纪以来经历了广泛的同生断裂和沉积下陷历史,其中央坳陷区沉积厚度达8 km(如印长海等,2013; Wang et al., 2016).因此,我们认为研究区上地壳的低波速异常主要受沉积层的影响所致.
本研究的成像结果中,最显著的一个结构特征是在松辽盆地中北部下方的中地壳约13~20 km深度范围内存在一条明显的低波速异常条带,且呈北北东方向展布(图 12d—g和图 13c),这一结果得到了其他地球物理资料的印证和支持.Liu等(2017)使用背景噪声伴随成像方法,对中国东北地区的地壳结构进行了成像反演,结果显示出松辽盆地下方中地壳深度存在明显的低波速异常.该区域的广角地震测深结果表明,松辽盆地位于岩石层上隆区,盆地内部下方16~24 km深度处存在一个低波速异常层(杨宝俊等,1996; Wang et al., 2016).其他人工地震反射剖面也揭示出在松辽盆地下方约15~20 km深度范围发育拆离带,并且存在地幔热底劈体(杨光等,2001).在电性结构方面,松辽盆地在15~25 km深度处电阻率仅约3~8 Ωm(杨宝俊等,1996),高导层的位置与上述拆离带发育的区域较为一致.重力资料研究结果显示,盆地下方约12~18 km深度存在着低密度层(卫平生等,2008).这些结果说明,中地壳低波速高导层结构可能反映了流体作用的存在.
中地壳的流体作用可能与松辽盆地下方地幔深部动力学过程有关.接收函数的结果表明,松辽盆地下方存在明显的岩石圈减薄(Guo et al., 2014),人工地震剖面也揭示出松辽盆地内部地幔上隆导致了地壳减薄(Wang et al., 2016).最新的大地电磁测深结果显示松辽盆地岩石圈厚度仅45 km,壳幔存在双层高导异常,分别指示了岩浆的底侵和软流圈上涌(韩江涛等, 2018).地热学研究结果表明,松辽盆地有较高的地温场,特别是盆地中央地温梯度较高,平均约为4.0 ℃/hm(薛林福等,2018).Wang和Li(2018)通过地壳热模拟结果显示松辽盆地中北部下方存在明显热异常,暗示了松辽盆地下方可能存在岩石圈拆沉和地幔热物质上涌.另外,在研究区域的油气勘探过程中产出了高纯度CO2,表明具有无机成因幔源特征,并推断幔源CO2气藏的形成与来自地幔的基性岩浆作用及断裂活动有关(王海清和许文良,2003;李贶等,2015;Liu et al., 2018; 薛林福等,2018).迟元林等(2002)发现源于中下地壳的热流底辟网络,认为是深部地幔物质向地壳侵入的产物.此外,地球化学资料给出了该区镁和钠等元素交代的证据(张景廉等,2003).这些研究结果,均揭示出松辽盆地存在强烈的壳幔流体作用,为松辽盆地下方的地幔流体入侵提供了重要证据.我们据此推测,松辽盆地下方可能存在岩石圈拆沉和地幔热物质上涌,上涌的地幔热物质可能为中地壳的低波速高导性质的物质储集提供了重要来源.随着地幔上隆和地幔流体的入侵,在中地壳形成低速层,低速层反映的流体沿断裂系统等薄弱带上侵,可能对地震的发生起着重要作用(张景廉和于均民,2004;卫平生等,2008;印长海等,2013;张洪艳等,2015).
3.2 地震与地壳速度结构的关联性刘俊清等(2017)利用吉林、辽宁、黑龙江和内蒙古四个省份地震台网记录到的地震资料开展了2013年前郭MS5.8震群双差定位和MS5.0以上地震的全矩张量解反演研究,结果显示无论震源深度还是矩心深度均较浅(约4~6 km),且双力偶成分仅有21%~71%远小于构造地震,因此推测前郭震群可能与油田开采活动有关.李贶等(2015)和刘哲等(2017)研究结果难以排除因油气开采导致浅部应力调整而引发较深处相联通断裂发生地震的可能性.然而,薛林福等(2018)根据大地电磁测深、地热梯度、He同位素和CO2碳同位素综合分析,认为松原前郭地震的发生与地幔深部岩浆活动有关.为清楚了解前郭地震机理,本研究分析松原地震序列与速度结构之间的关系.表 4和表 5分别列出了前郭地震和松原地震序列4.0级以上地震的重定位结果,可以看出MS4.0以上的地震震源深度主要分布在8~13 km范围内,表明松原地震和前郭地震两个震源区的孕震层主要集中在中上地壳.本研究将MS4.0以上地震的重定位结果投影到S波速度结构的纵剖面上,其中重定位后两个地震序列4级以上的地震主要集中于8~13 km深度范围相对高波速异常区,有少数地震分布在相对高波速带与上、中地壳低波速层的交汇部位(图 13),表明MS4.0以上的中强震发生在S波高波速或高低波速过渡区域.根据卢燕红等(2017)的成像结果显示,前郭震群发生在P波低速、S波低-高波速交汇和低波速比区域,该结果与本文的成像结果较为一致.
|
|
表 4 吉林前郭震群MS≥4.0以上重定位结果 Table 4 Relocations of MS≥4.0 earthquakes in the Qianguo seismic swarm |
|
|
表 5 吉林松原震群MS≥4.0以上重定位结果 Table 5 Relocations of MS≥4.0 earthquakes in the Songyuan seismic swarm |
已有的地震与速度结构之间关系的研究结果表明,中强以上地震的发生与壳内低速层的存在具有明显相关性(Zhao et al., 2002).Lei等(2008)研究发现1976年唐山7.8级地震震源位于高波速区,其下方地壳存在明显的低波速异常.Lei和Zhao(2009)对汶川8.0级震区的P波和S波成像结果表明,地震发生在龙门山断裂带高波速异常边缘,震源下方同样存在低波速和高泊松比异常特征.1995年日本神户地震震源区也有类似的深部结构特征(Zhao et al., 1996).对比松原和前郭震群的震源深度分布及其下方波速结构(图 12和图 13),我们推测松辽盆地中北部下方可能发生岩石圈的拆沉导致上地幔热物质上涌,形成特殊的局域构造环境,导致地幔流体入侵并在中地壳形成低波速层,低速层上方的相对高速区域更易于积累能量并形成孕震区,低波速异常所携带的流体作用可能会降低断层面有效正应力(Lei and Zhao, 2009),从而导致了两个震源区中强度地震的发生.这种热物质上涌,可能与太平洋板块西向深俯冲至我国东北特别是松辽盆地下方地幔转换带内形成“大地幔楔”结构(如Zhao, 2004; Lei and Zhao, 2005, 2006; Huang and Zhao, 2006; Zhao et al., 2009; Lei et al., 2013; Wei et al., 2012, 2015; Chen et al., 2017; 雷建设等,2018)有关.这样的“大地幔楔”结构中,存在有地幔转换带内滞留板块脱水导致的热湿物质上涌和地幔角流等动力学过程.
4 结论本文应用背景噪声层析成像技术,对我国东北地区三个台网密集台站的连续波形记录波形资料进行了成像,获得了松原和前郭地震源区下方的高分辨率地壳速度结构,结合这两个地震震群的双差定位结果,研究了地震与速度结构之间的关系.结果表明,研究区域下方8 km以浅的深度范围表现为明显的低速异常,认为该低速异常主要受地表沉积层影响所致.重定位后两个地震序列中,多数MS4.0以上的中强度地震分布在8~13 km深度的高波速异常区,其下方存在明显低波速异常,表明松辽盆地相对高波速异常区易于积累能量孕育地震,而低波速异常所携带的流体作用可降低断层面有效正应力从而触发地震.这些低波速异常的形成,可能与松辽盆地下方的岩石圈拆沉导致的地幔热湿物质上涌和地幔流体的入侵有关,这与太平洋板块西向深俯冲至地幔转换带形成的“大地幔楔”结构与动力学过程密切相关.
致谢 感谢中国科学技术大学姚华建教授提供背景噪声层析成像的程序包,中国地震局地球物理研究所“国家数字测震台网数据备份中心”提供的固定台站的连续波形数据(郑秀芬等,2009;Zheng et al., 2010),中国科学院地质与地球物理研究所地震台阵实验室(doi:10.12129/IGGSL.Data.Observation, http://www.seislab.cn/),IRIS网站提供NECESSArray的连续波形资料,参与五大连池WAVESArray宽频带野外流动地震观测台站的台址勘选、仪器布设、巡台和数据回收的同志,中国地震台网中心提供地震观测报告.本文图件使用GMT软件(Wessel and Smith,1995)绘制,三位匿名评审专家提出了建设性意见,对此文的修改大有裨益,在此表示诚挚的谢意.
Bensen G D, Ritzwoller M H, Barmin M P, et al. 2007. Processing seismic ambient noise data to obtain reliable broad-band surface wave dispersion measurements. Geophysical Journal International, 169(3): 1239-1260. DOI:10.1111/j.1365-246X.2007.03374.x |
Brocher T M. 2005. Empirical relations between elastic wavespeeds and density in the earth's crust. Bulletin of the Seismological Society of America, 95(6): 2081-2092. DOI:10.1785/0120050077 |
Chen C X, Zhao D P, Tian Y, et al. 2017. Mantle transition zone, stagnant slab and intraplate volcanism in Northeast Asia. Geophysical Journal International, 209(1): 68-85. |
Chi Y L, Yun J B, Meng Q A, et al. 2002. Deep Structure, Basin-Forming Dynamics and Hydrocarbon Accumulation in Songliao Basin (in Chinese). Beijing: Petroleum Industry Press: 143-192.
|
Deng Q D, Zhang P Z, Ran R K, et al. 2003. Basic characteristics of active tectonics of China. Science in China Series D:Earth Sciences, 46(4): 356-372. |
Guo Z, Cao Y L, Wang X G, et al. 2014. Crust and upper mantle structures beneath Northeast China from receiver function studies. Earthquake Science, 27(3): 265-275. DOI:10.1007/s11589-014-0076-x |
Guo Z, Chen Y J, Ning J Y, et al. 2015. High resolution 3-D crustal structure beneath NE China from joint inversion of ambient noise and receiver functions using NECESSArray data. Earth and Planetary Science Letters, 416: 1-11. DOI:10.1016/j.epsl.2015.01.044 |
Guo Z, Chen Y J, Ning J Y, et al. 2016. Seismic evidence of on-going sublithosphere upper mantle convection for intra-plate volcanism in Northeast China. Earth and Planetary Science Letters, 433: 31-43. DOI:10.1016/j.epsl.2015.09.035 |
Han J T, Guo Z Y, Liu W Y, et al. 2018. Deep dynamic process of lithosphere thinning in Songliao basin. Chinese Journal of Geophysics (in Chinese), 61(6): 2265-2279. DOI:10.6038/cjg2018L0155 |
Huang J L, Zhao D P. 2006. High-resolution mantle tomography of China and surrounding regions. Journal of Geophysical Research:Solid Earth, 111(B9): B09305. DOI:10.1029/2005JB004066 |
Kang D, Shen W S, Ning J Y, et al. 2016. Seismic evidence for lithospheric modification associated with intracontinental volcanism in Northeastern China. Geophysical Journal International, 204(1): 215-235. DOI:10.1093/gji/ggv441 |
Laske G, Masters G, Ma Z T, et al. 2013. Update on CRUST1.0-A 1-degree Global Model of Earth's Crust.//EGU General Assembly 2013. Vienna, Austria: EGU.
|
Lei J S, Zhao D P. 2005. P-wave tomography and origin of the Changbai intraplate volcano in Northeast Asia. Tectonophysics, 397(3-4): 281-295. DOI:10.1016/j.tecto.2004.12.009 |
Lei J S, Zhao D P. 2006. Global P-wave tomography:On the effect of various mantle and core phases. Physics of the Earth and Planetary Interiors, 154(1): 44-69. DOI:10.1016/j.pepi.2005.09.001 |
Lei J S, Xie F R, Lan C X, et al. 2008. Seismic images under the Beijing region inferred from P and PmP data. Physics of the Earth and Planetary Interiors, 168(3-4): 134-146. DOI:10.1016/j.pepi.2008.06.005 |
Lei J S, Zhao D P. 2009. Structural heterogeneity of the Longmenshan fault zone and the mechanism of the 2008 Wenchuan earthquake (MS8.0). Geochemistry Geophysics Geosystems, 10(10): Q10010. DOI:10.1029/2009GC002590 |
Lei J S, Xie F R, Fan Q C, et al. 2013. Seismic imaging of the deep structure under the Chinese volcanoes:An overview. Physics of the Earth and Planetary Interiors, 224: 104-123. DOI:10.1016/j.pepi.2013.08.008 |
Lei J S, Zhao D P, Xu Y G, et al. 2018. Is there a gap in the stagnant Pacific slab in the mantle transition zone under the Changbaishan volcano?. Acta Petrologica Sinica (in Chinese), 34(1): 13-22. |
Li J, Wang Q C. 2018. Relocation and focal mechanism of the Songyuan earthquake swarm sequence in 2013. Earthquake (in Chinese), 38(4): 62-73. |
Li K, Wang G S, Zhou Z M. 2015. Inorganic carbon dioxide gas reservoir formation in Changling Fault Depression, Songliao Basin. Petroleum Geology and Experiment (in Chinese), 37(4): 439-444. |
Li Y H, Wu Q J, Pan J T, et al. 2012. S-wave velocity structure of northeastern China from joint inversion of Rayleigh wave phase and group velocities. Geophysical Journal International, 190(1): 105-115. DOI:10.1111/j.1365-246X.2012.05503.x |
Liang S S, Lei J S, Xu Z G, et al. 2017. Relocation of the aftershock sequence and focal mechanism solutions of the 21 January 2016 Menyuan, Qinghai, MS6.4 earthquake. Chinese Journal of Geophysics (in Chinese), 60(6): 2091-2103. DOI:10.6038/cjg20170606 |
Liang S S, Lei J S, Xu Z G, et al. 2018. Relocation of aftershocks of the 2017 Jiuzhaigou, Sichuan, MS7.0 earthquake and inversion for focal mechanism of the mainshock. Chinese Journal of Geophysics (in Chinese), 61(5): 2163-2175. DOI:10.6038/cjg2018L0508 |
Liu J Q, Liu C, Lei J S, et al. 2017. The moment tensors of the 2013 Qianguo MS5.8 seismic swarm. Chinese Journal of Geophysics (in Chinese), 60(9): 3418-3431. DOI:10.6038/cjg20170912 |
Liu X B, Fu X F, Liu D M, et al. 2018. Distribution of mantle-derived CO2 gas reservoir and its relationship with basement faults in Songliao Basin, China. Journal of Natural Gas Science and Engineering, 56: 593-607. DOI:10.1016/j.jngse.2018.06.040 |
Liu Y N, Niu F L, Chen M, et al. 2017. 3-D crustal and uppermost mantle structure beneath NE China revealed by ambient noise adjoint tomography. Earth and Planetary Science Letters, 461: 20-29. DOI:10.1016/j.epsl.2016.12.029 |
Liu Z, Shan X L, Yi J, et al. 2017. Controlling effects on gas accumulation of volcanic reservoirs of Changling fault depression in Songliao Basin. Global Geology (in Chinese), 36(3): 880-888. |
Lu Y H, Wu Z Y, Ding G, et al. 2017. Upper crustal velocity structure in Qianguo M5.8 earthquake region. Journal of Jilin University (Earth Science Edition) (in Chinese), 47(6): 1894-1903. |
Masters G, Laske G, Bolton H, et al. 2000. The relative behavior of shear velocity, bulk sound speed, and compressional velocity in the mantle: implications for chemical and thermal structure.//Karato S I, Forte A, Liebermann A, et al eds. Earth's Deep Interior: Mineral Physics and Tomography from the Atomic to the Global Scale. Washington D C: Geophysical Monograph Series, 117: 63-87.
|
Montagner J P. 1986. Regional There-dimensional structures using long-period surface waves. Annales Geophysicae, 4(3): 283-294. |
Pan J T, Li Y H, Wu Q J, et al. 2014. 3-D S-wave velocity structure of crust and upper-mantle beneath the northeast China. Chinese Journal of Geophysics (in Chinese), 57(7): 2077-2087. DOI:10.6038/cjg20140705 |
Sabra K G, Gerstoft P, Roux P, et al. 2005a. Extracting time-domain Green's function estimates from ambient seismic noise. Geophysics Research Letters, 32(3): L03310. DOI:10.1029/2004GL021862 |
Sabra K G, Gerstoft P, Roux P, et al. 2005b. Surface wave tomography from microseisms in Southern California. Geophysics Research Letters, 32(14): L14311. DOI:10.1029/2005GL023155 |
Sambridge M. 1999a. Geophysical inversion with a neighbourhood algorithm-Ⅰ. Searching a parameter space. Geophysical Journal International, 138(2): 479-494. DOI:10.1046/j.1365-246X.1999.00876.x |
Sambridge M. 1999b. Geophysical inversion with a neighbourhood algorithm-Ⅱ. Appraising the ensemble. Geophysical Journal of the Royal Astronomical Society, 138(3): 727-746. DOI:10.1046/j.1365-246x.1999.00900.x |
Shao B, Shen J, Yu X H, et al. 2016. Seismic potential research along the north Fuyu fault in Songyuan city. China Earthquake Engineering Journal (in Chinese), 38(4): 616-623. |
Shapiro N M, Campillo M. 2004. Emergence of broadband Rayleigh waves from correlations of the ambient seismic noise. Geophysics Research Letters, 31(7): L07614. DOI:10.1029/2004GL019491 |
Shapiro N M, Campillo M, Stehly L, et al. 2005. High-resolution surface-wave tomography from ambient seismic noise. Science, 307(5715): 1615-1618. DOI:10.1126/science.1108339 |
Shen W S, Ritzwoller M H, Kang D, et al. 2016. A seismic reference model for the crust and uppermost mantle beneath China from surface wave dispersion. Geophysical Journal International, 206(2): 954-979. DOI:10.1093/gji/ggw175 |
Sheng S Z, Wan Y G, Wang X S, et al. 2017. Relocation of the 2013 Songyuan earthquake swarm in Jilin province and its seismogenic structure. Earth Science Frontiers (in Chinese), 24(2): 212-219. |
Tao K, Niu F L, Ning J Y, et al. 2014. Crustal structure beneath NE China imaged by NECESSArray receiver function data. Earth and Planetary Science Letters, 398: 48-57. DOI:10.1016/j.epsl.2014.04.043 |
Waldhauser F, Ellsworth W L. 2000. A double-difference earthquake location algorithm; Method and application to the Northern Hayward fault, California. Bulletin of the Seismological Society of America, 90(6): 1353-1368. DOI:10.1785/0120000006 |
Wan Y K, Shen J, Liu X, et al. 2016. The discovery and identification of activities of the Fuyubei fault in Songyuan. Earthquake Research in China (in Chinese), 32(3): 477-484. |
Wang J, Li C F, Lei J S, et al. 2016. Relationship between seismicity and crustal thermal structure in North China. Acta Seismologica Sinica (in Chinese), 38(4): 618-631. |
Wang J, Li C F. 2018. Curie point depths in Northeast China and their geothermal implications for the Songliao Basin. Journal of Asian Earth Sciences, 163: 177-193. DOI:10.1016/j.jseaes.2018.05.026 |
Wang J, Zhang G W, Li C F, et al. 2018. Correlating seismicity to Curie-point depths in the eastern margin of the Tibetan Plateau. Chinese Journal of Geophysics (in Chinese), 61(5): 1840-1852. DOI:10.6038/cjg2018M0130 |
Wang P J, Mattern F, Didenko N A, et al. 2016. Tectonics and cycle system of the Cretaceous Songliao Basin:An inverted active continental margin basin. Earth-Science Reviews, 159: 82-102. DOI:10.1016/j.earscirev.2016.05.004 |
Wang Q H, Xu W L. 2003. The deep process of formation and evolution of Songliao basin-Mesozoic volcanic rock probe. Journal of Jilin University (Earth Science Edition) (in Chinese), 33(1): 37-42. |
Weaver R L, Lobkis O I. 2004. Diffuse fields in open systems and the emergence of the Green's function (L). The Journal of the Acoustical Society of America, 116(5): 2731-2734. DOI:10.1121/1.1810232 |
Wei P S, Zhang J L, Zhang H Q, et al. 2008. The deep crust structure features of the Songliao Basin and their implications for the generation model of inorganic petroleum. Progress in Geophysics (in Chinese), 23(5): 1507-1513. |
Wei W, Xu J D, Zhao D P, et al. 2012. East Asia mantle tomography:New insight into plate subduction and intraplate volcanism. Journal of Asian Earth Sciences, 60: 88-103. DOI:10.1016/j.jseaes.2012.08.001 |
Wei W, Zhao D P, Xu J D, et al. 2015. P and S wave tomography and anisotropy in Northwest Pacific and East Asia:Constraints on stagnant slab and intraplate volcanism. Journal of Geophysical Research:Solid Earth, 120(3): 1642-1666. DOI:10.1002/2014JB011254 |
Wen Y, Wen H T, Zhang C X. 2007. Relocation of the moderate and small earthquake in Jilin area and Qian'an-Qianguo 5.0 earthquake sequence using the double difference location algorithm. Seismological Research of Northeast China (in Chinese), 23(1): 2-7. |
Wessel P, Smith W H F. 1995. New version of the generic mapping tools. EOS, Transactions American Geophysical Union, 76(33): 329. |
Wu W W, Yang J S, Su J R, et al. 2014. Moment inversion of moderate earthquakes and seismogenic environment in Qianguo-Qian'an source region, 2013, Jilin Province. Chinese Journal of Geophysics (in Chinese), 57(8): 2541-2554. DOI:10.6038/cjg20140815 |
Xue L F, Zhu M, Li W Q, et al. 2018. Earthquake triggered by "Magma Bubble" Bursting:2013 Songyuan earthquake clusters in Jilin as an example. Journal of Jilin University (Earth Science Edition) (in Chinese), 48(6): 1865-1875. |
Yang B J, Mu S M, Jin X, et al. 1996. Synthesized study on the geophysics of Manzhouli-Suifenhe Geoscience Transect, China. Chinese Journal of Geophysics (Acta Geophysica Sinica) (in Chinese), 39(6): 772-782. |
Yang G, Xue L F, Liu Z B, et al. 2001. Studies of deep geology with seismic section interpretation in Songliao basin. Oil & Gas Geology (in Chinese), 22(4): 326-330. |
Yang Y, Lei J S, Ai Y S, et al. 2019. Crustal structure beneath Northeast China from ambient noise tomography. Physics of the Earth and Planetary Interiors, 293: 106257. DOI:10.1016/j.pepi.2019.04.008 |
Yao H J, Van Der Hilst R D, De Hoop M V. 2006. Surface-wave array tomography in SE Tibet from ambient seismic noise and two-station analysis-Ⅰ. Phase velocity maps. Geophysical Journal International, 166(2): 732-744. DOI:10.1111/j.1365-246X.2006.03028.x |
Yao H J, Beghein C, Van Der Hilst R. 2008. Surface wave array tomography in SE Tibet from ambient seismic noise and two-station analysis-Ⅱ. Crustal and upper-mantle structure. Geophysical Journal International, 173(1): 205-219. DOI:10.1111/j.1365-246X.2007.03696.x |
Yin C H, Yang B Z, Cui Y Q. 2013. Study on the migration pathway of deep gas in Songliao basin. Geology of Chemical Minerals (in Chinese), 35(2): 84-90. |
Yuan Y, Yao H J, Qin Y. 2016. Joint inversion of Rayleigh wave vertical-horizontal amplitude ratios and dispersion based on the Neighborhood Algorithm and its application. Chinese Journal of Geophysics (in Chinese), 59(3): 959-971. DOI:10.6038/cjg20160318 |
Zhang G W, Lei J S, Xie F R, et al. 2011. Precise relocation of small earthquakes occurred in North China and its tectonic implication. Acta Seismologica Sinica (in Chinese), 33(6): 699-714. |
Zhang G W, Lei J S. 2013. Relocations of Lushan, Sichuan strong earthquake (MS7.0) and its aftershocks. Chinese Journal of Geophysics (in Chinese), 56(5): 1764-1771. DOI:10.6038/cjg20130534 |
Zhang H Y, Zhang G W, Wang X S, et al. 2015. Relocations of Qianguo earthquake sequence and its seismotectonic analysis. Earthquake Research in China (in Chinese), 31(3): 518-528. |
Zhang J L, Cao Z L, Yu J M. 2003. Discussion on the origin of dolomitization. Marine Origin Petroleum Geology (in Chinese), 8(1-2): 109-115. |
Zhang J L, Yu J M. 2004. Discussion on the mid-crust and its geological implication. Xinjiang Petroleum Geology (in Chinese), 25(1): 90-94. |
Zhao D P, Kanamori H, Negishi H, et al. 1996. Tomography of the source area of the 1995 Kobe earthquake:Evidence for fluids at the hypocenter?. Science, 274(5294): 1891-1894. DOI:10.1126/science.274.5294.1891 |
Zhao D P, Mishra O P, Sanda R. 2002. Influence of fluids and magma on earthquakes:seismological evidence. Physics of the Earth and Planetary Interiors, 132(4): 249-267. DOI:10.1016/S0031-9201(02)00082-1 |
Zhao D P. 2004. Global tomographic images of mantle plumes and subducting slabs:insight into deep Earth dynamics. Physics of the Earth and Planetary Interiors, 146(1-2): 3-34. DOI:10.1016/j.pepi.2003.07.032 |
Zhao D P, Tian Y, Lei J S, et al. 2009. Seismic image and origin of the Changbai intraplate volcano in East Asia:Role of big mantle wedge above the stagnant Pacific slab. Physics of the Earth and Planetary Interiors, 173(3-4): 197-206. DOI:10.1016/j.pepi.2008.11.009 |
Zheng X F, Ouyang B, Zhang D N, et al. 2009. Technical system construction of Data Backup Center for China Seismograph Network and the data support to researches on the Wenchuan earthquake. Chinese Journal of Geophysics (in Chinese), 52(5): 1412-1417. DOI:10.3969/j.issn.0001-5733.2009.05.031 |
Zheng X F, Yao Z X, Liang J H, et al. 2010. The role played and opportunities provided by IGP DMC of China National Seismic Network in Wenchuan Earthquake Disaster Relief and Researches. Bulletin of the Seismological Society of America, 100(5B): 2866-2872. DOI:10.1785/0120090257 |
Zheng Y, Shen W S, Zhou L Q, et al. 2011. Crust and uppermost mantle beneath the North China Craton, northeastern China, and the Sea of Japan from ambient noise tomography. Journal of Geophysical Research:Solid Earth, 116(B12): B12312. DOI:10.1029/2011JB008637 |
迟元林, 云金表, 蒙启安, 等. 2002. 松辽盆地深部结构及成盆动力学与油气聚集. 北京: 石油工业出版社: 143-192.
|
邓起东, 张培震, 冉永康, 等. 2002. 中国活动构造基本特征. 中国科学(D辑), 32(12): 1020-1030. |
韩江涛, 郭振宇, 刘文玉, 等. 2018. 松辽盆地岩石圈减薄的深部动力学过程. 地球物理学报, 61(6): 2265-2279. DOI:10.6038/cjg2018L0155 |
雷建设, 赵大鹏, 徐义刚, 等. 2018. 长白山火山下方地幔转换带中滞留的俯冲太平洋板块存在空缺吗?. 岩石学报, 34(1): 13-22. |
李君, 王勤彩. 2018. 2013年松原5级震群序列精定位、震源机制解及发震构造特征. 地震, 38(4): 62-73. DOI:10.3969/j.issn.1000-3274.2018.04.006 |
李贶, 王果寿, 周卓明. 2015. 松辽盆地长岭断陷无机成因CO2气成藏条件分析. 石油实验地质, 37(4): 439-444. |
梁姗姗, 雷建设, 徐志国, 等. 2017. 2016年1月21日青海门源MS6.4余震序列重定位和主震震源机制解. 地球物理学报, 60(6): 2091-2103. DOI:10.6038/cjg20170606 |
梁姗姗, 雷建设, 徐志国, 等. 2018. 2017年四川九寨沟MS7.0强震的余震重定位及主震震源机制反演. 地球物理学报, 61(5): 2163-2175. DOI:10.6038/cjg2018L0508 |
刘俊清, 刘财, 雷建设, 等. 2017. 2013年前郭MS5.8震群矩张量研究. 地球物理学报, 60(9): 3418-3431. DOI:10.6038/cjg20170912 |
刘哲, 单玄龙, 衣健, 等. 2017. 松辽盆地长岭断陷火山岩储层对天然气成藏的控制作用. 世界地质, 36(3): 880-888. DOI:10.3969/j.issn.1004-5589.2017.03.021 |
卢燕红, 吴兆营, 丁广, 等. 2017. 吉林前郭5.8级震区上地壳速度结构. 吉林大学学报(地球科学版), 47(6): 1894-1903. |
潘佳铁, 李永华, 吴庆举, 等. 2014. 中国东北地区地壳上地幔三维S波速度结构. 地球物理学报, 57(7): 2077-2087. DOI:10.6038/cjg20140705 |
邵博, 沈军, 于晓辉, 等. 2016. 松原市扶余北隐伏活动断裂地震潜势研究. 地震工程学报, 38(4): 616-623. DOI:10.3969/j.issn.1000-0844.2016.04.0616 |
盛书中, 万永革, 王晓山, 等. 2017. 2013年吉林松原震群重定位及其发震构造. 地学前缘, 24(2): 212-219. |
万永魁, 沈军, 刘峡, 等. 2016. 松原市扶余北断裂的发现及活动性鉴定. 中国地震, 32(3): 477-484. DOI:10.3969/j.issn.1001-4683.2016.03.004 |
王健, 李春峰, 雷建设, 等. 2016. 华北地区地震活动与地壳热结构关系研究. 地震学报, 38(4): 618-631. |
王健, 张广伟, 李春峰, 等. 2018. 青藏高原东缘地震活动与居里点深度之间的相关性. 地球物理学报, 61(5): 1840-1852. DOI:10.6038/cjg2018M0130 |
王清海, 许文良. 2003. 松辽盆地形成与演化的深部作用过程——中生代火山岩探针. 吉林大学学报(地球科学版), 33(1): 37-42. |
卫平生, 张景廉, 张虎权, 等. 2008. 松辽盆地深部地壳构造特征与无机油气生成模式. 地球物理学进展, 23(5): 1507-1513. |
温岩, 温洪涛, 张晨侠. 2007. 应用双差定位法对吉林区域中小地震及乾安-前郭5.0级地震余震的重新定位. 东北地震研究, 23(1): 2-7. DOI:10.3969/j.issn.1674-8565.2007.01.002 |
吴微微, 杨建思, 苏金蓉, 等. 2014. 2013年吉林前郭-乾安震源区中强地震矩张量反演与区域孕震环境研究. 地球物理学报, 57(8): 2541-2554. DOI:10.6038/cjg20140815 |
薛林福, 祝铭, 李文庆, 等. 2018. 岩浆泡破裂引发地震的模式:以吉林松原2013年地震群为例. 吉林大学学报(地球科学版), 48(6): 1865-1875. |
杨宝俊, 穆石敏, 金旭, 等. 1996. 中国满洲里-绥芬河地学断面地球物理综合研究. 地球物理学报, 39(6): 772-782. DOI:10.3321/j.issn:0001-5733.1996.06.007 |
杨光, 薛林福, 刘振彪, 等. 2001. 松辽盆地深部地震剖面解释与深部地质研究. 石油与天然气地质, 22(4): 326-330. DOI:10.3321/j.issn:0253-9985.2001.04.009 |
印长海, 杨步增, 崔永强. 2013. 松辽盆地深层天然气运移通道研究. 化工矿产地质, 35(2): 84-90. DOI:10.3969/j.issn.1006-5296.2013.02.004 |
袁艺, 姚华建, 秦岩. 2016. 基于邻域算法的瑞利面波垂直-水平振幅比及频散曲线联合反演及应用. 地球物理学报, 59(3): 959-971. DOI:10.6038/cjg20160318 |
张广伟, 雷建设, 谢富仁, 等. 2011. 华北地区小震精定位及构造意义. 地震学报, 33(6): 699-714. DOI:10.3969/j.issn.0253-3782.2011.06.001 |
张广伟, 雷建设. 2013. 四川芦山7.0级强震及其余震序列重定位. 地球物理学报, 56(5): 1764-1771. DOI:10.6038/cjg20130534 |
张洪艳, 张广伟, 王晓山, 等. 2015. 2013年吉林前郭5.8级震群精定位及发震构造分析. 中国地震, 31(3): 518-528. DOI:10.3969/j.issn.1001-4683.2015.03.007 |
张景廉, 曹正林, 于均民. 2003. 白云岩成因初探. 海相油气地质, 8(1-2): 109-115. |
张景廉, 于均民. 2004. 论中地壳及其地质意义. 新疆石油地质, 25(1): 90-94. DOI:10.3969/j.issn.1001-3873.2004.01.027 |
郑秀芬, 欧阳飚, 张东宁, 等. 2009. "国家数字测震台网数据备份中心"技术系统建设及其对汶川大地震研究的数据支撑. 地球物理学报, 52(5): 1412-1417. DOI:10.3969/j.issn.0001-5733.2009.05.031 |
 2019, Vol. 62


