 2019, Vol. 62


2. 中国科学院大学地球与行星科学学院, 北京 100049
2. College of Earth and Planetary Sciences, University of Chinese Academy of Sciences, Beijing 100049, China
所谓俯冲,即两个构造板块汇聚时,在其边界上发生的, 伴有板块消亡的地质过程,它是板块构造理论的重要内容之一.
针对该问题,学者们已进行了大量研究,具体的研究内容不尽相同,例如:俯冲的演化过程及其特征(Arcay et al., 2008; Han et al., 2016; Riel et al., 2017);俯冲过程相关的控制参数及物理化学反应(Jarrard, 1986; Zhong and Gurnis, 1994; Zhang and Wei, 2011; Fukao and Obayashi, 2013; Shi et al., 2017);俯冲的分类(Forsyth and Uyeda, 1979)等.尽管如此,俯冲相关的很多问题仍亟待解决,其中之一便是俯冲启动.俯冲启动是板块构造循环中的重要阶段(Toth and Gurnis, 1998),对该问题的深入研究,有助于更好地理解地球上在板块构造作用控制下发生的特殊的全球性动力学过程的形成与演化(Nikolaeva et al., 2010).
目前,学者们已采用地质学、地球物理学、实验室物理实验和数值模拟等多种技术手段对俯冲启动问题做了相当多的研究.Stern(2004)总结前人的研究成果,提出两种俯冲启动的概念模型:“自发型”和“诱发型”.其中,“自发型”是由于重力上不稳定的岩石层发生崩塌并下沉至软流层形成,俯冲初期弧前区域受到拉张作用,可以通过被动大陆边缘向俯冲的转化实现.该类模型可以通过收集俯冲带附近的岩石记录等地质学手段加以证明(Karig, 1982; Cloetingh et al., 1989; Niu et al., 2003).但是,由于俯冲记录的数量有限,且新生代以来缺乏类似转化过程的记录,难以使用数值模拟方法加以实现,与其相关的研究也十分有限(Hall et al., 2003; Nikolaeva et al., 2008; Marques and Kaus, 2016).“诱发型”则是在持续的板块汇聚作用下岩石层发生破裂形成,俯冲初期弧前区域受到挤压作用且发生抬升(Coos, 1993).这种俯冲启动的类型在自然界中则更为常见,自新生代以来的实例也相对较多,如穆绍海沟和所罗门群岛附近的俯冲等.因此,现今对俯冲启动进行的数值模拟多采用“诱发型”模型(Schellart and Moresi, 2013; Gerya et al., 2014).Toth和Gurnis(1998)使用数值模拟方法,对板块汇聚边界为倾斜断层的俯冲启动问题进行了研究.他们认为俯冲的初始需要两个条件,即板块汇聚速度大于10 mm·a-1, 并且断层面的剪切力与板块力应满足一定的条件.此外,海沟附近的地形变化主要受到板片下沉量的影响,其次还受到板片年龄、地幔黏滞系数和断层倾角的影响.Billen和Hirth(2005)则使用二维黏塑性球壳模型对上地幔流变性质的变化对俯冲启动的影响进行了研究.他们的研究表明,若使用牛顿流体,俯冲启动时俯冲板片较易发生平俯冲或者与上覆板块底部逐渐耦合;而非牛顿流体则更利于俯冲板片前沿下插至地幔,相对的俯冲角度也会更大.Nikolaeva等(2010)选择使用2D黏塑性流变的倾斜断层模型,探讨了被动大陆边缘转化为俯冲的问题,模拟的结果表明:大陆下地壳的塑性强度控制着稳定大陆边缘向逆掩断层结构的转变;这一转变的进一步进行则由大陆岩石层地幔的塑性强度和其与大洋岩石层地幔的密度差来控制,板片年龄仅是二级控制因素;另外,被动大陆边缘的俯冲启动要求上覆板块更薄且更热.Leng和Gurnis(2011)则是通过二维黏弹塑性的垂直断层模型对俯冲启动的影响因素进行了研究.他们的结论有:随着摩擦系数的增大和塑性软弱化速率的变化,模型演化出三种模式,即俯冲板片断裂的模式、俯冲板片连续并伴有弧后扩张的模式、以及俯冲板片连续但是无弧后扩张的模式.俯冲启动过程需要的板块汇聚量也从20 km增大到200 km.此外,如果引入应力边界条件代替速度边界条件,汇聚量会逐渐减小且弧后不产生扩张.
总结前人通过数值模拟方法对俯冲启动问题的研究,我们发现其更侧重于俯冲启动的力学条件和板块及地幔的流变性质.Buiter和Ellis(2016)提出影响数值模型中俯冲能否开启的关键因素有俯冲分界面的几何形状、俯冲分界面的强度和俯冲板块的流变性质.其中,关于分界面几何形状的研究相对容易被忽视,因此,本文选取前人已使用过的三种模型:倾斜型(模拟倾斜断层处的俯冲)、垂直型(模拟转换断层处的俯冲)和弯曲型(模拟俯冲启动前板块汇聚已产生弯曲变形的俯冲)作为初始模型,经过演化,对比各模型在俯冲过程中板块的运动规律及海沟深度的变化,探讨俯冲分界面几何形状的不同对俯冲过程的影响.
1 数值建模方法 1.1 控制方程本文的一系列数值模型均采用二维地球动力学数值算法“ASPECT”(Kronbichler et al., 2012)建立.同其他地球动力学数值模拟算法类似,该算法主要是解算动量、质量和热量三大守恒方程.
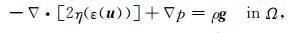
(1) 斯托克斯方程
|
(1) |
式(1)中,η是黏滞系数,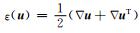
|
(2) |
式(2)中,ρ0是温度T=T0时的参考密度,T0为参考温度,α则表示热膨胀系数.
(2) 不可压缩流体物质守恒方程
|
(3) |
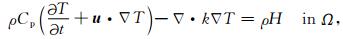
(3) 热量守恒方程
|
(4) |
式(4)中,Cp是等压热容,k是热导率,H是岩石的放射性生热率.
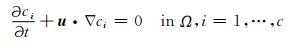
此外,为追踪模型中物质的运移,还应结合以下方程:
|
(5) |
ci表示发生输运的量,可以是不同的单元、矿物或其他产生对流的物质的组成,称为成分场.
1.2 黏-塑性流变性质ASPECT将地幔视为高黏度流体,因此本文采用了地球动力学领域常用的黏塑性流变准则(Billen and Gurnis, 2001; Lallemand et al., 2005; Eiler, 2013; Jadamec et al., 2013; Holt et al., 2015; Leng and Gurnis, 2015).其中,韧性流变的黏滞系数与温度、压力、物质组成和应变率密切相关,公式如下(Karato and Wu, 1993; Karato and Jung, 2003; Kronbichler et al., 2012):

|
(6) |
式(6)中,η是黏滞系数,A是前因子,n是应力指数,d是晶粒度,m是晶粒度指数,E是活化能,V是活化体积,R是气体常数,
(1) 黏性变形
由于假设扩散蠕变的黏滞系数与晶粒大小相关,与应变率无关,即令式(6)中m≠0,n=1,其黏滞系数的计算公式可写为:

|
(7) |
式(7)中,下标diff表示扩散蠕变.其余参数同上.
由于假设位错蠕变与晶粒大小无关,与应变率相关,即令式(6)中m=0, n>1,其黏滞系数的计算公式可改写为:

|
(8) |
式(8)中,下标disl表示位错蠕变.其余参数同上.
以上两种蠕变组合形式(comp)的黏滞系数参照式(9):

|
(9) |
由此,黏性应力定义为:

|
(10) |
ηdiff, disl, comp为视具体情况于公式(7)、(8)、(9)中,三者选其一.
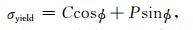
(2) 塑性准则
采用二维情况下的Drucker-Prager准则(同Mohr-Coulomb准则):
|
(11) |
式(11)中,σyield是屈服应力,C是内聚力,ϕ是内摩擦角.
应力屈服前后黏滞系数的计算公式如下:

|
(12) |
(3) 黏塑性流变最终的黏滞系数定义如下:

|
(13) |
式(13)中,可以根据需要定义合理的最大黏滞系数ηmax和最小黏滞系数ηmin,min(x, y)和max(x, y)分别代表在两个值x, y中取较小值和较大值.
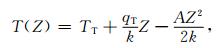
1.3 模型设计与参数设置为测试相关参数的设置我们建立一个参考模型,参见图 1.该初始模型长度为2000 km,深度为660 km.大陆板块上表面长度为1000 km,大洋板块为990 km,板块分界面为10 km宽的薄弱带,倾角为45°.两板块厚度均为104.5 km.大陆板块分成三部分,厚度20 km的上地壳,厚度为20 km的下地壳和余下的岩石层地幔部分;大洋板块同样分为三部分,厚度为4 km的沉积层,厚度为8 km的地壳和余下的岩石层地幔部分.边界条件的设置如下:上部为自由表面,左侧和底部边界可自由滑动,右边界可分为三部分,即上部100 km施加一向左的5 cm·a-1的速度边界条件,模拟板块持续的汇聚作用;深度200 km至660 km施以1.087 cm·a-1向右流出的速度边界条件,中间100 km为速度转换带.此外,我们对温度场也进行了初始设置.表面温度为0 ℃,莫霍面温度为600 ℃,板块底部温度为1300 ℃(Tetreault and Buiter, 2012).大陆的初始温度剖面参考典型的大陆地热温度结构公式(Chapman, 1986),如下:
|
(14) |
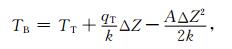
|
(15) |
|
(16) |

|
图 1 参考模型的初始设置,图中不同颜色表示不同的成分场 地幔的黏滞系数可通过相关参数(表 1)计算得到,这些参数由干橄榄岩(Hirth and Kohlstedt, 2003)的位错蠕变和扩散蠕变的流变实验获得.由此我们定义整个地幔的流变性质为位错和扩散蠕变相结合的形式,其他部分设置为位错蠕变. Fig. 1 Initial setups of the reference model. Colors mean different compositional fields Viscosity of mantle can be calculated from relevant parameters (Table 1). All these parameters come from rheological experiments on dislocation creep and diffusion creep of dry olivine (Hirth and Kohlstedt, 2003). We use a flow law of composite viscosity (dislocation and diffusion creep) in mantle, other parts are dislocation creep. |
|
|
表 1 数值模型的相关参数 Table 1 Relevant parameters of numerical model |
式(14)、(15)、(16)中,Z为深度,TT为顶部温度,qT是顶部热流,A是体积产热,TB是底部温度,qB是底部热流.
本文中使用的板块厚度为假设qT为平均大陆热流55 mW·m-2的前提下求得.大洋板块年龄为70 Ma,板块的温度剖面参考岩石层的冷却模型(Turcotte and Schubert, 2014)求得,如下:
|
(17) |
式(17)中,dZ表示板块厚度.
地幔中使用线性温度梯度0.25 ℃/km(Tetreault and Buiter, 2012),经计算可得模型底部温度约为1439 ℃.
本文研究的是两板块分界面几何形状对俯冲的影响,所以参考以上模型设置,我们又构建了两组形状的初始模型作为对比.示意图参见图 2.

|
图 2 垂直型分界面(a)和弯曲型分界面(b)模型示意图 图中,1是大陆板块,2是大洋板块,位于两板块之间的区域3是薄弱带,4是地幔.模型分层见参考模型(倾斜型). Fig. 2 Schematic diagram of vertical interface geometry (a) and bending interface geometry (b) models 1 Continental plate. 2 Oceanic plate. 3 Weak zone between two plates. 4 Mantle. Model layering is the same as the reference model (dipping model). |
本文主要构建了三种不同形状分界面的模型:倾斜型、垂直型和弯曲型.以下基于三种模型模拟的结果,探讨不同初始形状的俯冲分界面对俯冲板块演化和海沟移动规律产生的影响.
2.1 不同分界面形状对俯冲板块演化的影响结合图 3和图 4可知,在初始阶段,三种模型除分界面形状不同外,黏滞系数场基本一致.随着时间的推移,三种模型均发生了俯冲,但是俯冲板片的形状和俯冲角度却不尽相同.比较垂直型与弯曲型模型可以看出,虽然弯曲型模型的俯冲深度略深,倾角略小,俯冲板片前沿略锐化,两者在俯冲过程中俯冲板片的演化还是比较相似的.而倾斜型模型与以上两者相比则存在明显的不同.俯冲发生至5 Ma时,倾斜型模型的板片已经朝着俯冲板块前进的反方向发生了强烈的反卷,且随着俯冲的进行反卷程度逐渐加深,至10 Ma时近乎垂直下插至地幔,同时俯冲深度也更深,与垂直型和弯曲型模型相差约100 km.

|
图 3 不同几何形状,即倾斜型(a)、垂直型(b)和弯曲型(c)分界面的初始模型分别演化至5 Ma(d—f)和10 Ma(g—i)时的黏滞系数场 Fig. 3 Viscosity fields of subducting plates when their initial models with different geometries of interfaces evolve to some ages. (a) Dipping interface. (b) Vertical interface. (c) Bending interface. (d—f) 5 Ma. (g—i) 10 Ma |

|
图 4 倾斜型、垂直型和弯曲型三种分界面的初始模型在5 Ma和10 Ma时的板片形状和俯冲深度图黑色虚线标注了三种模型板片俯冲的深度. Fig. 4 Plate geometry and subducting depth when initial models with dipping, vertical and bending interfaces evolve to 5 Ma and 10 Ma Black dash lines denote subducting depths. |
板块分界面形状的差异除了对俯冲板片演化的过程产生上述影响外,还对海沟深度的变化产生影响.
由图 5可知,三种模型中海沟深度的变化既有相似性又存在差异.相似性在于:三种模型海沟深度的变化趋势极为相似,俯冲开始至约0.7 Ma之前海沟深度产生较为明显的增大,约0.7 Ma至1.5 Ma期间,海沟深度的变化经历了一个由抬升至下降的波动期,1.5 Ma之后形成了稳步的抬升.不同点在于:俯冲过程中海沟深度的变化不同,弯曲型模型最小,垂直型模型次之,倾斜型模型最大.将三种模型俯冲角度的变化由大到小进行排序可得:倾斜型>垂直型>弯曲型,结合图 5不难看出海沟深度的变化也依照此顺序逐渐加深.由此可知,俯冲倾角越大,海沟的深度也就越大.为验证以上俯冲倾角与海沟深度间的关系,从环太平洋的俯冲带中选取马里亚纳海沟、日本海沟和智利海沟三个实例,对比其相应的俯冲角与海沟深度的实测数据.图 6为利用etopo1数据绘制的环太平洋部分区域的水深图.

|
图 5 倾斜型、垂直型和弯曲型分界面模型中海沟深度的变化 Fig. 5 Trench depths in dipping, vertical and bending interface models |
从图 6可以看出日本—千岛海沟的深度自南向北逐渐加深,南北深度相差约4000 m,南部日本海沟平均深度约6000 m(刘梦雪等,2017).马里亚纳海沟则相反,其深度自南向北逐渐减小,南部最深处可到达11020 m,是目前所知最深的海沟(Huang and Zhao, 2006),此俯冲带呈现出典型的陡俯冲;而智利海沟南北相差不大,海沟的整体深度小于前两者,是平俯冲的典型实例.

|
图 6 环太平洋部分区域的水深图 (a)、(b)和(c)分别表示红色区域内的日本海沟(JT)、马里亚纳海沟(MT)和智利海沟(CT). Fig. 6 Bathymetric chart of part of the circum-Pacific region (a), (b) and (c) are Japan Trench (JT), Mariana Trench (MT) and Chile Trench (CT) in red areas, respectively. |
图 7是根据CMT (Centroid-Moment-Tensor,矩心矩张量)的数据(Ekström et al., 2012),并参考相关研究的统计数据(张克亮和魏东平,2011; Zhang and Wei, 2012)绘制的三个海沟相应剖面上的震源图,由CMT选取了1976年1月1日至2017年1月1日在该剖面附近纬度1°范围内的所有地震.从图中可以看出:三处俯冲带在浅部角度相近,约100 km以下逐渐产生差别,剖面2(马里亚纳海沟)的倾角最大,剖面1(日本海沟)的倾角略小于剖面2,剖面3(智利海沟)的倾角最小.该图与Fukao和Obayashi(2013)所做的相同区域附近层析成像的结果基本一致.

|
图 7 日本海沟、马里亚纳海沟和智利海沟选取的剖面的震源图 (三个剖面的位置分别见图 6a, 6b, 6c) Fig. 7 Hypocenters on profiles in Japan Trench, Mariana Trench and Chile Trench. Their locations are shown in Fig. 6 |
图 8为统计得到的日本海沟、马里亚纳海沟和智利海沟附近浅部俯冲角和俯冲岩石年龄数据.图 8a为0~100 km深度经计算得到的浅部俯冲角.整体看来,安第斯山(即智利型俯冲带)附近的俯冲倾角最小,其次为日本—千岛海沟,浅部俯冲角最大的是伊豆—小笠原—马里亚纳海沟.图 8b为150~400 km深度经计算得到的以上三个位置附近的俯冲角,图中数字表示采样点的纬度,基本符合图 8a有关俯冲角的规律,由深到浅依次为伊豆小笠原—马里亚纳海沟>日本千岛海沟>安第斯山附近海沟.

|
图 8 秘鲁—智利、伊豆—小笠原—马里亚纳和日本—千岛俯冲带俯冲板片(a)浅部俯冲角(0~100 km)和(b)深部俯冲角(150~400 km)(修改自Sdrolias and Müller, 2006) (b)图中数字表示纬度. Fig. 8 (a) Shallow slab dip (0~100 km) and (b) deep slab dip (150~400 km) of subduction at Peru-Chile, Izu-Bonin-Mariana and Japan-Kuril (modified from Sdrolias and Müller, 2006) Numbers in (b) denote latitudes. |
结合图 6、图 7和图 8可得,伊豆—小笠原—马里亚纳海沟、日本—千岛海沟和秘鲁—智利海沟的深度及板块俯冲倾角均依次减小,这与图 5模型模拟的结果是一致的.由此可以得到结论,俯冲角度越大,相应的海沟深度则越大.
3 结论与讨论本文使用有限元的数值模拟算法(ASPECT)研究了俯冲启动时不同形状(倾斜型、垂直型和弯曲型)的板块分界面对俯冲过程的影响.结果显示,分界面几何形状的不同,的确会对俯冲板块演化和海沟深度产生影响.
(1) 倾斜型俯冲:俯冲角度最大,俯冲深度最深,海沟深度最深,俯冲板片前沿形状随着板片的俯冲逐渐锐化而成近乎箭头形.
(2) 垂直型俯冲:俯冲角度次之,俯冲深度最小,海沟深度仅次于倾斜型俯冲,俯冲板片前沿形状在整个俯冲过程中几乎保持不变.
(3) 弯曲型俯冲:俯冲角度略小于垂直型,俯冲深度介于倾斜型和垂直型之间且略大于垂直型,海沟深度最小,俯冲板片前沿的锐化形状与倾斜型类似.
以上结果与环太平洋部分俯冲带内俯冲倾角与海沟深度变化的关系相类似,两者具有一定的相关性,即俯冲角度越平缓,海沟深度越小.不过,关于俯冲板块前沿的形状变化与俯冲深度之间,是否存在相关性等等,仍然需要进一步的数值模拟计算与分析.
本文的数值模型中,主要研究板块俯冲启动时断层倾角对俯冲形态的控制,并将之与现今发育比较成熟的俯冲带倾角与海沟深度进行了对比探讨.从板块俯冲演化的时间尺度来看,这种比较关系仍然存在不确定性;并且,本文建立的初始参考模型(图 1)中,主要针对大陆板块与大洋板块的俯冲过程,不过,马里亚纳海沟对应的则是洋-洋形态的板块俯冲,两者之间也存在一定程度的差别.因此,需要对此构建更为接近客观实际的数值模型进行模拟.
同时,参考相关文献资料,我们的计算模型将整个地幔设置成位错蠕变和扩散蠕变相结合的黏性流变,但是有学者指出,地震各向异性研究表明岩石层地幔上部200 km主要是位错蠕变,其余部分为扩散蠕变(Savage, 1999),因此将岩石层地幔设置为位错蠕变似乎更为合理(Tetreault and Buiter, 2012).此外,对比三组模型在俯冲过程中海沟移动的规律我们发现,倾角越小海沟后撤的距离反而越大,这与实际多少有些出入,其原因可能在于我们为了简化模型,将其深度仅设置为660 km,同时未考虑熔融作用,也未添加410 km和660 km间断面的作用等.此外,限于模型尺度问题,本文模型仅能研究660 km以内俯冲过程的演化,这些均是本文可以尝试进一步完善的地方.
致谢 感谢美国加利福尼亚大学戴维斯分校(UCDavis)的John Naliboff和Magali Billen教授对本文提出的诸多建议和给予的帮助,本文部分图件使用绘图工具Generic Mapping Tools (Wessel and Swith,2017)绘制.衷心感谢评审专家对文章修改所提出的宝贵意见和建议!
Arcay D, Lallemand S, Doin M P. 2008. Back-arc strain in subduction zones: Statistical observations versus numerical modeling. Geochemistry, Geophysics, Geosystems, 9(5): Q05015. DOI:10.1029/2007GC001875 |
Billen M I, Gurnis M. 2001. A low viscosity wedge in subduction zones. Earth and Planetary Science Letters, 193(1-2): 227-236. DOI:10.1016/S0012-821X(01)00482-4 |
Billen M I, Hirth G. 2005. Newtonian versus non-Newtonian upper mantle viscosity: Implications for subduction initiation. Geophysical Research Letters, 32(19): 312-321. DOI:10.1029/2005GL023457 |
Buiter S, Ellis S. 2016. A discussion of numerical subduction initiation. //EGU General Assembly Conference. Vienna Austria: EGU General Assembly.
|
Chapman D S. 1986. Thermal gradients in the continental crust. Geological Society, London, Special Publications, 24(1): 63-70. DOI:10.1144/GSL.SP.1986.024.01.07 |
Cloetingh S, Wortel R, Vlaar N J. 1989. On the initiation of subduction zones. Pure and Applied Geophysics, 129(1-2): 7-25. DOI:10.1007/BF00874622 |
Cloos M. 1993. Lithospheric buoyancy and collisional orogenesis: subduction of oceanic plateaus, continental margins, island arcs, spreading ridges, and seamounts. GSA Bulletin, 105(6): 715-737. DOI:10.1130/0016-7606(1993)105<0715:LBACOS>2.3.CO;2 |
Ekström G, Nettles M, Dziewonski A M. 2012. The global CMT project 2004-2010: Centroid-moment tensors for 13, 017 earthquakes. Physics of the Earth and Planetary Interiors, 200-201: 1-9. DOI:10.1016/j.pepi.2012.04.002 |
Forsyth D, Uyeda S. 1975. On the relative importance of the driving forces of plate motion. Geophysical Journal International, 43(1): 163-200. DOI:10.1111/j.1365-246X.1975.tb00631.x |
Fukao Y, Obayashi M. 2013. Subducted slabs stagnant above, penetrating through, and trapped below the 660 km discontinuity. Journal of Geophysical Research: Solid Earth, 118(11): 5920-5938. DOI:10.1002/2013JB010466 |
Gerya T, Stern R J, Baes M, et al. 2014. Dynamics and significance of plume-induced subduction initiation: Numerical modeling. //American Geophysical Union, Fall Meeting 2014. San Francisco, CA: AGU.
|
Gleason G C, Tullis J. 1995. A flow law for dislocation creep of quartz aggregates determined with the molten salt cell. Tectonophysics, 247(1-4): 1-23. DOI:10.1016/0040-1951(95)00011-B |
Hall C E, Gurnis M, Sdrolias M, et al. 2003. Catastrophic initiation of subduction following forced convergence across fracture zones. Earth and Planetary Science Letters, 212(1): 15-30. DOI:10.1016/S0012-821X(03)00242-5 |
Han P, Wei D P, Zhang K L, et al. 2016. Lattice-Preferred orientations of olivine in subducting oceanic lithosphere derived from the observed seismic anisotropies in double seismic zones. Earthquake Science, 29(4): 243-258. DOI:10.1007/s11589-016-0160-5 |
Hirth G, Kohlstedt D L. 2013. Rheology of the upper mantle and the mantle wedge: A view from the experimentalists. //Eiler J. Inside the Subduction Factory. Washington D C: American Geophysical Union, 83-105, doi: 10.1029/138GM06.
|
Holt A F, Buffett B A, Becker T W. 2015. Overriding plate thickness control on subducting plate curvature. Geophysical Research Letters, 42(10): 3802-3810. DOI:10.1002/2015GL063834 |
Huang J L, Zhao D P. 2006. High-resolution mantle tomography of China and surrounding regions. Journal of Geophysical Research: Solid Earth, 111(B9): 4813-4825. DOI:10.1029/2005JB004066 |
Jadamec M A, Billen M I, Roeske S M. 2013. Three-dimensional numerical models of flat slab subduction and the Denali fault driving deformation in south-central Alaska. Earth and Planetary Science Letters, 376: 29-42. DOI:10.1016/j.epsl.2013.06.009 |
Jarrard R D. 1986. Relations among subduction parameters. Reviews of Geophysics, 24(2): 217-284. DOI:10.1029/RG024i002p00217 |
Karato S I, Wu P. 1993. Rheology of the upper mantle: A synthesis. Science, 260(5109): 771-778. DOI:10.1126/science.260.5109.771 |
Karato S I, Jung H. 2003. Effects of pressure on high-temperature dislocation creep in olivine. Philosophical Magazine, 83(3): 401-414. DOI:10.1080/0141861021000025829 |
Karig D E. 1982. Initiation of subduction zones: Implications for arc evolution and ophiolite development. Geological Society, London, Special Publications, 10(1): 563-576. DOI:10.1144/GSL.SP.1982.010.01.37 |
Kronbichler M, Heister T, Bangerth W. 2012. High accuracy mantle convection simulation through modern numerical methods. Geophysical Journal International, 191(1): 12-29. DOI:10.1111/j.1365-246X.2012.05609.x |
Lallemand S, Heuret A, Boutelier D. 2005. On the relationships between slab dip, back-arc stress, upper plate absolute motion, and crustal nature in subduction zones. Geochemistry, Geophysics, Geosystems, 6(9): Q09006. DOI:10.1029/2005GC000917 |
Leng W, Gurnis M. 2011. Dynamics of subduction initiation with different evolutionary pathways. Geochemistry, Geophysics, Geosystems, 12(12): Q12018. DOI:10.1029/2011GC003877 |
Leng W, Gurnis M. 2015. Subduction initiation at relic arcs. Geophysical Research Letters, 42(17): 7014-7021. DOI:10.1002/2015GL064985 |
Liu M X, Wei D P, Shi Y N. 2017. Review on the opening and evolution models of the Japan Sea. Progress in Geophysics (in Chinese), 32(6): 2341-2352. DOI:10.6038/pg20170608 |
Marques F O, Kaus B J P. 2016. Speculations on the impact of catastrophic subduction initiation on the earth system. Journal of Geodynamics, 93: 1-16. DOI:10.1016/j.jog.2015.09.003 |
Naliboff J, Buiter S J H. 2015. Rift reactivation and migration during multiphase extension. Earth and Planetary Science Letters, 421: 58-67. DOI:10.1016/j.epsl.2015.03.050 |
Nikolaeva K, Gerya T, Marques F O. 2008. Numerical modelling of subduction initiation at passive margins.AGU Fall Meeting. AGU Fall Meeting Abstracts.
|
Nikolaeva K, Gerya T V, Marques F O. 2010. Subduction initiation at passive margins: Numerical modeling. Journal of Geophysical Research: Solid Earth, 115(B3): B03406. DOI:10.1029/2009JB006549 |
Niu Y, O′Hara M J, Pearce J A. 2003. Initiation of subduction zones as a consequence of lateral compositional buoyancy contrast within the lithosphere: A petrological perspective. Journal of Petrology, 44(11): 764-778. DOI:10.1093/petrology/44.5.851 |
Ranalli G. 1995. Rheology of the Earth. 2nd ed. London: Chapman & Hall.
|
Riel N, Capitanio F A, Velic M. 2017. Numerical modeling of stress and topography coupling during subduction: Inferences on global vs. regional observables interpretation. Tectonophysics, 746: 239-250. DOI:10.1016/j.tecto.2017.07.023 |
Rybacki E, Gottschalk M, Wirth R, et al. 2006. Influence of water fugacity and activation volume on the flow properties of fine-grained anorthite aggregates. Journal of Geophysical Research: Solid Earth, 111(B3): B03203. DOI:10.1029/2005JB003663 |
Savage M K. 1999. Seismic anisotropy and mantle deformation: What have we learned from shear wave splitting?. Reviews of Geophysics, 37(1): 65-106. DOI:10.1029/98RG02075 |
Schellart W P, Moresi L. 2013. A new driving mechanism for backarc extension and backarc shortening through slab sinking induced toroidal and poloidal mantle flow: Results from dynamic subduction models with an overriding plate. Journal of Geophysical Research: Solid Earth, 118(6): 3221-3248. DOI:10.1002/jgrb.50173 |
Sdrolias M, Müller R D. 2006. Controls on back-arc basin formation. Geochemistry, Geophysics, Geosystems, 7(4): Q04016. DOI:10.1029/95JB01869 |
Shi Y N, Wei D P, Li Z H, et al. 2017. Subduction mode selection during slab and mantle transition zone interaction: Numerical modeling. Pure and Applied Geophysics, 175(2): 529-548. DOI:10.1007/s00024-017-1762-0 |
Stern R J. 2004. Subduction initiation: Spontaneous and induced. Earth and Planetary Science Letters, 226(3-4): 275-292. DOI:10.1016/j.epsl.2004.08.007 |
Tetreault J L, Buiter S J H. 2012. Geodynamic models of terrane accretion: Testing the fate of island arcs, oceanic plateaus, and continental fragments in subduction zones. Journal of Geophysical Research: Solid Earth, 117(B8): B08403. DOI:10.1029/2012JB009316 |
Toth J, Gurnis M. 1998. Dynamics of subduction initiation at preexisting fault zones. Journal of Geophysical Research: Solid Earth, 103(B8): 18053-18067. DOI:10.1029/98JB01076 |
Turcotte D L, Schubert G. 2014. Geodynamics. Cambridge: Cambridge University Press.
|
Wessel P, Smith W H F. 2017. The Generic Mapping Tools (GMT) 4.5.0 Technical Reference and Cookbook. 16, 227.
|
Wilks K R, Carter N L. 1990. Rheology of some continental lower crustal rocks. Tectonophysics, 182(1-2): 57-77. DOI:10.1016/0040-1951(90)90342-6 |
Zhang K L, Wei D P. 2011. A kinematic thermal model for descending slabs with velocity boundary layers: A case study for the Tonga Subducting slab. Acta Geologica Sinica, 85(1): 211-222. DOI:10.1111/j.1755-6724.2011.00391.x |
Zhang K L, Wei D P. 2011. On the influence factors of double seismic zones. Chinese Journal of Geophysics (in Chinese), 54(11): 2838-2850. DOI:10.3969/j.issn.0001-5733.2011.11.014 |
Zhang K L, Wei D P. 2012. Correlation between plate age and layer separation of double seismic zones. Earthquake Science, 25(1): 95-101. DOI:10.1007/s11589-012-0835-5 |
Zhong S J, Gurnis M. 1994. Controls on trench topography from dynamic models of subducted slabs. Journal of Geophysical Research: Solid Earth, 99(B8): 15683-15695. DOI:10.1029/94JB00809 |
刘梦雪, 魏东平, 史亚男. 2017. 日本海的形成与演化模式综述. 地球物理学进展, 32(6): 2341-2352. DOI:10.6038/pg20170608 |
张克亮, 魏东平. 2011. 双地震带的影响因素探讨. 地球物理学报, 54(11): 2838-2850. DOI:10.3969/j.issn.0001-5733.2011.11.014 |