 2019, Vol. 62


2. 中南大学有色金属成矿预测与地质环境监测教育部重点实验室, 长沙 410083
2. Key Laboratory of Metallogenic Prediction of Nonferrous Metals and Geological Environment Monitoring, Ministry of Education(Central South University), Changsha 410083, China
高精度重力和磁法测量广泛地应用于地下岩石结构探测,地质勘探、水文地质监测和目标体定位等(Beres et al, 2001; Mochales et al, 2008; Ren et al., 2017a, 2017b; Tang et al., 2017, 2018).边界识别是其数据处理解释中的重要环节,可以提高资料的解释能力和质量,得到更加丰富、全面的地下地质信息.近年来,地球物理工作者研究了多种基于位场梯度的边界检测方法,这些方法按边界检测的计算模式,可分为导数分析和数理统计两类.
基于导数类的滤波方法已经成功应用于提高由小而浅的源产生的短波长异常.很多学者就此类方法进行了研究,提出了很多类型的边界识别方法,如水平梯度模(The horizontal gradient amplitude, HGA)(Grauch and Cordell, 1987; Fedi and Florio, 2001; Cooper and Cowan, 2007),总梯度方法(Roest et al., 1992),解析信号模法(Hsu et al., 1996; Beiki, 2010)以及张量曲率特征值法(Oruç et al., 2013; Beiki et al., 2014).其中,由Roest等(1992)提出来的总梯度方法是最受欢迎的方法之一,通常与3D解析信号振幅联系在一起.但是导数类方法的主要缺点是对噪声或者低质量数据表现较差,且在提高浅及深的物体产生的异常的能力很有限.继而在导数类分析的基础上,又发展了相位滤波方法,这类方法被用来提高由浅及深的物体产生的短波长和长波长的异常.其根本原因是相位为基于导数的比值,允许大和小振幅异常等价增强.这方面也有有很多学者进行了研究,比如倾斜角法(the tilt angle, Tilt) (Miller and Singh, 1994),倾斜角总水平梯度法(Verduzco et al., 2004), theta map法(Wijns et al., 2005),双曲倾斜角法(Cooper and Cowan, 2006)以及单演信号局部相位法(Hidalgo-Gato and Barbosa, 2015).在这些方法中,倾斜角法(Miller and Singh, 1994)因为理论成熟而被广泛使用.理论上来讲,这类可以克服导数类方法对边界增强的不足.但是,Santos等(2012)研究表明应用这类方法在处理近海位场数据时,低振幅异常可能被忽略掉.另外,当位场数据异常含有很高的噪声时,通过基于相位滤波方法的边界增强效果则不尽如人意.
基于数理统计法的边界识别方法主要有小子域滤波(张凤旭等,2007)、导数归一化标准差(Cooper, 2009)、均方差比归一化垂向梯度(王彦国等,2013)等方法.其中Cooper(2009)借助于异常导数的标准差,提出了可以检测不同深度地质体边界的归一化标准差法;王彦国等(2013)提出了基于位场垂向梯度最佳自比值的边缘检测技术;张恒磊等(2011, 2014)年提出了基于各向异性标准差的边缘检测方法,该方法实现了强、弱异常自适应检测,同时可以实现对微弱异常以及相邻叠加异常的边界识别.
鉴于目前大部分传统边界识别算法易受噪声干扰的影响,稳定性差,而图像边缘检测技术中的梯度极大值边缘检测具有原理简单,抗干扰能力强,稳定性好的优点,被广泛应用于图像处理领域(隋连升和王慧,2009),代表性的Facet模型算子检测结果不但具有定位精度高的优点,而且相比其他算子抑噪能力更好,在定位精度和抑制噪声上都有很大提高(宋建国等,2013).Facet模型算子是Haralick于1981年首次提出,该方法因其能在抑制噪声的同时提高边缘检测的精度而被广泛应用于图像处理中(Haralick, 1984).之后Zuniga和Haralick于1987(Zuniga and Haralick, 1987)年提出了综合梯度边缘检测算子,降低了噪声敏感性和评级偏差等方面具有很大的优越性.近年来,一些学者将其应用到地震数据处理中,如宋建国等(2013)对Facet模型算子进行能力归一化,将其应用到地震不连续性信息的边缘检测中,证明了Facet模型梯度属性边缘检测算子检测结果较方差梯度属性和Sobel梯度属性检测结果更为精细;刘海燕等(2017)基于Facet模型梯度算子一致性对地震数据不连续进行识别,也取得了良好的效果.
本文通过构造归一化改进的Facet模型曲面拟合算子,结合具有带通滤波器性质的尺度空间技术进行位场数据的边界识别,提高位场数据边界识别的辨识度和稳定性.文中通过无噪理论模型及加噪模型,对比分析不同导数阶次、不同尺度空间函数以及不同检测算子,验证该算法的有效性与稳定性,并应用到实际数据的处理,圈定了岩体的边界.
1 方法原理 1.1 尺度空间方法尺度空间方法将传统的单尺度视觉信息技术纳入尺度变化的动态分析框架中,更容易获得图像的本质特征(Felsberg and Sommer, 2004).本文将其引入到位场数据的边界识别中.假设一个非负的尺度参数h,定义尺度空间泊松函数fp(x, y),该函数为位场数据信号f(x, y)与泊松核函数的卷积(Felsberg and Sommer, 2004; Hidalgo-Gato and Barbosa, 2015):
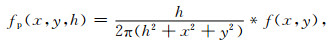
|
(1) |
式中
在波数域中,泊松尺度空间函数可以写成以下形式:
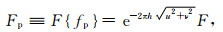
|
(2) |
上式等效于位场数据向上延拓过程,目的在于衰减或滤除与场源相关的噪声,这在一定程度上压制了噪声.F为fp的傅里叶变换,u和v分别为x和y方向的波数.并且尺度参数h控制了信号分辨率的程度.当h趋近于0,位场数据信号f(x, y)的尺度空间函数fp(x, y)越接近位场数据信号本身.而h的值越大,地质体结构的细节则越少,但并不改变数据的维数.这就意味着h的增加将导致尺度空间函数分辨率的降低.
为了增强低频和高频的特征,使用大尺度hc和小尺度hf泊松尺度参数组合成一个带通滤波器fbp(x, y),hc>hf>0.在波数域中,fbp(x, y)可以通过由两个尺度参数控制的两个泊松尺度函数之差来表示:
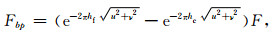
|
(3) |
公式(3)为位场信号f(x, y)通过带通滤波之后的泊松尺度空间函数,相当于信号在两个高度hf和hc上向上延拓结果之差.然后对公式(3)进行反傅里叶变换,便可得到空间域的尺度空间泊松函数fbp(x, y).
另外,hf和hc的单位应该与网格数据单位一致,其值将取决于源的性质和尺寸以及数据中包含的噪声的多少(Hidalgo-Gato and Barbosa, 2015, 2017),不同的模型其选择的值不一样.本文通过多次反复试验来完成,选取最优的结果.
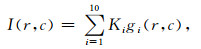
1.2 基于尺度空间技术的归一化Facet模型边界识别定义s为一个二维对称的局部邻域,fbp(r, c)表示局部邻域(r, c)∈s内的观测数据,邻域的大小为R×C.根据Facet模型算子的基本原理(Ji and Haralick, 2002),利用公式(4)所示的二元三次多项式对fbp(r, c)进行最小二乘拟合:
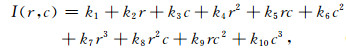
|
(4) |
其中,r和c是局部邻域s平面的坐标;ki(i=1, 2, …, 10)是拟合系数.
设{g1(r, c), g2(r, c), …, g10(r, c)}为一组2D离散正交多项式基函数,则拟合函数I可以表示为
|
(5) |
其中,Ki(i=1, 2, …, 10)为拟合系数,2D离散正交多项式基函数为
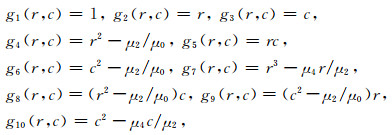
|
式中,
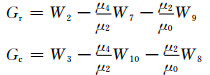
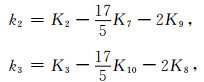
由公式(4)和(5),可得到拟合系数k2,k3与Ki的关系式:

|
(6) |
利用最小二乘法使目标函数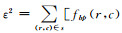

|
(7) |
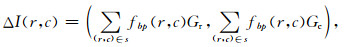
其中fbp(r, c)由公式(7)反傅里叶变换得到.由公式(7)可以看出,对于正交多项式拟合系数中的每一个Ki都可以由局部邻域中的数据fbp(r, c)单独线性表示,其对应的权值模板Wi可以表示为
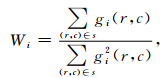
|
(8) |
由公式(4)可以看出,若要在邻域中心位置(0, 0)上求取I(r, c)的梯度幅值,只需要求得k2和k3.如公式(6)所示,ki可以用Ki线性表示,则k2和k3对应的卷积模板Gr和Gc可以由Ki的权值模板Wi线性表示:
|
(9) |
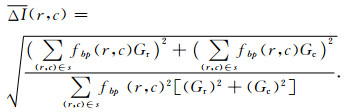
由公式(4)—(9)便可以得到邻域s中Facet模型梯度属性的计算公式:
|
(10) |
输出公式(10)的绝对梯度模值,并进行能量归一化,归一化后为式(11):
|
(11) |
值得注意的是卷积模板的大小直接影响到识别位置的定位精度及对噪声的压制效果.卷积模板越大,对噪声的压制效果越强,但所检测的位置宽度越大;卷积模板越小,对检测位置的定位越准确,但同时对噪声的压制效果会变差(隋连升和王慧,2009;刘海燕等,2017).因此需要针对数据质量,选择合适的卷积模板.一些学者研究了卷积模板大小对边缘检测的影响,其中隋连升和王慧(2009)通过研究表明:当卷积模板大小为5×5时,边缘检测的效果最优,漏检率和误检率最低;宋建国等(2013)和刘海燕等(2017)采用5×5的卷积模板对地震数据的不连续性进行检测,效果较好.在本文,我们也考虑采用5×5的卷积模板.
根据文献(Ji and Haralick, 2002),在大小为5×5的邻域中,令R={-2 -1 0 1 2}以及C={-2 -1 0 1 2},考虑2个一维离散的Chebyshev多项式集合构造,则公式(5)可以写成:

|
(12) |
由公式(6)和公式(9)可以写成如下形式:
|
(13) |

|
(14) |
将公式(14)代入公式(11),便可以得到卷积模板大小为5×5时能量归一化后的梯度模值.
2 理论模型分析 2.1 理论模型设计为了检验本文所提出的边界识别方法的效果,建立了如表 1所示的一组模型,假设在10×10 km、网格距为50×50 m的范围内分布四个棱柱体场源(图 1),其编号依次为A、B、C、D,其中A模型的剩余密度为正,B、C、D模型比较小,剩余密度为负,各异常体的顶、底埋深依次为1~2 km、0.4~0.5 km、0.5~0.7 km和0.4~0.5 km.卷积模板大小为5×5,设空间尺度因子为hf=0.4 km,hc=0.6 km.
|
|
表 1 模型1目标体参数说明表 Table 1 Physical and geometrical properties of bodies used in the synthetic model shown in Fig. 1 |

|
图 1 模型体平面示意图 Fig. 1 Top view of the synthetic model |
以重力模型为例,本文考虑两种情况:(1)不加噪声的情况;(2)在叠加的重力异常中加入异常峰值的3%的高斯噪声,计算的结果如图 2.从图 2可以看出,由于各异常体的相互影响,其产生的异常相互叠加,从重力异常图上很难分辨四个地质体的边界;加入3%的高斯噪声之后,四个地质体所形成的重力异常(图 2b)、重力垂向一阶导数(图 2c)和重力垂向二阶导数(图 2d)等值线均变的模糊不清,给边界识别增加了难度.

|
图 2 (a) 理论模型重力异常;加3%随机噪声: (b)重力异常;(c)重力异常一阶导数;(d)重力异常二阶导数 Fig. 2 Gravity response of the synthetic model as shown in Table 1 and Fig. 1 (a) Theoretical gravity anomaly data; (b) Gravity anomaly data contaminated with 3% Gaussian random noise with mean zero; (c) The first-order derivative; (d) The second-order derivative of (b). |
图 3为利用公式(11)处理重力异常、重力异常一阶导数、重力异常二阶导数的结果.从图中可以看出,基于尺度空间技术的归一化Facet模型重力异常垂向一阶、二阶导数边界识别的结果很清楚地提取了4个地质体的边界轮廓,并且基于垂向二阶导数的边界识别的效果要优于垂向一阶导数边界识别效果,更收敛于地质体的边界,紧缩较好.由此看出,对于基于尺度空间技术的归一化Facet模型边界识别方法而言,利用该模型的垂向二阶导数可以更精确地检测出地质体的边界.

|
图 3 无噪声情况下基于尺度空间技术的归一化Facet模型进行边界识别的结果 (a)重力异常;(b)重力异常一阶导数;(c)重力异常二阶导数. Fig. 3 The results of the normalized facet edge-detection filter with the scale-space representation on noise-free anomalies in Fig. 2a, for gravity anomaly (a), the first dervative (b) and the second order derivative (c) of gravity anomaly |
从图 4加入3%的高斯噪声本文边界识别方法计算结果中可以看出,虽然重力异常受到了噪声的影响,但本文方法所受高斯噪声影响较小,清晰地圈定了地质体的边界.其中基于尺度空间技术的归一化Facet模型重力异常检测比较好的反映了地质体A的边界,基于垂向一阶导数和二阶导数的检测均较好地识别了4个异常体的边界,并且重力异常垂向二阶导数边界识别的效果更好,可以更精确地检测出地质体的边界.由于泊松尺度空间技术的应用,抑制了随导数阶次增加噪声的放大作用.

|
图 4 加入3%的高斯噪声基于尺度空间技术的归一化Facet模型进行边界识别的结果 (a)重力异常;(b)重力异常一阶导数;(c)重力异常二阶导数. Fig. 4 The results of the normalized facet edge-detection filter with the scale-space representation on noise-corrupted anomalies in Fig. 2(b—d), for gravity anomaly (a), the first dervative (b) and the second order derivative (c) of gravity anomaly |
为了理解基于尺度空间技术的归一化Facet模型边界识别方法中带通滤波器的作用,利用模型1产生的含噪重力异常二阶导数,比较了三种不同方法的计算结果:(1)归一化Facet模型边界识别(图 5a);(2)采用公式(2)所示尺度空间函数进行基于归一化Facet模型的边界识别,h=0.4 km(图 5b);(3)采用公式(3)带通滤波尺度空间进行基于归一化Facet模型的边界识别,hf=0.4 km,hc=0.6 km(图 5c).从图中可以看出,采用公式(2)所得的尺度空间函数计算的Facet模型检测值可以反映地质体的边界,但是对深部地质的边界有所放大;比较而言,采用公式(3)所得到的结果更接近于实际边界.

|
图 5 基于不同尺度空间函数的归一化Facet模型边界识别方法计算结果 (a) Facet模型边界识别;(b)尺度空间归一化Facet模型边界识别(h=0.4 km);(c)带通滤波尺度空间归一化Facet模型边界识别(hf=0.4 km,hc=0.6 km). Fig. 5 The results of the normalized facet edge-detection filter using different scale-space representations on the noise-corrupted anomalies as shown in Fig. 2d (a) Facet edge-detection without scale-space technique; (b) Facet edge detection with Poisson scale-space representation (h=0.4 km); (c) Facet edge-detection with the band-pass filtered data (hf=0.4 km, hc=0.6 km) |
为了验证基于尺度空间技术的归一化Facet模型位场边界识别方法中Facet模型检测算子的效果,在这里引入方差属性算子和Sobel属性算子,具体计算表达式见附录A中公式(1)和(2).计算模型如表 1和图 1,卷积模板大小为5×5,空间尺度因子为hf=0.4 km,hc=0.6 km.同样利用模型1产生的含噪重力异常二阶导数,比较三种不同算子的识别效果.计算结果如图 6.

|
图 6 不同检测算子边界识别方法计算结果 (a)方差属性算子;(b) Sobel属性算子;(c) Facet模型算子. Fig. 6 The results of edge detection using different detection operators on the noise-corrupted anomalies in Fig. 2d. (a) The noramlized variance operator; (b) The normalized Sobel operator; (c) The normalized facet operator. |
从图 6中可以看出,基于三种检测算子的尺度空间边界识别方法均能较好的识别模型1中的4个地质体的边界,均能较好地压制噪声.对比分析可知,基于Facet模型算子的尺度空间边界识别方法较其他两种检测算子边界识别的结果冗余信息少、抗噪能力强,地质体边界反映更清晰.
2.5 不同边界识别方法对比为了对比本文算法与常规边界识别方法的效果,针对2.1节中的模型,首先采用总水平梯度模法(TDX)、倾斜角法(Tilt angle)、NSTD方法和Theta map四种传统方法对模型的重力异常进行计算,计算结果见图 7.本文的尺度空间归一化Facet模型边界识别方法计算结果见图 3.

|
图 7 无噪声常规边界识别方法计算结果 (a) TDX;(b) Tilt angle;(c) NSTD(窗口为5×5);(d) Theta map. Fig. 7 Edge detection results by the TDX (a), the tilt angle method (b), the NSTD method (c) and the theta map method (d) for gravity anomaly data as shown in Fig. 2(a) without noise |
从图 7可以看出,四种常规的方法均无法清晰的显示四个重力体的边界,并且随着地质体深度的增加,地质体的边界逐渐模糊.其中水平总梯度成功地的划定了最大幅值异常的边界,但是对于深度异常体的边界识别能力相当有限;Tilt方法可以大致地圈定浅部的三个小的异常体的中心位置,但是对地质体的边界反映不明显;Theta map比较清晰的给出了浅部三个异常体的边界位置,但是对A地质体的边界反映的比较粗糙;NSTD可以清晰地给出四个异常体的边界,优于其他三种方法识别的效果.图 7与图 3比较可知,基于尺度空间技术的Facet模型,利用重力异常垂向一阶、二阶导数进行的边界识别结果有效地圈定了异常体的边界,明显优于以上4种常规的边界识别方法.
3 实际数据分析为了验证基于尺度空间技术的归一化Facet模型位场边界识别方法对实测数据的处理效果,分别选取实测重力异常、航磁异常数据,进行了对比分析.
3.1 实测重力异常数据分析本例中,选取了Gooper于2008年在SEG网站上提供的重力异常的数据进行测试.图 8a展示了南非Witwatersrand Basin一个200 m×200 m区域的重力数据,网格距1.0 km×1.0 km.图 8(b—e)为常规方法边界识别的结果,图 8f为利用重力异常二阶导数本文算法边界识别的结果,其中hf=3.0 km,hc=4.0 km,卷积模板大小为5×5.

|
图 8 实测重力异常边界识别结果 (a)实测重力异常数据;(b) TDX;(c) Tilt angle;(d) NSTD(窗口为5×5);(e) Theta map;(f)基于尺度空间技术的归一化Facet模型重力异常垂向二阶导数边界识别. Fig. 8 (a) Gravity data over a portion of the Witwatersrand Basin, South Africa The grid interval is 1.0 km. (b) TDX of the data in (a), (c) tilt angle of the data in (a), (d) NSTD of the data in (a) (window size is 5×5), (e) theta map of the data in (a) and (f) the normalized Facet edge-detection filter with the scale-space representation of the data in the second-order derivative of (a), computed using equation 11 and 13 (hf=3.0 km, hc=4.0 km). |
从图 8(b—e)可以看出,TDX方法反映的边界比较模糊,基本看不出异常体的形态;NSTD法相比TDX方法、Tilt图和Theta map三种方法给出了更多的细节,突出了褶皱和断层.将图 8d中NSTD边界识别的结果与图 8f中基于尺度空间技术的归一化Facet模型利用垂向二阶导数边界识别的结果进行对比,可以看出,基于尺度空间技术和归一化Facet模型的垂向二阶导数边界识别的结果反映细节更清楚、更明显,突出了有用信息.
3.2 实测航磁异常数据分析本例中航磁资料来自原地矿部航空物探大队于1984年开展的铜陵地区航磁测量成果,为1: 5万经网格化的航磁数据,网格距为125 m×125 m.为使磁性体位置与磁异常位置对应,对航磁数据进行了化极处理.其中图 9a为网格化的航磁数据,图 9(b—e)为常规方法边界识别的结果,图 9f为利用航磁异常二阶导数本文算法边界识别的结果,其中hf=0.8 km,hc=0.9 km.

|
图 9 实测航磁异常边界识别结果 (a)实测航磁异常数据;(b) TDX;(c) Tilt angle;(d) NSTD(窗口为5×5);(e) Theta map;(f)基于尺度空间技术的归一化Facet模型航磁异常垂向二阶导数边界识别. Fig. 9 (a) Aeromagnetic data from the Tongling ore concentration area, China. (b) HGA of the data in (a), (c) tilt angle of the data in (a), (d) NSTD of the data in (a) (window size is 5×5), (e) theta map of the data in (a) and (f) the normalized Facet edge-detection filter with the scale-space representation of the data in the second-order derivative of (a), computed using equation 11 and 13 (hf=0.8 km and hc=0.9 km). |
由图 9(b—e)边界识别的结果可知:TDX方法和NSTD方法边界比较模糊,基本看不出异常体的形态;Tilt方法、Theta图法和本文所提检测方法的边界与实测资料显示的边界比较吻合,Theta图法的识别边界相对宽大;Tilt方法相对Theta图法,边界识别效果显著改善,边界更加细腻;而本文所提出的检测方法识别的结果相对于Tilt方法和Theta图法,又进一步得到改善,识别的主要异常体的边界更加细腻、收敛和封闭,该方法虽然使用了更高阶的垂向偏导数,但没有放大噪声.
基于尺度空间技术和归一化Facet模型的航磁异常二阶导数边界识别方法所圈定磁性异常体的边界(图 10)与严加永等(2009)和兰学毅等(2015)给出的铜陵矿集区岩体基本重合,特别是控制着铜官山矿田、狮子山矿田、凤凰山矿田、舒家店矿床的岩体.以凤凰山岩体为例(图 10中虚线框内),该岩体主要岩性为石英闪长岩和花岗闪长岩,这两种岩性在铜陵地区具有强磁性特征,从图 11a可以看出,本文的边界识别方法有效地圈定了磁性岩体的范围,并与兰学毅等(2015)所获得的3D岩体(图 11b)的主要边界基本吻合.上述分析说明,基于尺度空间技术和归一化Facet模型的航磁异常垂向二阶导数边界识别方法能够准确刻画航磁实测数据的主要边界,没有产生明显的额外边界,收敛性强,并有效地圈定了铜陵矿集区磁性岩体的边界.

|
图 10 实测航磁异常尺度空间归一化Facet模型边界识别结果 Fig. 10 The results of the normalized Facet edge-detection filter with the scale-space representation (equation 11) setting hf=0.8 km and hc=0.9 km on real aeromagnetic data (marked with red points) |

|
图 11 凤凰山岩体圈定对比图 (a)区域地质图;(b)三维形体分布图(兰学毅等,2015). Fig. 11 Geological map of the Lantau Peak intrusive marked with dashed lines in Fig. 10 (a) Regional geological map; (b) Intrusive map given by Lan et al. (2015). |
本文提出了一种基于尺度空间技术的归一化Facet模型位场边界识别方法,将归一化Facet模型与带通泊松尺度空间函数相结合,合理利用了重力异常高阶导数数据,更加清晰地刻画异常体的边界,均衡了深部和浅部异常体的边界.基于重力异常垂向二阶导数对本文算法涉及的尺度空间函数和检测算子进行了分析,表明:基于带通滤波尺度空间函数的归一化Facet模型检测方法可压制噪声和突出信号的高频和低频特征;归一化Facet模型算子较方差属性算子和Sobel属性算子抗噪能力更强,地质体边界反映更明显.通过与常规边界识别方法进行对比,表明基于尺度空间技术和归一化Facet模型的位场二阶导数边界识别方法能够有效的压制噪声干扰,增强高频和低频的异常,并且可以更加清晰地和精细地识别地质体的边界位置.
值得注意的是,本文仅考虑了卷积模板大小为5×5的卷积模板,并且通过反复试验来确定上延高度,如何选取合适的卷积模板大小和上延高度仍然值得继续深入研究.
致谢 感谢Gooper于2008年在SEG网站上提供的南非Witwatersrand Basin一个区域的重力异常实测数据,以及中国地质科学院严家永副研究员提供的航磁数据.
附录A 方差属性算子和Sobel属性算子
根据文献(宋建国等,2013),基于方差梯度属性的计算公式为
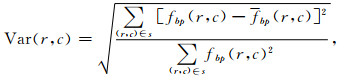
|
(A1) |
其中fbp(r, c)为窗口内所有位场数据的平均值.
基于Sobel梯度属性的计算公式为
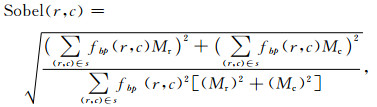
|
(A2) |
其中Mr和Mc代表Sobel模型算子两个正交方向模板.
Beiki M. 2010. Analytic signals of gravity gradient tensor and their application to estimate source location. Geophysics, 75(6): I59-I74. DOI:10.1190/1.3493639 |
Beiki M, Keating P, Clark D A. 2014. Interpretation of magnetic and gravity gradient tensor data using normalized source strength-A case study from McFaulds Lake, Northern Ontario, Canada. Geophysical Prospecting, 62(5): 1180-1192. DOI:10.1111/gpr.2014.62.issue-5 |
Beres M, Olivier R, Luetscher M. 2001. Integration of ground-penetrating radar and microgravimetric methods to map shallow caves. Journal of Applied Geophysics, 46(4): 249-262. DOI:10.1016/S0926-9851(01)00042-8 |
Cooper G R. 2009. Balancing images of potential-field data. Geophysics, 74(3): L17-L20. DOI:10.1190/1.3096615 |
Cooper G R J, Cowan D R. 2006. Enhancing potential field data using filters based on the local phase. Computers & Geosciences, 32(10): 1585-1591. |
Cooper G R J, Cowan D R. 2007. Enhancing linear features in image data using horizontal orthogonal gradient ratios. Computers & Geosciences, 33(7): 981-984. |
Fedi M, Florio G. 2001. Detection of potential fields source boundaries by enhanced horizontal derivative method. Geophysical Prospecting, 49(1): 40-58. DOI:10.1046/j.1365-2478.2001.00235.x |
Felsberg M, Sommer G. 2004. The monogenic scale-space:A unifying approach to phase-based image processing in scale-space. Journal of Mathematical Imaging and Vision, 21(1-2): 5-26. |
Grauch V J S, Cordell L. 1987. Limitations of determining density or magnetic boundaries from the horizontal gradient of gravity or pseudogravity data. Geophysics, 52(1): 118-121. DOI:10.1190/1.1442236 |
Haralick R M. 1984. Digital step edges from zero crossing of second directional derivatives. IEEE Transactions on Pattern Analysis and Machine Intelligence, 6(1): 58-68. |
Hidalgo-Gato M C, Barbosa V C F. 2015. Edge detection of potential-field sources using scale-space monogenic signal:Fundamental principles. Geophysics, 80(5): J27-J36. DOI:10.1190/geo2015-0025.1 |
Hidalgo-Gato M C, Barbosa V C F. 2017. The monogenic signal of potential-field data:A Python implementation. Geophysics, 82(3): F9-F14. DOI:10.1190/geo2016-0099.1 |
Hsu S K, Sibuet J C, Shyu C T. 1996. High-resolution detection of geologic boundaries from potential-field anomalies:An enhanced analytic signal technique. Geophysics, 61(2): 373-386. DOI:10.1190/1.1443966 |
Ji Q, Haralick R M. 2002. Efficient facet edge detection and quantitative performance evaluation. Pattern Recognition, 35(3): 689-700. DOI:10.1016/S0031-3203(01)00035-8 |
Lan X Y, Du J G, Yan J Y, et al. 2015. 3D gravity and magnetic interactive inversion modeling based on prior information:A case study of the Tongling ore concentration area. Chinese Journal of Geophysics (in Chinese), 58(12): 4436-4449. DOI:10.6038/cjg20151209 |
Liu H Y, Liu C, Wang D, et al. 2017. Seismic data discontinuity identification using coherence based on facet model gradient operator. Journal of Jilin University (Earth Science Edition) (in Chinese), 47(4): 1286-1294. |
Miller H G, Singh V. 1994. Potential field tilt-a new concept for location of potential field sources. Journal of Applied Geophysics, 32(2-3): 213-217. DOI:10.1016/0926-9851(94)90022-1 |
Mochales T, Casas A M, Pueyo E L, et al. 2008. Detection of underground cavities by combining gravity, magnetic and ground penetrating radar surveys:A case study from the Zaragoza area, NE Spain. Environmental Geology, 53(5): 1067-1077. DOI:10.1007/s00254-007-0733-7 |
Oruç B, Sertçelik I, Kafadar Ö, et al. 2013. Structural interpretation of the Erzurum Basin, eastern Turkey, using curvature gravity gradient tensor and gravity inversion of basement relief. Journal of Applied Geophysics, 88: 105-113. DOI:10.1016/j.jappgeo.2012.10.006 |
Ren Z Y, Chen C J, Pan K J, et al. 2017a. Gravity anomalies of arbitrary 3D polyhedral bodies with horizontal and vertical mass contrasts. Surveys in Geophysics, 38(2): 479-502. DOI:10.1007/s10712-016-9395-x |
Ren Z Y, Zhong Y Y, Chen C J, et al. 2017b. Gravity anomalies of arbitrary 3D polyhedral bodies with horizontal and vertical mass contrasts up to cubic order. Geophysics, 83(1): G1-G13. DOI:10.1190/geo2017-0219.1 |
Roest W R, Verhoef J, Pilkington M. 1992. Magnetic interpretation using the 3-D analytic signal. Geophysics, 57(1): 116-125. DOI:10.1190/1.1443174 |
Santos D F, Silva J B, Barbosa V C, et al. 2012. Deep-pass-An aeromagnetic data filter to enhance deep features in marginal basins. Geophysics, 77(3): J15-J22. DOI:10.1190/geo2011-0146.1 |
Song J G, Sun Y Z, Ren D Z. 2013. Edge detection technique based on structure-directed gradient attribute. Chinese Journal of Geophysics (in Chinese), 56(10): 3561-3571. DOI:10.6038/cjg20131031 |
Sui L S, Wang H. 2009. Edge detection algorithm based on facet model. Computer Engineering (in Chinese), 35(2): 187-189, 193. |
Tang J T, Hu S G, Ren Z Y, et al. 2017. Analytical formulas for underwater and aerial object localization by gravitational field and gravitational gradient tensor. IEEE Geoscience and Remote Sensing Letters, 14(9): 1557-1560. DOI:10.1109/LGRS.2017.2722475 |
Tang J T, Hu S G, Ren Z Y, et al. 2018. Localization of multiple underwater objects with gravity field and gravity gradient tensor. IEEE Geoscience and Remote Sensing Letters, 15(2): 247-251. DOI:10.1109/LGRS.2017.2784837 |
Verduzco B, Fairhead J D, Green C M, et al. 2004. New insights into magnetic derivatives for structural mapping. The Leading Edge, 23(2): 116-119. DOI:10.1190/1.1651454 |
Wang Y G, Zhang F X, Liu C, et al. 2013. Edge detection in potential fields using optimal auto-ratio of vertical gradient. Chinese Journal of Geophysics (in Chinese), 56(7): 2463-2472. DOI:10.6038/cjg20130732 |
Wijns C, Perez C, Kowalczyk P. 2005. Theta map:Edge detection in magnetic data. Geophysics, 70(4): L39-L43. DOI:10.1190/1.1988184 |
Yan J Y, Lu Q T, Meng G X, et al. 2009. Aeromagnetic 3D inversion imaging for intermediate-acid intrusive bodies and its indication significance of deep ore prospecting in Tongling ore concentration district. Mineral Deposits (in Chinese), 28(6): 838-849. |
Zhang F X, Zhang F Q, Liu C, et al. 2007. A technique for elaborate explanation of faulted structures:Three-directional small subdomain filtering. Chinese Journal of Geophysics (in Chinese), 50(5): 1543-1550. |
Zhang H L, Liu T Y, Yang Y S. 2011. Calculation of gravity and magnetic source boundary based on anisotropy normalized variance. Chinese Journal of Geophysics (in Chinese), 54(7): 1921-1927. DOI:10.3969/j.issn.0001-5733.2011.07.026 |
Zhang H L, Marangoni Y R, Zuo R G, et al. 2014. The improved anisotropy normalized variance for detecting non-vertical magnetization anomalies. Chinese Journal of Geophysics (in Chinese), 57(8): 2724-2731. DOI:10.6038/cjg20140830 |
Zuniga O A, Haralick R M. 1987. Integrated directional derivative gradient operator. IEEE Transactions on Systems, Man, and Cybernetics, 17(3): 508-517. DOI:10.1109/TSMC.1987.4309068 |
兰学毅, 杜建国, 严加永, 等. 2015. 基于先验信息约束的重磁三维交互反演建模技术——以铜陵矿集区为例. 地球物理学报, 58(12): 4436-4449. DOI:10.6038/cjg20151209 |
刘海燕, 刘财, 王典, 等. 2017. 基于Facet模型梯度算子一致性的地震数据不连续性识别方法. 吉林大学学报(地球科学版), 47(4): 1286-1294. |
宋建国, 孙永壮, 任登振. 2013. 基于结构导向的梯度属性边缘检测技术. 地球物理学报, 56(10): 3561-3571. DOI:10.6038/cjg20131031 |
隋连升, 王慧. 2009. 基于Facet模型的边缘检测算法. 计算机工程, 35(2): 187-189, 193. |
王彦国, 张凤旭, 刘财, 等. 2013. 位场垂向梯度最佳自比值的边界检测技术. 地球物理学报, 56(7): 2463-2472. DOI:10.6038/cjg20130732 |
严加永, 吕庆田, 孟贵祥, 等. 2009. 铜陵矿集区中酸性岩体航磁3D成像及对深部找矿方向的指示. 矿床地质, 28(6): 838-849. DOI:10.3969/j.issn.0258-7106.2009.06.012 |
张凤旭, 张凤琴, 刘财, 等. 2007. 断裂构造精细解释技术——三方向小子域滤波. 地球物理学报, 50(5): 1543-1550. DOI:10.3321/j.issn:0001-5733.2007.05.031 |
张恒磊, 刘天佑, 杨宇山. 2011. 各向异性标准化方差计算重磁源边界. 地球物理学报, 54(7): 1921-1927. DOI:10.3969/j.issn.0001-5733.2011.07.026 |
张恒磊, Marangoni Y R, 左仁广, 等. 2014. 改进的各向异性标准化方差探测斜磁化磁异常源边界. 地球物理学报, 57(8): 2724-2731. DOI:10.6038/cjg20140830 |