2. 中国地震局第一监测中心, 天津 300180
2. First Crust Monitoring and Application Center, China Earthquake Administration, Tianjin 300180, China
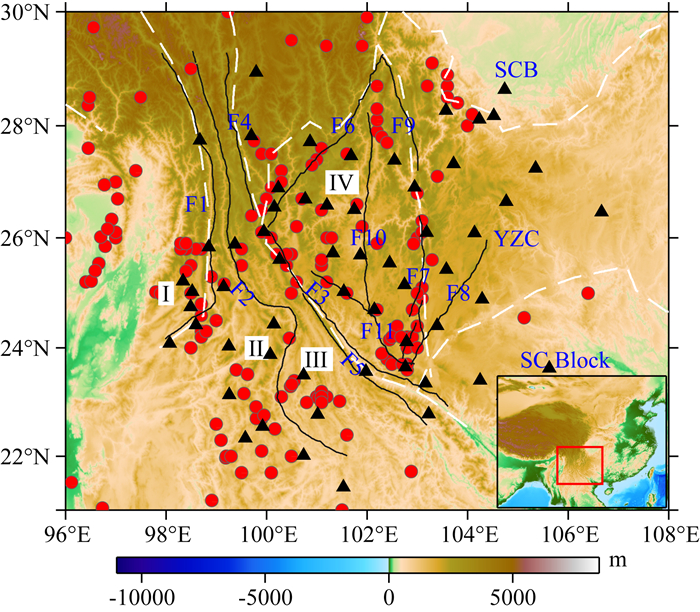
云南地区位于青藏高原东南缘, 受青藏高原隆升过程中高原物质侧向挤出作用, 形成了复杂的构造运动和强烈的构造变形.同时, 云南地区地处南北地震带南段, 众多大断裂纵横交错, 6级左右地震活动频发, 是中国大陆内部地震活动最强烈的地区之一(图 1), 一直都是地球科学研究的热点地区(吴建平等, 2001; 胡家富等, 2003; 何正勤等, 2004; 常利军等, 2006; Li et al., 2008; Huang et al., 2015).云南地区的地壳上地幔结构研究对于深入认识青藏高原的隆升演化机制、大陆板块内部物质流变性质和强震孕育构造背景等科学问题具有重要意义.
|
图 1 云南地区主要构造单元与地震台站 主要构造:SC Block, 华南地块; YZC, 扬子克拉通; SCB, 四川盆地; Ⅰ, 腾冲地块; Ⅱ, 保山地块; Ⅲ, 思茅地块; Ⅳ, 滇中地块.主要断层:F1, 怒江断裂; F2, 澜沧江断裂; F3, 红河断裂; F4, 金沙江断裂; F5, 哀牢山断裂; F6, 小金河断裂; F7, 小江断裂; F8, 弥勒断裂; F9, 则木河断裂; F10, 绿汁江断裂; F11, 楚雄—通海断裂.黑色三角形表示地震台站, 红色圆表示公元624—2014年云南及邻区M≥ 6.0的历史强震.颜色条表示海拔. Fig. 1 The major tectonic units and the seismic stations in Yunnan area Main tectonic units:SC Block, South China Block, YZC, Yangtze Craton; SCB, Sichuan Basin.Main active blocks:Ⅰ, Tengchong Block; Ⅱ, Baoshan Block; Ⅲ, Simao Block; Ⅳ, Dianzhong Block.Main faults:F1, Nujiang Fault; F2, Lancangjiang Fault; F3, Red River Fault; F4, Jinshajiang Fault; F5, Ailaoshan Fault; F6, Xiaojin River Fault; F7, Xiaojiang Fault; F8, Mile Fault; F9, Zemu River Fault; F10, Lüzhijiang Fault; F11, Chuxiong-Tonghai Fault.The black triangles represent the seismic stations.The red circles mark the locations of historical strong earthquakes (M≥ 6.0) from 624 AD to 2014.The color bar shows the elevation. |
在云南及其邻区开展了大量地壳上地幔速度结构研究, 如体波走时层析成像(Huang et al., 2002, 2015; Wang et al., 2003; 胥颐等, 2013), 面波层析成像(He et al., 2005; Yao et al., 2008; 潘佳铁等, 2015; Chen et al., 2016; Wu et al., 2016; Fu et al., 2017), 接收函数反演(吴建平等, 2001; 胡家富等, 2003; 李永华等, 2009a; Wang et al., 2010), 面波频散与接收函数联合反演(胡家富等, 2005; Li et al., 2008, 2016b, 2017; Wang et al., 2014; Bao et al., 2015).已有研究普遍认为青藏高原东南缘和云南地区存在中下地壳低速层.一些学者支持青藏高原中下地壳流模型, 认为云南地区可能存在青藏高原物质向东南流动的通道(Royden et al., 1997; Bao et al., 2015; Li et al., 2016b; Wu et al., 2016).类似地, 青藏高原东北部也同样被认为存在中下地壳低速流(Bao et al., 2013; Jiang et al., 2014; Li et al., 2014a, 2014c; Shen et al., 2015).Liu等(2014)认为青藏高原的东向扩张受刚性块体运动和地壳物质流动的共同作用.尽管如此, 一些学者则认为青藏高原东部虽然存在中下地壳低速层, 但是低速层分布不均匀, 受到深大断层的分割和围限, 不可能存在大规模的流动(Yao et al., 2008; Wang et al., 2010; Chen et al., 2014).关于云南地区中下地壳低速流的存在与否及其连通性目前还存在一定争议, 仍需要开展进一步研究.
大量研究证实在地球不同深度范围内均存在各向异性, 地壳上地幔各向异性研究已经成为推断大陆深部构造演化过程、动力学机制以及壳幔变形模式的重要手段(Hess, 1964; Montagner, 1986; 常利军等, 2006, 2008; 王椿镛等, 2007; 高原和吴晶, 2008).各向异性可分为两种:一种称为方位各向异性, 表现为同一种波沿不同方位的传播速度不同(Simons et al., 2002; Yao et al., 2010; 鲁来玉等, 2014; Chen et al., 2015, 2016; 余大新等, 2017; Ojo et al., 2018); 另一种称为径向各向异性, 表征为不同传播方向或偏振方向波的速度不同(Shapiro et al., 2004; 彭艳菊等, 2007; Chen et al., 2009; 李永华等, 2009b; Huang et al., 2010; Fu et al., 2015; 欧阳龙斌等, 2015; Guo et al., 2016; Li et al., 2016a; 吴珊珊等, 2018).对于有5个独立弹性参数的横向各向同性介质, 当对称轴垂直时, 只表现出径向各向异性; 当对称轴倾斜或水平时, 同时表现出方位各向异性和径向各向异性(彭艳菊等, 2007; Xie et al., 2013).S波分裂测量是探测地壳上地幔方位各向异性的常用方法, 具有较高的横向分辨率, 包括近震S波分裂(Shi et al., 2009, 2012)、远震Ps波分裂(Yang et al., 2015), 远震SKS(PKS)波分裂(常利军等, 2006; 王椿镛等, 2007).面波层析成像也是一种研究地壳上地幔各向异性结构的重要方法, 具有较好的垂向分辨率, 既可以用来反演各向方位各向异性结构, 也可以用来反演径向各向异性结构.通常可由Rayleigh波和Love波分别反演SV和SH波速度, 进而得到径向各向异性结构.除面波相速度(群速度)层析成像外, 还可以通过波形拟合(Chu et al., 2017)或体波走时层析成像(Wang and Zhao, 2013)反演径向各向异性结构.云南地区的三维径向各向异性结构对于了解的青藏高原的地球动力学问题具有重要意义.Huang等(2010)通过背景噪声层析成像得到青藏高原东南部的地壳径向各向异性结构, 发现丽江断裂西北部和小江、红河断裂附近的中下地壳主要呈现正径向各向异性(VSH>VSV), 推测可能和云母晶体水平排列有关, 正径向各向异性与低速层的一致性暗示了云母的水平排列与地壳深部物质的流动有关.Xie等(2013)反演得到青藏高原东部和扬子克拉通的地壳径向各向异性结构, 除了发现青藏高原东部的中地壳主要呈现正径向各向异性外, 还发现在一些地区的上地壳中存在负径向各向异性(VSH < VSV), 推测负径向各向异性是由于裂隙或断层的近垂直排列导致的.目前云南地区的径向各向异性研究尚不系统, 还缺乏上地幔顶部的结构信息, 有必要进一步开展工作.
本文利用云南及其邻区的固定地震台站记录的天然地震数据, 提取了12~60 s的Rayleigh波和Love波相速度频散, 通过面波层析成像得到不同周期的相速度分布, 进一步反演得到10~100 km的SV和SH波速度, 并计算了径向各向异性强度.最后, 结合云南地区的三维S波速度与径向各向异性结构模型, 探讨了该地区的地球动力学问题和强震构造背景.
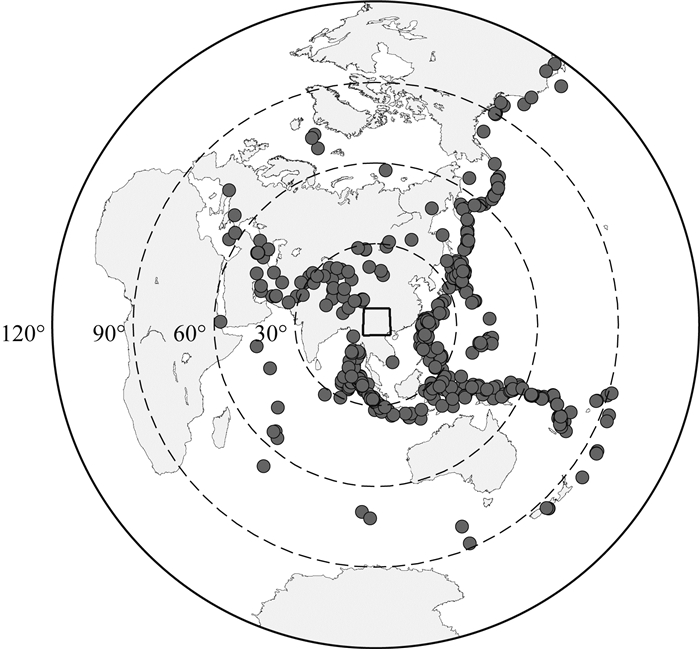
1 数据本文使用了云南数字地震台网以及部分贵州数字地震台网和四川数字地震台网共59个台站记录的天然地震数据(图 1; 国家测震台网数据备份中心, 2007; 郑秀芬等, 2009), 数据的时间范围为2010年1月至2012年12月.地震仪的类型包括CMG-3ESP-60, BBVS-60, CTS-1和KS-2000M-60, 频带均为50 Hz~60 s.挑选的地震事件震级为5.0~7.5级, 震源深度小于50 km, 相对于台网中心的震中距为10°~120°(图 2).所有地震事件数据均经过了去均值、去线性趋势和去仪器响应处理.
|
图 2 地震分布图 黑色圆表示地震位置, 数字表示相对地震台网中心的距离, 共有633个地震. Fig. 2 The distribution of events The small box in the center denotes the study area.The black circles denote the epicenters of the events, and the digits indicate the distances from the center of the array.633 events are used in this study. |
对于Rayleigh波, 通常使用垂直Z分量数据, 而Love波需要使用切向T分量数据.为得到Love波, 需要将N和E分量数据旋转为R分量和T分量.Love波数据的准确性受到地震仪水平分量方位角偏差的影响.Niu和Li(2011)发现中国数字地震台网中有近三分之一的台站存在较大的水平分量方位角偏差(>8°), 并有一些台站极性相反或者分量混淆.此后, 中国地震局对国家地震台网、区域地震台网的仪器进行了重新定向, 整个工作的完成时间大概是在2011年左右, 部分区域的完成时间稍晚.Niu和Li(2011)使用的数据时间范围为2007年7月—2008年8月, 而本文使用的数据时间范围为2010年1月至2012年12月, 一些地震台站的问题可能已经得到修正.因此, 不能直接使用Niu和Li(2011)的结果对于地震数据进行校正.首先, 参考Niu和Li(2011)结果, 本文对于可能存在极性相反和分量混淆的台站进行了分析, 并对相应数据进行了校正.接下来, 类似于Niu和Li(2011)提出的信噪比加权-多地震方法(SNR-weighted-multi-event method), 本文采用最小能量法对单个远震事件P波进行偏振分析, 测量N分量数据的方位角偏差(假定N和E分量正交), 并对多个事件的测量结果进行信噪比加权平均.极性相反、分量混淆或N分量方位角偏差大于8°的台站见表 1.可以看出, 一些台站的分量问题在只存在一定的时间段内, 推测是经过了人工校正, 还有一些台站一直存在问题.此后, 根据水平分量方位角偏差测量结果, 对水平分量数据进行校正.最后, 将N和E分量旋转成R和T分量, 分别用Z和T分量数据测量Rayleigh波和Love波相速度频散.
|
|
表 1 存在方向错误的地震台站 Table 1 The misoriented seismic stations |
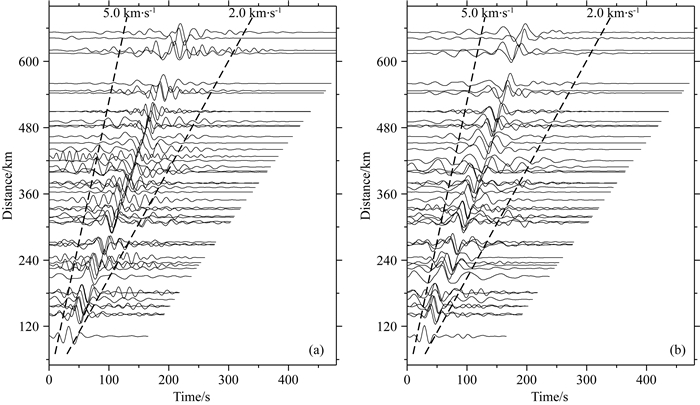
为了得到高质量的地震数据, 我们根据面波信噪比筛选数据, 设定最小信噪比为5.0.为了减少体波、高阶面波对于频散测量的影响, 对数据进行了相位匹配滤波, 提取基阶面波.进行相位匹配滤波需要选择一条参考群速度频散.自动时频分析程序AFTAN(Ritzwoller, 2013)是广泛使用的频散测量程序, 可以得到高精度的频散曲线.对于同一地震, 采用AFTAN程序计算了所有台站的单台群速度频散曲线, 计算平均的群速度频散曲线, 并以平均的频散曲线为参考进行相位匹配滤波.最后, 挑选近似在同一个大圆弧上的地震台站对, 双台间距最小值设定为100 km, 较近的台站震中距为10°~120°.通过双台波形互相关, 得到台站对间的互相关函数; 当存在多个互相关函数时, 进行归一化并叠加.对于Rayleigh波, 平均每个台站对使用了7.5个地震事件的互相关函数进行叠加; 对于Love波, 平均每个台站对使用了6.9个地震事件的互相关函数进行叠加.丽江台的互相关波形如图 3所示, 可以看到清晰的Rayleigh波和Love波信号, 且Love波的速度要高于Rayleigh波.对于叠加的互相关函数, 采用AFTAN程序测量相速度频散, 并设定双台间距大于1倍波长.对于第一次频散测量, 使用AK135模型(Kennett et al., 1995)计算的理论相速度频散作为参考频散, 并计算得到云南地区平均的Rayleigh波和Love波相速度频散.之后分别使用平均的Rayleigh波和Love波频散作为参考频散, 再一次测量Rayleigh波和Love波相速度频散.为了保证频散曲线的可靠性, 对于频散曲线进行了人工筛选, 剔除了明显错误或者不光滑的频散曲线.对于同一周期, 删除了两倍中误差外的频散数据.
|
图 3 丽江台与其他台站的互相关波形 (a)垂直分量波形; (b)切向分量波形.图中波形为多地震叠加波形, 纵轴代表台站间距.两条虚线分别表示速度5.0和2.0 km·s-1的走时线. Fig. 3 The cross-correlation waveforms of Lijiang station and other stations (a) Vertical component waveforms; (b) Tangential component waveforms.The waveforms are stacked from multi-events, and the vertical axis is the interstation distance.The two dashed lines show the travel time curves with speed of 5.0 and 2.0 km·s-1. |
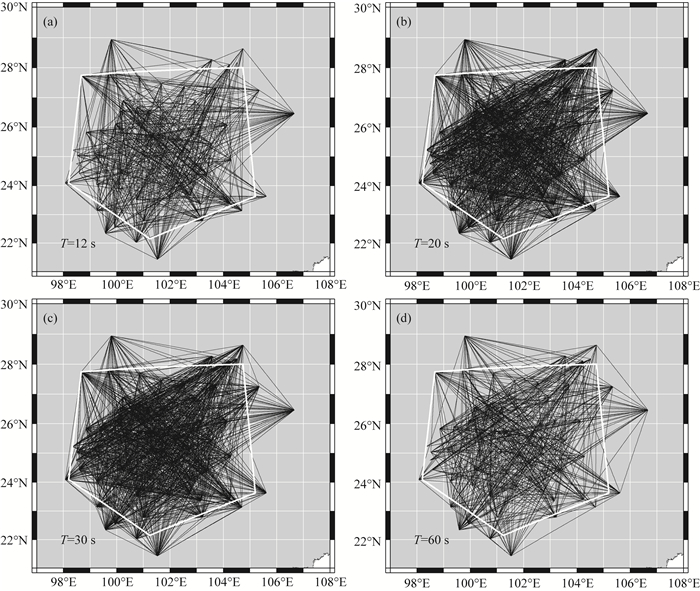
对于远震面波, 短周期面波的能量衰减较快, 难以提取10 s周期以下的频散曲线(潘佳铁等, 2011; Soomro et al., 2016).本文结果表明10和11 s的射线数比较少, 因此选择了最小周期为12 s; 同时考虑到地震仪的频带上限为60 s, 本文提取了12~60 s的Rayleigh波和Love波相速度频散.Rayleigh波射线覆盖如图 4所示, 可以看出:除边缘地区外, 研究区的射线覆盖都比较好; 20~30 s的射线更加密集, 与这个周期范围内面波能量较强有关.Love波的射线覆盖与Rayleigh波基本一致, 本文不再进行展示.为了保证结果的可靠性, 本文只展示射线覆盖较好区域(图 4白色多边形区域)内的成像结果.
|
图 4 研究区12、20、30和60 s周期Rayleigh波射线覆盖 白色多边形表示射线覆盖较好的区域, 在本文只展示多边形内部的成像结果.12、20、30和60 s的Rayleigh波射线数量分别为548、1195、1185和506, 对应周期的Love波射线数量分别为597、1123、1130和490.Rayleigh波与Love波的射线覆盖特征基本一致. Fig. 4 The path coverage of Rayleigh waves at 12, 20, 30 and 60 s periods In each figure, the white polygon denotes the area with good path coverage.In this study, we only show the tomography results in the polygon.The numbers of Rayleigh wave paths at 12, 20, 30, and 60 s period are 548, 1195, 1185, and 506, respectively.The numbers of Love wave paths at 12, 20, 30, and 60 s period are 597, 1123, 1130, and 490, respectively.The path coverage of Love waves is similar as that of Rayleigh waves. |
本文使用了基于连续函数的广义最小二乘反演方法进行面波相速度层析成像(Tarantola and Valette, 1982; Tarantola and Nercessian, 1984; Montagner, 1986).使用该反演方法, 需要选择合适的相关长度L和先验模型误差σm0(Montagner, 1986; Yao et al., 2008; Liu and Yao, 2017).相关长度L相当于空间平滑因子, 对应的空间分辨为2L.L的选择需要考虑射线覆盖和波长.从光学的观点, 即使射线非常密集, 也无法精确反演尺度小于一个波长的异常, 因此L的最小值为半个波长(0.5λ).为了防止在短周期出现小尺度虚假异常, 我们设定L=max[50 0.5λ].先验模型误差σm0控制了模型的分辨, 选择较大的先验模型误差, 可以提高反演模型的分辨, 但是后验模型误差也随之增加.因此, 需要在模型的分辨和误差之间取一定的折中.考虑到相速度频散测量误差通常为1%左右, 相速度层析成像可接受的后验模型误差为1%.本文经过多次测试后得到合适的先验模型误差, 可以保证大部分区域内的后验模型误差小于1%.最后, 我们得到了12~60 s周期的Rayleigh波和Love波相速度分布.
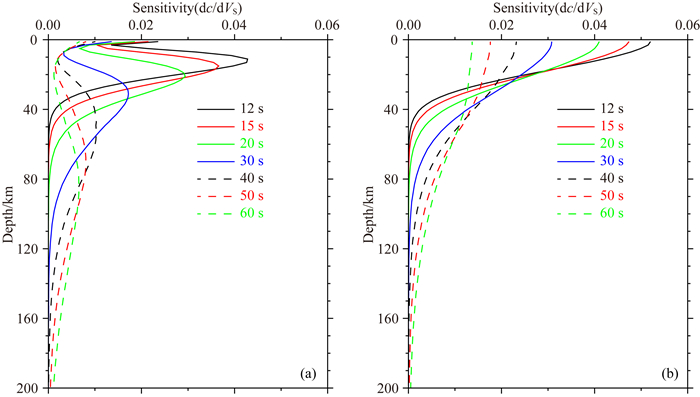
通过相速度层析成像, 可以得到研究区每个点的纯路径频散.本文将研究区划分为0.3°×0.3°网格, 利用每个点的纯路径频散, 采用线性迭代反演方法反演一维S波速度结构(Herrmann and Ammon, 2004).为了保证反演的稳定性, 对于每一次线性反演, 采用阻尼最小乘法求解法方程.Rayleigh波和Love波的相速度敏感核明显不同(图 5).Rayleigh波主要对于1/3到1/2波长深度范围内的S波速度结构敏感(Li et al., 2009), 而Love波相对于Rayleigh波对于浅部结构更为敏感(Li et al., 2009; 欧阳龙斌等, 2015; 图 5).60 s的Rayleigh波相速度主要对于80~120 km的S波速度结构比较敏感, 而60 s的Love波相速度在100 km以下的敏感核较小.对于本文数据, 能够较为可靠地反演10~100 km深度的S波速度结构.
|
图 5 基阶面波相速度敏感核 (a) Rayleigh波相速度敏感核; (b) Love波相速度敏感核. Fig. 5 Phase velocity sensitivity kernels of fundamental mode Rayleigh wave (a) and Love wave (b) |
进行线性迭代反演, 需要设置合适的初始模型.我们将地壳均分为3层, 莫霍面~100 km均分为6层, 100 km以下地层厚度为10 km.地壳中的初始速度源自CRUST1.0模型(Laske et al., 2013), 莫霍面以下使用的为AK135模型(Kennett et al., 1995), 地壳厚度源自Li等(2014b)得到的中国大陆接收函数地壳厚度模型.反演中只有S波速度参与反演, VP/VS固定, 密度ρ由Nafe-Drake公式计算得到(Herrmann and Ammon, 2004; Brocher, 2005).通过线性反演, 得到每个网格点的一维S波速度结构, 最后组成研究区的三维地壳上地幔SV和SH波速度结构模型.定义径向各向异性强度为γ=2(VSH-VSV)/(VSH+VSV)×100%(Huang et al., 2010; Ojo et al., 2017).
3 相速度分布为了检验相速度层析成像的可靠性, 我们进行了检测板实验.如图 6所示, 设计了1.0°×1.0°和2.0°×2.0°的检测板.对于12、20和30 s的Rayleigh波, 在射线覆盖较好的区域, 可以非常好地反演1.0°×1.0°的检测板; 而对于60 s的Rayleigh波, 可以较好地恢复2.0°×2.0°的检测板.Love波的检测板实验结果与Rayleigh波基本一致, 12、20和30 s的分辨可达1.0°×1.0°, 60 s的分辨可达2.0°×2.0°.需要注意的是, 对于60 s周期的面波射线覆盖, 如果不考虑物理上的可能性, 仅从几何射线的角度, 可以较好地恢复1.0°×1.0°的检测板.然而, 从地震波场的角度, 60 s周期面波的难以达到1.0°×1.0°分辨.

|
图 6 检测板实验 (a)和(b)分别为1°×1°和2°×2°的检测板, (c)、(d)、(e)和(f)分别为12、20、30和60 s的Rayleigh波检测板实验结果。红色五角星表示主要城市:ZD, 中甸(香格里拉); LJ, 丽江; PZH, 攀枝花; ZT, 昭通; BS, 保山; KM, 昆明; QJ, 曲靖; PE, 普洱; WS, 文山. Fig. 6 Checkerboard tests (a) and (b) are the checker board models with resolution of 1.0°×1.0°, and 2.0°×2.0°.(c)—(f), checkerboard test results of Rayleigh waves at 12, 30, 30 and 60 s periods.The red stars denotes the main cities:ZD, Zhongdian (Xianggelila); LJ, Lijiang; PZH, Panzhihua; ZT, Zhaotong; BS, Baoshan; KM, Kunming; QJ, Qujing; PE, Puer; WS, Wenshan. |
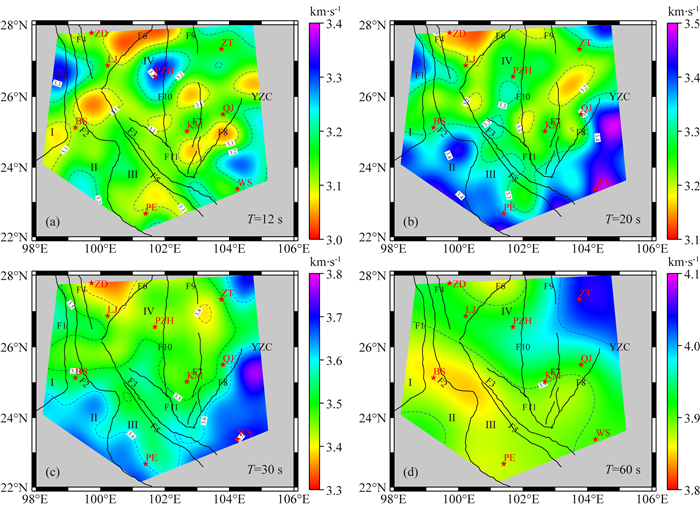
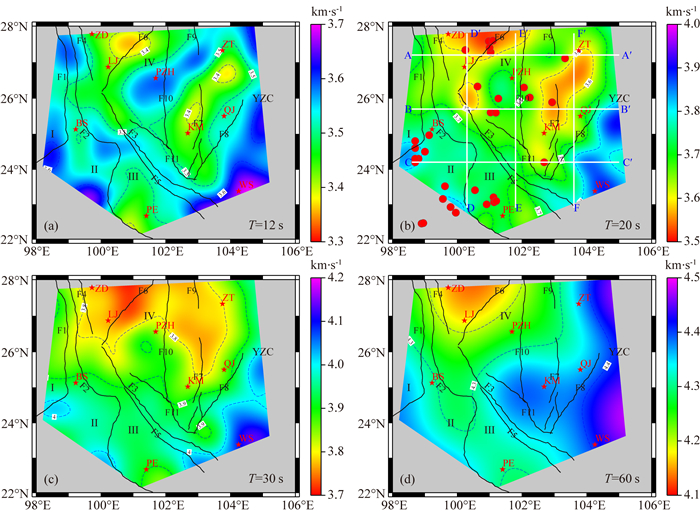
Rayleigh波和Love波相速度成像结果如图 7和8所示.Rayleigh波相速度特征主要如下:在12 s, 研究区主要呈现低速异常特征, 在攀枝花(PZH)附近呈现一个较明显的高速异常; 在20~30 s, 云南北部相对低速, 在中甸(ZD)和丽江(LJ)之间的低速异常非常明显, 云南南部则呈现明显的高速异常; 在60 s, 云南西南部呈现非常明显的低速异常, 在云南东北部的昭通(ZT)附近呈现大范围的高速异常.对于Love波, 主要特征如下:在12 s, 在攀枝花和昭通之间存在一个NE向的高速异常条带; 在20~30 s, Love波相速度的主要特征与Rayleigh波相似, 在云南北部呈现低速特征, 云南西南和东南相对高速; 在60 s, 云南南部仍然呈现高速异常特征, 在中甸与丽江之间仍然存在明显的低速异常.由于面波相速度是一定深度范围速度结构的积分, 为了确定异常体的准确深度范围, 有必要反演得到三维S波速度结构.
|
图 7 Rayleigh波相速度分布 Fig. 7 Phase velocity maps of Rayleigh waves |
|
图 8
Love波相速度分布
图b中的白色线段表示图 11和12中剖面的位置.红色圆表示1970—2014年震级6.0以上的地震. 地震目录数据源自国家地震科学数据共享中心(http://data.earthquake.cn). Fig. 8 Phase velocity maps of Love waves The white lines in (b) denote locations of the profiles in Fig. 11 and 12.The red circles denote the earthquakes with magnitudes ≥6.0 from 1970 to 2014.The catalog is provided by China Earthquake Data Center (http://data.earthquake.cn). |
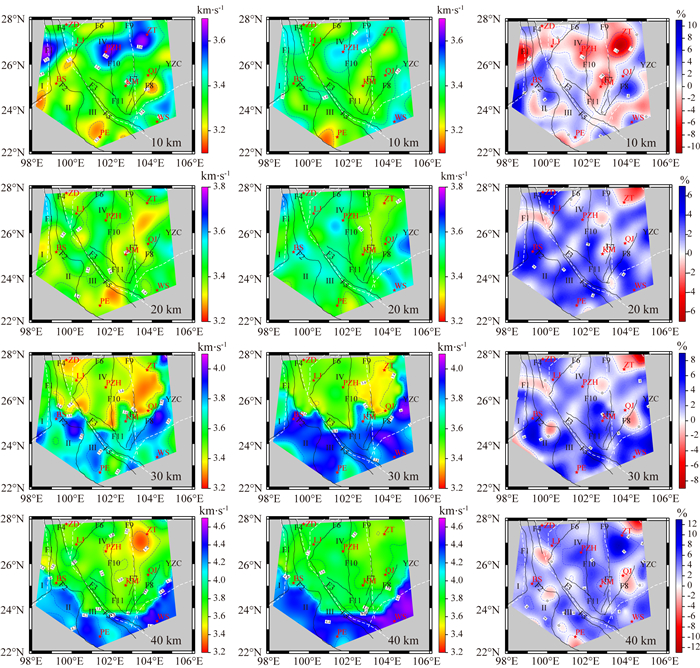
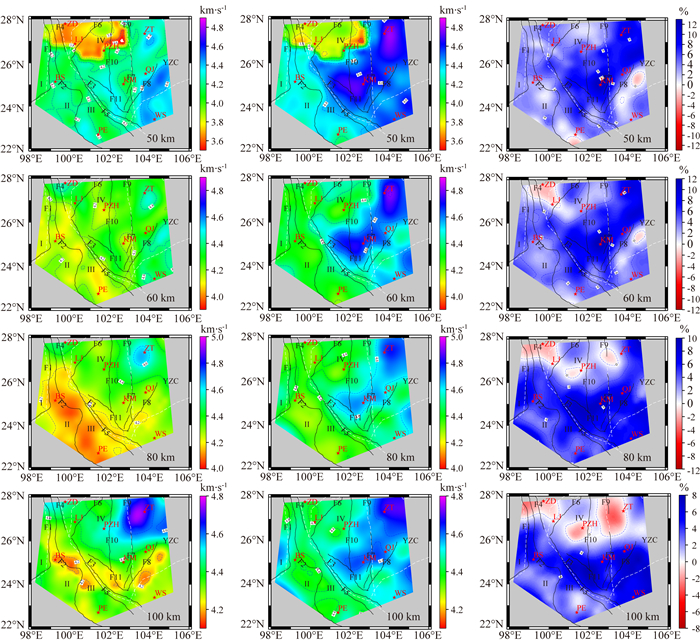
由Rayleigh波和Love波相速度成像结果, 分别反演10~100 km的SV和SH波速度结构, 并计算了径向各向异性强度, 结果如图 9和10所示.在10 km, 云南地区整体相对低速, 在攀枝花和昭通地区, SV和SH波都呈现高速异常, 并且呈现负径向各向异性(VSH < VSV); 在云南东南部的华南块体, SV和SH波也都呈现高速异常.在20~30 km, SV波在云南北部呈现两个明显的低速条带:西侧的低速条带起源于中甸(ZD), 向南经过丽江, 并到达红河断裂(F3)北侧; 东侧的低速条带起源于则木河断裂(F9), 向东南经过昭通地区, 并向南到达昆明(KM)和曲靖(QJ).对于SH波, 则木河—小江断裂带(F9—F7)东侧的低速条带与SV波基本一致, 在西侧不存在明显的低速特征.在两个低速条带内, 径向各向异性为正, 表明可能存在物质的水平流动.在20~40 km, 云南地区的整体呈现正径向各向异性(VSH>VSV)的特征, 表明地壳中存在较强的水平应力, 或者存在地壳物质的水平运动.
在50 km, 研究区西北部的中甸(ZD)、丽江(LJ)和攀枝花(PZH)地区呈现明显的低速异常, 这与这一地区的地壳厚度较厚有关(>50 km), 而其他地区已经进入岩石圈地幔, 相对高速.在50~60 km, 研究区整体呈现比较强的正径向各向异性, 在弥勒断裂(F8)东南侧呈现小范围的负径向各向异性特征.在80~110 km, 在云南西南和东南部, S波速度呈现明显的低速特征, 且径向各向异性为正; 在丽江、攀枝花和昭通地区, 呈现明显的负径向各向异性特征.
5 讨论本文利用云南地区的Rayleigh波和Love波相速度数据, 进行相速度层析成像, 分别反演得到SV和SH波速度结构, 进而计算径向各向异性强度.在每个网格点, 使用了线性迭代反演方法反演一维S波速度结构.由于反演的非唯一性, 计算得到的SV和SH波速度差异, 一方面是由于径向各向异性的存在导致的, 另一方面可能是由于反演的非唯一性导致的(彭艳菊等, 2007).由于采用线性迭代的反演方法, 无法直接得到S波速度的误差.彭艳菊等(2007)认为S波速度反演的误差一般小于0.05 km·s-1, 当SH和SV波的速度差异大于0.1 km·s-1时是有意义的.在本文中, 10~100 km的平均S波速度范围为3.4~4.4 km·s-1, 当径向各向异性强度大于2.2~3.0%时是有意义的.Mordret等(2015)使用邻域算法(NA)反演了富尔奈斯火山(Piton de la Fournaise)的S波速度和径向各向异性结构, 他们认为在反演过程中忽略地形和P波各向异性的影响, 会导致反演得到的S波径向各向异性强度不准确, 但是径向各向异性的符号是可靠的.因此, 本文主要围绕径向各向异性的正负进行讨论.
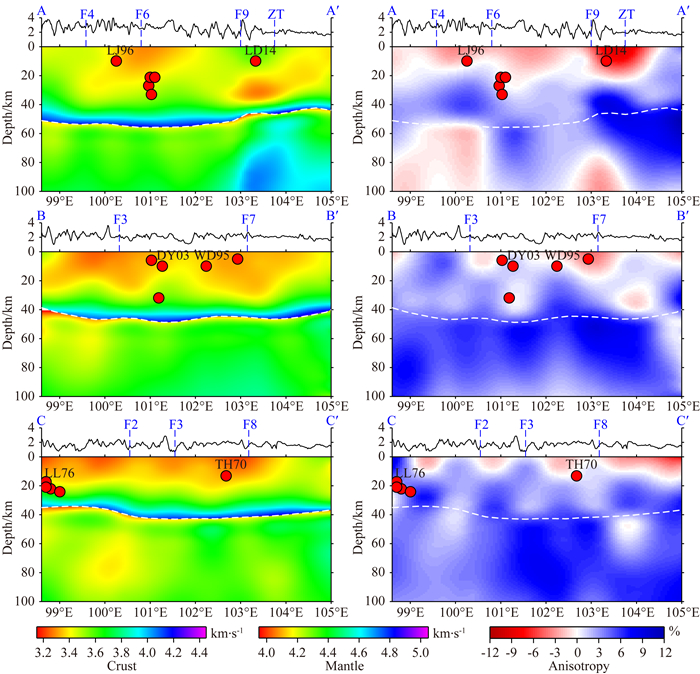
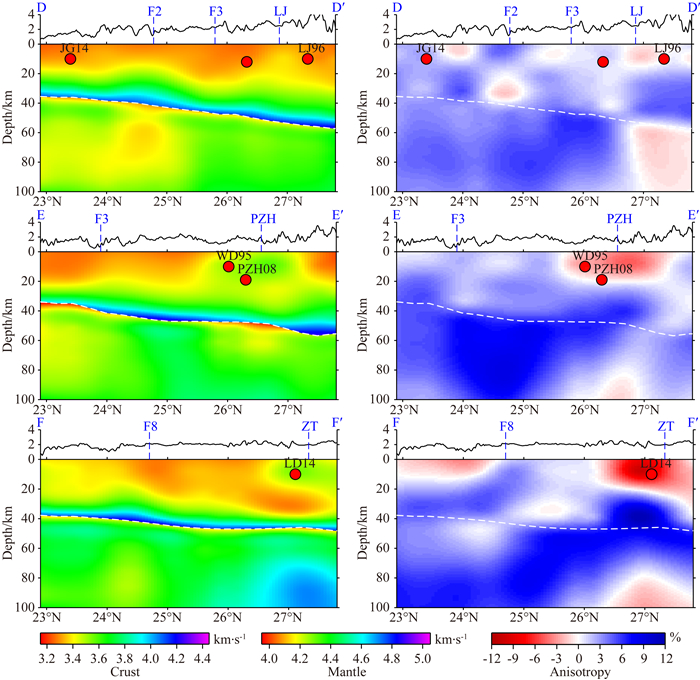
本文结果发现, 在20~30 km, 云南地区存在两个SV波低速条带(图 9), 这一结果与前人研究基本一致(Bao et al., 2015; Li et al., 2016b; Wu et al., 2016).Chen等(2016)反演得到了云南地区的地壳上地幔SV波速度和方位各向异性结构, 发现在低速条带内快波方向平行于条带走向.由图 9可见, 在低速条带内的径向各向异性为正(VSH>VSV).此外, 我们给出了沿东西向和南北向的S波速度与径向各向异性强度剖面, 结果见图 11和12.剖面AA′和BB′从西向东横向截过两个低速条带, 可以清晰地看到存在两个中下地壳低速区域, 且对应的径向各向异性为正; 剖面DD′和FF′从南向北分别穿过东西两个低速条带, 可以清晰地看到在剖面北侧存在中下地壳低速条带, 且对应的径向各向异性为正.此外, 可以看出东侧的低速条带(剖面F′F)的深度相对于西侧的低速条带(剖面D′D)更深; 在东侧条带内的昭通(ZT)地区, 中下地壳速度要明显小于上地壳速度.本文相关结果支持中下地壳低速流模型.
|
图 9 10~40 km的S波速度与径向各向异性强度分布图 在每个深度, 左图为SV波速度, 中图为SH波速度, 右图为径向各向异性强度. Fig. 9 S-wave velocity and radial anisotropy maps in the depth range of 10~40 km In each depth, the figure on the left shows the SV wave velocity, the figure in the middle shows the SH wave velocity, and the figure on the right shows the radial anisotropy. |
|
图 10 50~100 km的S波速度与径向各向异性强度分布图 在每个深度, 左图为SV波速度, 中图为SH波速度, 右图为径向各向异性强度. Fig. 10 S-wave velocity and radial anisotropy maps in the depth range of 50~100 km In each depth, the figure on the left shows the SV wave velocity, the figure in the middle shows the SH wave velocity, and the figure on the right shows the radial anisotropy. |
|
图 11
东西向剖面的S波速度与径向各向异性强度
剖面位置见图 8b.左图为Voigt平均S波速度 (Dziewonski and Anderson, 1981; Mordret et al., 2015), 右图为径向各向异性强度.白色虚线表示莫霍面, 在地壳和地幔中使用了不同的S波速度色标.横轴表示经度.红色圆表示图 8b中的历史地震, 选择了距离剖面0.5°内的地震.在每个剖面图上方为地形, 单位km.TH70, 1970年通海MS7.8地震; LL76, 1976年龙陵MS7.3和MS7.4地震; WD95, 1995年武定MS6.6级地震; LJ96, 1996年丽江MS6.9级地震; DY03, 2003年大姚MS6.3地震; LD14, 2014年鲁甸MS6.5地震.
Fig. 11
S-wave velocity and radial anisotropy profiles from east to west
The locations of the profiles are shown in Fig. 8b.The figure on the left shows the Voigt average S-wave velocity (Dziewonski and Anderson, 1981; Mordret et al., 2015), and the figure on the right shows the radial anisotropy.The white dashed line denotes the Moho discontinuity.Different color bars are used for the S-wave velocity in the crust and upper mantle.The horizontal axis denotes the longitude.The red circles denote the historical strong earthquake in Fig. 8b, and the events within the distance of 0.5° from the profile are plotted.The topography is shown on the top of each profile.Unit is km.TH70, 1970 Tonghai MS7.8 earthquake; LL76, 1976 Longling MS7.3 and MS7.4 earthquakes; WD95, 1995 Wuding MS6.6 earthquake; LJ96, 1996 Lijiang MS6.9 earthquake; DY03, 2003 Dayao MS6.3 earthquake; LD14, 2014 Ludian MS6.5 earthquake.
|
|
图 12 南北向剖面的S波速度与径向各向异性强度 剖面位置见图 8b.横轴表示纬度.WD95, 1995年武定MS6.6级地震; LJ96, 1996年丽江MS6.9级地震; PZH08, 2008年攀枝花MS6.3地震; LD14, 2014年鲁甸MS6.5级地震; JG14, 2014年景谷MS6.6地震.其他符号的意义同图 11. Fig. 12 S-wave velocity and radial anisotropy profiles from south to north The locations of the profiles are shown in Fig. 8b.WD95, 1995 Wuding MS6.6 earthquake; LJ96, 1996 Lijiang MS6.9 earthquake; PZH08, 2008 Panzhihua MS6.3 earthquake; LD14, 2014 Ludian MS6.5 earthquake; JG14, 2014 Jinggu MS6.6 earthquake.The horizontal axis denotes the latitude.Other labels are the same as that in Fig. 11. |
此外, 研究区内岩石圈整体呈现比较强的正径向各向异性(VSH>VSV), 这反映了岩石圈中存在很强的水平应力(彭艳菊等, 2007).在10 km, 在攀枝花和昭通地区以及则木河—小江断裂带(F9—F7)附近, 存在明显的负径向各向异性(VSH < VSV).Xie等(2013)认为近垂直分布的裂隙或断层可能会导致上地壳产生负径向各向异性.Pan和Shen(2017)通过GPS资料发现, 在青藏高原东南缘的一些主要断裂带(如则木河—小江断裂带)附近呈现较强的剪切应变, 这与则木河—小江断裂带的负径向各向异性特征是相符合的.在80~100 km, 云南西南和东南地区的S波相对低速, 且呈现正径向各向异性的特征.考虑到这一地区的岩石圈厚度较薄(大约80 km, An and Shi, 2006), 80~100 km的深度已经到达了软流圈, 正径向各向异性反应了软流圈的水平运动.在丽江(LJ)、攀枝花(PZH)和昭通(ZT)地区, 80~100 km的岩石圈地幔中存在明显的负径向各向异性特征(见图 12), 这一负径向各向异性可能反应了软流圈或地幔深部物质的垂直上涌.滕吉文(1987)综合多种地球物理资料, 推测攀西(攀枝花—西昌)构造带是一个“活化”的古裂谷带.李立和金国元(1987)通过大地电磁测深资料, 发现壳内低阻层在攀西地区轴部和龙门山断裂带附近变浅甚至消失, 认为这一地区经历了强烈的构造运动, 不具备裂谷发育阶段的典型电性特征, 但是在岩石圈深部仍保留了地幔上涌的痕迹.Liu等(2001)通过地震层析成像, 发现攀西地区具有典型的大陆古裂谷特征, 并在裂谷轴部的岩石圈地幔中发现了一个高速透镜体, 并推测该高速透镜体源自地幔深部物质的上涌.何斌等(2003)认为攀西地区可能不存在古裂谷, 晚古生代中国西南地区的规模空前的岩浆活动和地壳运动是峨眉山地幔柱的上升造成的.Niu等(2003)认为攀西裂谷带集中分布的轻稀土矿与地幔作用密切相关, 其成矿物质来自地幔.目前, 尽管在攀西地区是否存在古裂谷带还存在争议, 但是多种资料均表明在攀西地区可能存在地幔物质的上涌(滕吉文, 1987; 李立和金国元, 1987; 何斌等, 2003; Niu et al., 2003).我们在丽江、攀枝花和昭通地区的岩石圈地幔中发现的负径向各异性, 可能反映了地幔物质的上涌痕迹.
已有研究表明, 云南地区的历史强震在横向上多发生在地壳低速区或高低速过渡带(He et al., 2005; 李永华等, 2014; 潘佳铁等, 2015).为了研究地震在垂向上的特征, 我们把1970年以来的MS6.0级以上的强震震中投影在速度剖面上(图 11和12), 可以看出地震多位于地壳中低速或高低速过渡的区域.在一些地震的下方, 存在明显的地壳低速层, 如1996年丽江MS6.9地震(LJ96), 2008年攀枝花MS6.3地震(PZH08), 2014年鲁甸MS6.5地震(LD14).龙峰等(2010)、Wang等(2011)通过波形反演得到了2008年攀枝花地震的震源深度, 分别为10和11 km, 而中国地震局目录中的震源深度为19 km.需要指出的是波形反演得到的是矩中心(质心)深度, 而中国地震局目录是通过地震波走时测定的, 反映的是地震破裂起始点的深度.2008年攀枝花MS6.3地震的矩中心深度与破裂起始点深度存在较大差异, 这种差异性可能表明了地震是从下向上开始破裂的, 而破裂起始点更接近下方的低速层.李永华等(2014)发现2014年鲁甸地震震源下方存在中下地壳低速层, 与本文中结果一致.此外, Cai等(2017)通过大地电磁测深资料, 发现2014年鲁甸地震下方的地壳呈现高电导率特征.在其他地区也观察到类似的现象, 如Zhao等(1996)发现1995年日本神户大地震(M7.2)震源位于地壳中P波、S波低速和高泊松比的区域, Huang和Zhao(2004)发现1976年唐山大地震(M7.8)下方存在地壳P波低速层.这也表明了壳内低速层可能会促进强震的发生.此外, 我们还发现历史强震多发生在地壳中径向各向异性为负或者较弱的区域, 如1970年通海MS7.8地震, 1995年武定MS6.6地震(WD95), 和2014年鲁甸MS6.5地震(LD14), 在强正径向各向异性区域较少发生强震.
6 结论与展望本文通过面波相速度层析成像, 反演得到了云南地区的三维地壳上地幔S波速度与径向各向异性结构模型.结果表明:在云南地区的岩石圈中, 径向各向异性整体为正, 可能暗示着岩石圈中存在很强的水平向应力.在20~30 km, 云南地区存在两个低速条带, 且低速条带内径向各向异性为正, 暗示了可能存在地壳物质的水平流动, 相关结果支持中下地壳低速流模型.在80~100 km, 云南西南和东南部相对低速, 径向各向异性为正, 暗示了软流圈物质的水平流动.在丽江、攀枝花和昭通地区的岩石圈地幔中, 存在明显的负径向各向异性, 可能暗示了地幔物质的上涌痕迹.历史强震多发生在地壳低速区域或高低速过渡带, 且地震附近的径向各向异性为负或者较弱.一些地震震源下方存在低速层, 地壳低速层可能会促进强震发生.本文使用了线性迭代反演方法, 在今后的工作中, 可以采用邻域算法或蒙特卡洛等全局最优反演方法, 反演得到模型集, 评估S波速度和径向各向异性强度的误差.此外, 对于天然地震面波, 难以提取短周期的频散数据, 有必要开展背景噪声成像研究, 提高地壳上地幔结构模型的精度.
致谢感谢两位审稿专家的宝贵修改意见和建议.感谢倪四道研究员对本文的指导和帮助.感谢中国地震局地球物理研究所国家测震台网数据备份中心(doi:10.11998/SeisDmc/SN)和云南、四川、贵州地震台网为本研究提供地震波形数据.本文图件均是采用Generic Mapping Tool(Wessel and Smith, 1998)绘制.
An M J, Shi Y L. 2006. Lithospheric thickness of the Chinese continent. Physics of the Earth and Planetary Interiors, 159(3-4): 257-266. DOI:10.1016/j.pepi.2006.08.002 |
Bao X W, Song X D, Xu M J, et al. 2013. Crust and upper mantle structure of the North China Craton and the NE Tibetan Plateau and its tectonic implications. Earth and Planetary Science Letters, 369-370: 129-137. DOI:10.1016/j.epsl.2013.03.015 |
Bao X W, Sun X X, Xu M J, et al. 2015. Two crustal low-velocity channels beneath SE Tibet revealed by joint inversion of Rayleigh wave dispersion and receiver functions. Earth and Planetary Science Letters, 415: 16-24. DOI:10.1016/j.epsl.2015.01.020 |
Brocher T M. 2005. Empirical relations between elastic wavespeeds and density in the Earth's crust. Bulletin of the Seismological Society of America, 95(6): 2081-2092. DOI:10.1785/0120050077 |
Cai J T, Chen X B, Xu X W, et al. 2017. Rupture mechanism and seismotectonics of the MS6. 5 Ludian earthquake inferred from three-dimensional magnetotelluric imaging.Geophysical Research Letters, 44(3): 1275-1285. |
Chang L J, Wang C Y, Ding Z F. 2006. A study on SKS splitting beneath the Yunnan region. Chinese Journal of Geophysics (in Chinese), 49(1): 197-204. |
Chang L J, Wang C Y, Ding Z F. 2008. Seismic anisotropy of upper mantle in Sichuan and adjacent regions. Science in China Series D:Earth Sciences, 51(12): 1683-1693. DOI:10.1007/s11430-008-0147-8 |
Chen H P, Zhu L B, Ye Q D, et al. 2015. Azimuthal anisotropy of the crust and uppermost mantle in northeast North China Craton from inversion of Rayleigh wave phase velocity. Geophysical Journal International, 202(1): 624-639. DOI:10.1093/gji/ggv153 |
Chen H P, Zhu L B, Su Y J. 2016. Low velocity crustal flow and crust-mantle coupling mechanism in Yunnan, SE Tibet, revealed by 3D S-wave velocity and azimuthal anisotropy. Tectonophysics, 685: 8-20. DOI:10.1016/j.tecto.2016.07.007 |
Chen M, Huang H, Yao H J, et al. 2014. Low wave speed zones in the crust beneath SE Tibet revealed by ambient noise adjoint tomography. Geophysical Research Letters, 41(2): 334-340. DOI:10.1002/2013GL058476 |
Chen Y, Badal J, Zhang Z J. 2009. Radial anisotropy in the crust and upper mantle beneath the Qinghai-Tibet Plateau and surrounding regions. Journal of Asian Earth Sciences, 36(4-5): 289-302. DOI:10.1016/j.jseaes.2009.06.011 |
Chu R S, Ko J Y T, Wei S J, et al. 2017. Lithospheric radial anisotropy beneath the Gulf of Mexico. Earth and Planetary Science Letters, 466: 43-52. DOI:10.1016/j.epsl.2017.02.040 |
Data Management Centre of China National Seismic Network. 2007. Waveform data of China national seismic network. Institute of Geophysics, China Earthquake Administration, doi: 10. 11998/SeisDmc/SN, http://www.seisdmc.ac.cn. [2017-09-10].
|
Dziewonski A M, Anderson D L. 1981. Preliminary reference Earth model. Physics of the Earth and Planetary Interiors, 25(4): 297-356. DOI:10.1016/0031-9201(81)90046-7 |
Fu Y V, Gao Y, Li A B, et al. 2015. Lithospheric shear wave velocity and radial anisotropy beneath the northern part of North China from surface wave dispersion analysis. Geochemistry, Geophysics, Geosystems, 16(8): 2619-2636. DOI:10.1002/2015GC005825 |
Fu Y V, Gao Y, Li A B, et al. 2017. Lithospheric structure of the southeastern margin of the Tibetan Plateau from Rayleigh wave tomography. Journal of Geophysical Research:Solid Earth, 122(6): 4631-4644. DOI:10.1002/jgrb.v122.6 |
Gao Y, Wu J. 2008. Compressive stress field in the crust deduced from shear-wave anisotropy:An example in capital area of China. Chinese Science Bulletin, 53(18): 2840-2848. |
Guo Z, Yang Y J, Chen Y J. 2016. Crustal radial anisotropy in Northeast China and its implications for the regional tectonic extension. Geophysical Journal International, 207(1): 197-208. DOI:10.1093/gji/ggw261 |
He B, Xu Y G, Xiao L, et al. 2003. Does the Panzhihua-Xichang Rift Exist?. Geological Review (in Chinese), 49(6): 572-582. |
He Z Q, Su W, Ye T L. 2004. Seismic tomography of Yunnan Region using short-period surface wave phase velocity. Acta Seismologica Sinica (in Chinese), 26(6): 583-590. |
He Z Q, Ye T L, Su W. 2005. 3-D velocity structure of the middle and upper crust in the Yunnan region, China. Pure and Applied Geophysics, 162(12): 2355-2368. DOI:10.1007/s00024-005-2780-x |
Herrmann R B, Ammon C J. 2004. Computer programs in seismology. http://www.eas.slu.edu/eqc/eqccps.html. [2017-10-10].
|
Hess H H. 1964. Seismic anisotropy of the uppermost mantle under oceans. Nature, 203(4945): 629-631. DOI:10.1038/203629a0 |
Hu J F, Su Y J, Zhu X G, et al. 2005. S-wave velocity and Poisson's ratio structure of crust in Yunnan and its implication. Science in China Series D:Earth Sciences, 48(2): 210-218. DOI:10.1360/03yd0062 |
Hu J F, Zhu X G, Xia J Y, et al. 2005. Using surface wave and receiver function to jointly inverse the crust-mantle velocity structure in the West Yunnan area. Chinese Journal of Geophysics (in Chinese), 48(5): 1069-1076. DOI:10.1002/cjg2.750 |
Huang H, Yao H J, Van Der Hilst R D. 2010. Radial anisotropy in the crust of SE Tibet and SW China from ambient noise interferometry. Geophysical Research Letters, 37(21): L21310. DOI:10.1029/2010GL044981 |
Huang J L, Zhao D P, Zheng S H. 2002. Lithospheric structure and its relationship to seismic and volcanic activity in southwest China. Journal of Geophysical Research:Solid Earth, 107(B10): 2255. DOI:10.1029/2000JB000137 |
Huang J L, Zhao D P. 2004. Crustal heterogeneity and seismotectonics of the region around Beijing, China. Tectonophysics, 385(1-4): 159-180. DOI:10.1016/j.tecto.2004.04.024 |
Huang Z C, Wang P, Xu M J, et al. 2015. Mantle structure and dynamics beneath SE Tibet revealed by new seismic images. Earth and Planetary Science Letters, 411: 100-111. DOI:10.1016/j.epsl.2014.11.040 |
Jiang C X, Yang Y J, Zheng Y. 2014. Penetration of mid-crustal low velocity zone across the Kunlun Fault in the NE Tibetan Plateau revealed by ambient noise tomography. Earth and Planetary Science Letters, 406: 81-92. DOI:10.1016/j.epsl.2014.08.040 |
Kennett B L N, Engdahl E R, Buland R. 1995. Constraints on seismic velocities in the Earth from traveltimes. Geophysical Journal International, 122(1): 108-124. DOI:10.1111/gji.1995.122.issue-1 |
Laske G, Masters G, Ma Z T, et al. 2013. Update on CRUST 1.0-A 1-degree global model of Earth's crust. Geophysical Research Abstracts, 15: EGU2013-2658. |
Li H Y, Shen Y, Huang Z X, et al. 2014a. The distribution of the mid-to-lower crustal low-velocity zone beneath the northeastern Tibetan Plateau revealed from ambient noise tomography. Journal of Geophysical Research:Solid Earth, 119(3): 1954-1970. DOI:10.1002/2013JB010374 |
Li J T, Song X D, Zhu L P, et al. 2017. Joint inversion of surface wave dispersions and receiver functions with p velocity constraints:Application to southeastern tibet. Journal of Geophysical Research:Solid Earth, 122(9): 7291-7310. DOI:10.1002/2017JB014135 |
Li L, Jin G Y. 1987. Telluric electromagnetic sounding study of crust and upper mantle in the Panxi "Rift zone" and the Longmenshan Faulted zone. Geophysical and Geochemical Exploration (in Chinese), 11(3): 161-169. |
Li L, Li A B, Murphy M A, et al. 2016a. Radial anisotropy beneath northeast Tibet, implications for lithosphere deformation at a restraining bend in the Kunlun fault and its vicinity. Geochemistry, Geophysics, Geosystems, 17(9): 3674-3690. DOI:10.1002/2016GC006366 |
Li M K, Zhang S X, Wang F, et al. 2016b. Crustal and upper-mantle structure of the southeastern Tibetan Plateau from joint analysis of surface wave dispersion and receiver functions. Journal of Asian Earth Sciences, 117: 52-63. DOI:10.1016/j.jseaes.2015.12.002 |
Li Y H, Wu Q J, Zhang R Q, et al. 2008. The crust and upper mantle structure beneath Yunnan from joint inversion of receiver functions and Rayleigh wave dispersion data. Physics of the Earth and Planetary Interiors, 170(1-2): 134-146. DOI:10.1016/j.pepi.2008.08.006 |
Li Y H, Wu Q J, Zhang R Q, et al. 2009. The lithospheric thinning of the North China craton inferred from rayleigh waves inversion. Geophysical Journal International, 177(3): 1334-1342. DOI:10.1111/gji.2009.177.issue-3 |
Li Y H, Wu Q J, Tian X B, et al. 2009a. Crustal structure in the Yunnan region determined by modeling receiver functions. Chinese Journal of Geophysics (in Chinese), 52(1): 67-80. |
Li Y H, Wu Q J, Zhang R Q, et al. 2009b. The lithospheric S-velocity structure of the western Yangtze craton inferred from surface waves inversion. Chinese Journal of Geophysics (in Chinese), 52(7): 1757-1767. DOI:10.3969/j.issn.0001-5733.2009.07.009 |
Li Y H, Xu X M, Zhang E H, et al. 2014. Three-dimensional crust structure beneath SE Tibetan Plateau and its seismotectonic implications for the Ludian and Jinggu earthquakes. Seismology and Geology (in Chinese), 36(4): 1204-1216. |
Li Y H, Gao M T, Wu Q J. 2014b. Crustal thickness map of the Chinese mainland from teleseismic receiver functions. Tectonophysics, 611: 51-60. DOI:10.1016/j.tecto.2013.11.019 |
Li Z W, Ni S D, Roecker S. 2014c. Interstation Pg and Sg differential traveltime tomography in the northeastern margin of the Tibetan plateau:Implications for spatial extent of crustal flow and segmentation of the Longmenshan fault zone. Physics of the Earth and Planetary Interiors, 227: 30-40. DOI:10.1016/j.pepi.2013.11.016 |
Liu C M, Yao H J. 2017. Surface wave tomography with spatially varying smoothing based on continuous model regionalization. Pure and Applied Geophysics, 174(3): 937-953. DOI:10.1007/s00024-016-1434-5 |
Liu J H, Liu F T, He J K, et al. 2001. Study of seismic tomography in Panxi paleorift area of southwestern China. Science in China Series D:Earth Sciences, 44(3): 277-288. DOI:10.1007/BF02882262 |
Liu Q Y, Van Der Hilst R D, Li Y, et al. 2014. Eastward expansion of the Tibetan Plateau by crustal flow and strain partitioning across faults. Nature Geoscience, 7(5): 361-365. DOI:10.1038/ngeo2130 |
Long F, Zhang Y J, Wen X Z, et al. 2010. Focal mechanism solutions of ML ≥ 4.0 events in the MS6.1 Panzhihua-Huili earthquake sequence of Aug 30, 2008. Chinese Journal of Geophysics (in Chinese), 53(12): 2852-2860. DOI:10.3969/j.issn.0001-5733.2010.12.008 |
Lu L Y, He Z Q, Ding Z F, et al. 2014. Azimuth anisotropy and velocity heterogeneity of Yunnan area based on seismic ambient noise. Chinese Journal of Geophysics (in Chinese), 57(3): 822-836. DOI:10.6038/cjg20140312 |
Montagner J P. 1986. Regional three-dimensional structures using long-period surface waves. Annales Geophysicae, 4(3): 283-294. |
Mordret A, Rivet D, Landès M, et al. 2015. Three-dimensional shear velocity anisotropic model of Piton de la Fournaise Volcano (La Réunion Island) from ambient seismic noise. Journal of Geophysical Research:Solid Earth, 120(1): 406-427. DOI:10.1002/2014JB011654 |
Niu F L, Li J. 2011. Component azimuths of the CEArray stations estimated from P-wave particle motion. Earthquake Science, 24(1): 3-13. DOI:10.1007/s11589-011-0764-8 |
Niu H C, Shan Q, Chen X M, et al. 2003. Relationship between light rare earth deposits and mantle processes in Panxi rift, China. Science in China Series D:Earth Sciences, 46(S1): 41-49. |
Ojo A O, Ni S D, Li Z W. 2017. Crustal radial anisotropy beneath Cameroon from ambient noise tomography. Tectonophysics, 696-697: 37-51. DOI:10.1016/j.tecto.2016.12.018 |
Ojo A O, Ni S D, Chen H P, et al. 2018. Crust-mantle coupling mechanism in Cameroon, West Africa, revealed by 3D S-wave velocity and azimuthal anisotropy. Physics of the Earth and Planetary Interiors, 274: 195-213. DOI:10.1016/j.pepi.2017.12.006 |
Ouyang L B, Li H Y, Lü Q T, et al. 2015. Crustal shear wave velocity structure and radial anisotropy beneath the Middle-Lower Yangtze River metallogenic belt and surrounding areas from seismic ambient noise tomography. Chinese Journal of Geophysics (in Chinese), 58(12): 4388-4402. DOI:10.6038/cjg20151205 |
Pan J T, Wu Q J, Li Y H, et al. 2011. Rayleigh wave tomography of the phase velocity in North China. Chinese Journal of Geophysics (in Chinese), 54(1): 67-76. DOI:10.3969/j.issn.0001-5733.2011.01.008 |
Pan J T, Li Y H, Wu Q J, et al. 2015. Phase velocity maps of Rayleigh waves in the southeast Tibetan plateau. Chinese Journal of Geophysics (in Chinese), 58(11): 3993-4006. DOI:10.6038/cjg20151109 |
Pan Y J, Shen W B. 2017. Contemporary crustal movement of southeastern Tibet:Constraints from dense GPS measurements. Scientific Reports, 7: 45348. DOI:10.1038/srep45348 |
Peng Y J, Huang Z X, Su W, et al. 2007. Anisotropy in crust and upper mantle beneath China continent and its adjacent seas. Chinese Journal of Geophysics (in Chinese), 50(3): 752-759. |
Ritzwoller M H. 2013. Automatic Frequency_Time Analysis (AFTAN) program, Version 1. 1, http://ciei.colorado.edu/Products/. [2017-10-15].
|
Royden L H, Burchfiel B C, King R W, et al. 1997. Surface deformation and lower crustal flow in eastern Tibet. Science, 276(5313): 788-790. DOI:10.1126/science.276.5313.788 |
Shapiro N M, Ritzwoller M H, Molnar P, et al. 2004. Thinning and flow of Tibetan crust constrained by seismic anisotropy. Science, 305(5681): 233-236. DOI:10.1126/science.1098276 |
Shen X Z, Yuan X H, Ren J S. 2015. Anisotropic low-velocity lower crust beneath the northeastern margin of Tibetan Plateau:Evidence for crustal channel flow. Geochemistry, Geophysics, Geosystems, 16(12): 4223-4236. DOI:10.1002/2015GC005952 |
Shi Y T, Gao Y, Wu J, et al. 2009. Crustal seismic anisotropy in Yunnan, southwestern China. Journal of Seismology, 13(2): 287-299. DOI:10.1007/s10950-008-9128-9 |
Shi Y T, Gao Y, Su Y J, et al. 2012. Shear-wave splitting beneath Yunnan area of Southwest China. Earthquake Science, 25(1): 25-34. DOI:10.1007/s11589-012-0828-4 |
Simons F J, Van Der Hilst R D, Montagner J P, et al. 2002. Multimode Rayleigh wave inversion for heterogeneity and azimuthal anisotropy of the Australian upper mantle. Geophysical Journal International, 151(3): 738-754. DOI:10.1046/j.1365-246X.2002.01787.x |
Soomro R A, Weidle C, Cristiano L, et al. 2016. Phase velocities of Rayleigh and Love waves in central and northern Europe from automated, broad-band, interstation measurements. Geophysical Journal International, 204(1): 517-534. DOI:10.1093/gji/ggv462 |
Tarantola A, Valette B. 1982. Generalized nonlinear inverse problems solved using the least squares criterion. Reviews of Geophysics, 20(2): 219-232. DOI:10.1029/RG020i002p00219 |
Tarantola A, Nercessian A. 1984. Three-dimensional inversion without blocks. Geophysical Journal International, 76(2): 299-306. DOI:10.1111/j.1365-246X.1984.tb05047.x |
Teng J W. 1987. Panzhihua-Xichang ancient rift and "activited" Geophysical features. Acta Geophysica Sinica (in Chinese), 30(6): 581-593. |
Wang C Y, Chan W W, Mooney W D. 2003. Three-dimensional velocity structure of crust and upper mantle in southwestern China and its tectonic implications. Journal of Geophysical Research:Solid Earth, 108(B9): 2442. DOI:10.1029/2002JB001973 |
Wang C Y, Chang L J, Lü Z Y, et al. 2007. Seismic anisotropy of upper mantle in eastern Tibetan Plateau and related crust-mantle coupling pattern. Science in China Series D:Earth Sciences, 50(8): 1150-1160. DOI:10.1007/s11430-007-0053-5 |
Wang C Y, Lou H, Silver P G, et al. 2010. Crustal structure variation along 30N in the eastern Tibetan Plateau and its tectonic implications. Earth and Planetary Science Letters, 289(3-4): 367-376. DOI:10.1016/j.epsl.2009.11.026 |
Wang J, Zhao D P. 2013. P-wave tomography for 3-D radial and azimuthal anisotropy of Tohoku and Kyushu subduction zones. Geophysical Journal International, 193(3): 1166-1181. DOI:10.1093/gji/ggt086 |
Wang W L, Wu J P, Fang L H, et al. 2014. S-wave velocity structure in southwest China from surface wave tomography and receiver functions. Journal of Geophysical Research:Solid Earth, 119(2): 1061-1078. DOI:10.1002/2013JB010317 |
Wang Z J, Chong J J, Ni S D, et al. 2011. Determination of focal depth by two waveformbased methods:A case study for the 2008 Panzhihua earthquake. Earthquake Science, 24(4): 321-328. DOI:10.1007/s11589-011-0794-2 |
Wessel P, Smith W H F. 1998. New, improved version of generic mapping tools released. EOS, 79(47): 579-579. DOI:10.1029/98EO00426 |
Wu J P, Ming Y H, Wang C Y. 2001. The S wave velocity structure beneath digital seismic stations of Yunnan province inferred from teleseismic receiver function modelling. Chinese Journal of Geophysics (in Chinese), 44(2): 228-237. |
Wu S S, Jiang M M, He Y M, et al. 2018. NW-SE structural contrast of shear wave velocity and radial anisotropy beneath the Hefei-Jinhua seismic profile derived from ambient noise tomography. Chinese Journal of Geophysics (in Chinese), 61(2): 584-592. DOI:10.6038/cjg2018L0261 |
Wu T F, Zhang S X, Li M K, et al. 2016. Two crustal flowing channels and volcanic magma migration underneath the SE margin of the Tibetan Plateau as revealed by surface wave tomography. Journal of Asian Earth Sciences, 132: 25-39. DOI:10.1016/j.jseaes.2016.09.017 |
Xie J Y, Ritzwoller M H, Shen W S, et al. 2013. Crustal radial anisotropy across Eastern Tibet and the Western Yangtze Craton. Journal of Geophysical Research:Solid Earth, 118(8): 4226-4252. DOI:10.1002/jgrb.50296 |
Xu Y, Yang X T, Liu J H. 2013. Tomographic study of crustal velocity structures in the Yunnan region southwest China. Chinese Journal of Geophysics (in Chinese), 56(6): 1904-1914. DOI:10.6038/cjg20130613 |
Yang Y H, Zhu L B, Su Y J, et al. 2015. Crustal anisotropy estimated by splitting of Ps-converted waves on seismogram and an application to SE Tibetan plateau. Journal of Asian Earth Sciences, 106: 216-228. DOI:10.1016/j.jseaes.2015.03.016 |
Yao H J, Beghein C, Van Der Hilst R D. 2008. Surface wave array tomography in SE Tibet from ambient seismic noise and two-station analysis-Ⅱ.Crustal and upper-mantle structure. Geophysical Journal International, 173(1): 205-219. DOI:10.1111/gji.2008.173.issue-1 |
Yao H J, Van Der Hilst R D, Montagner J P. 2010. Heterogeneity and anisotropy of the lithosphere of SE Tibet from surface wave array tomography. Journal of Geophysical Research:Solid Earth, 115(B12): B12307. DOI:10.1029/2009JB007142 |
Yu D X, Wu Q J, Ye Q D, et al. 2017. Computation of azimuthal anisotropy for Rayleigh wave phase velocity. Progress in Geophysics (in Chinese), 32(1): 101-105. DOI:10.6038/pg20170113 |
Zhao D P, Kanamori H, Negishi H, et al. 1996. Tomography of the source area of the 1995 Kobe earthquake:Evidence for fluids at the hypocenter?. Science, 274(5294): 1891-1894. DOI:10.1126/science.274.5294.1891 |
Zheng X F, Ouyang B, Zhang D N, et al. 2009. Technical system construction of data backup centre for china seismograph network and the data support to researches on the Wenchuan earthquake. Chinese Journal of Geophysics (in Chinese), 52(5): 1412-1417. DOI:10.3969/j.issn.0001-5733.2009.05.031 |
常利军, 王椿镛, 丁志峰. 2006. 云南地区SKS波分裂研究. 地球物理学报, 49(1): 197-204. |
常利军, 王椿镛, 丁志峰. 2008. 四川及邻区上地幔各向异性研究. 中国科学D辑:地球科学, 38(12): 1589-1599. |
高原, 吴晶. 2008. 利用剪切波各向异性推断地壳主压应力场:以首都圈地区为例. 科学通报, 53(23): 2933-2939. DOI:10.3321/j.issn:0023-074X.2008.23.015 |
国家测震台网数据备份中心. 2007. 国家测震台网地震波形数据. 中国地震局地球物理研究所, doi: 10. 11998/SeisDmc/SN. http://www.seisdmc.ac.cn. [2017-09-10].
|
何斌, 徐义刚, 肖龙, 等. 2003. 攀西裂谷存在吗?. 地质论评, 49(6): 572-582. |
何正勤, 苏伟, 叶太兰. 2004. 云南地区的短周期面波相速度层析成像研究. 地震学报, 26(6): 583-590. |
胡家富, 苏有锦, 朱雄关, 等. 2003. 云南的地壳S波速度与泊松比结构及其意义. 中国科学(D辑), 33(8): 714-722. |
胡家富, 朱雄关, 夏静瑜, 等. 2005. 利用面波和接收函数联合反演滇西地区壳幔速度结构. 地球物理学报, 48(5): 1069-1076. |
李立, 金国元. 1987. 攀西裂谷带及龙门山断裂带地壳上地幔的大地电磁测深研究. 物探与化探, 11(3): 161-169. |
李永华, 吴庆举, 田小波, 等. 2009a. 用接收函数方法研究云南及其邻区地壳上地幔结构. 地球物理学报, 52(1): 67-80. |
李永华, 吴庆举, 张瑞青, 等. 2009b. 用面波方法研究上扬子克拉通壳幔速度结构. 地球物理学报, 52(7): 1757-1767. DOI:10.3969/j.issn.0001-5733.2009.07.009 |
李永华, 徐小明, 张恩会, 等. 2014. 青藏高原东南缘地壳结构及云南鲁甸, 景谷地震深部孕震环境. 地震地质, 36(4): 1204-1216. |
龙锋, 张永久, 闻学泽, 等. 2010. 2008年8月30日攀枝花-会理6.1级地震序列ML ≥ 4.0事件的震源机制解. 地球物理学报, 53(12): 2852-2860. DOI:10.3969/j.issn.0001-5733.2010.12.008 |
鲁来玉, 何正勤, 丁志峰, 等. 2014. 基于背景噪声研究云南地区面波速度非均匀性和方位各向异性. 地球物理学报, 57(3): 822-836. DOI:10.6038/cjg20140312 |
欧阳龙斌, 李红谊, 吕庆田, 等. 2015. 长江中下游成矿带及邻区地壳剪切波速度结构和径向各向异性. 地球物理学报, 58(12): 4388-4402. DOI:10.6038/cjg20151205 |
潘佳铁, 吴庆举, 李永华, 等. 2011. 华北地区瑞雷面波相速度层析成像. 地球物理学报, 54(1): 67-76. DOI:10.3969/j.issn.0001-5733.2011.01.008 |
潘佳铁, 李永华, 吴庆举, 等. 2015. 青藏高原东南部地区瑞雷波相速度层析成像. 地球物理学报, 58(11): 3993-4006. DOI:10.6038/cjg20151109 |
彭艳菊, 黄忠贤, 苏伟, 等. 2007. 中国大陆及邻区海域地壳上地幔各向异性研究. 地球物理学报, 50(3): 752-759. |
滕吉文. 1987. 攀枝花-西昌古裂谷与"活化"的地球物理特征. 地球物理学报, 30(6): 581-593. |
王椿镛, 常利军, 吕智勇, 等. 2007. 青藏高原东部上地幔各向异性及相关的壳幔耦合型式. 中国科学D辑:地球科学, 37(4): 495-503. |
吴建平, 明跃红, 王椿镛. 2001. 云南数字地震台站下方的S波速度结构研究. 地球物理学报, 44(2): 228-237. |
吴珊珊, 姜明明, 何玉梅, 等. 2018. 利用背景噪声成像研究合肥-金华剖面地壳速度结构及径向各向异性的东西差异. 地球物理学报, 61(2): 584-592. DOI:10.6038/cjg2018L0261 |
胥颐, 杨晓涛, 刘建华. 2013. 云南地区地壳速度结构的层析成像研究. 地球物理学报, 56(6): 1904-1914. DOI:10.6038/cjg20130613 |
余大新, 吴庆举, 叶庆东, 等. 2017. Rayleigh波相速度方位各向异性的计算. 地球物理学进展, 32(1): 101-105. DOI:10.6038/pg20170113 |
郑秀芬, 欧阳飚, 张东宁, 等. 2009. "国家数字测震台网数据备份中心"技术系统建设及其对汶川大地震研究的数据支撑. 地球物理学报, 52(5): 1412-1417. DOI:10.3969/j.issn.0001-5733.2009.05.031 |
 2018, Vol. 61


