2008年汶川大地震(MS=8.0)给四川省及周边地区带来深重灾难.地震刚一发生,中国地震局迅速组织大批专家赶赴地震现场进行实地考察,获取了大量的有关地表破裂特征、建筑物破坏、滑坡分布、灾害损失、人员伤亡等第一手资料,特别是给出了地震烈度分布图.通过对震后勘查资料的初步分析发现,除位于震中的汶川地区地震灾害非常严重外,远离震中的北川地区的地震灾害也特别严重,该区的人员伤亡、建筑物损坏、地表破裂、同震位错、滑坡规模等甚至比震中还要显著,形成北川地区是汶川地震的另外一个宏观震中的现象.
汶川地震的地表变形、地震波辐射以及强地面运动等被大量的布设在全球及附近地区的地球物理观测仪器(如:地震仪、GPS接收机以及强震仪等)所记录.近10年来,科学家们通过分析这些仪器记录的观测资料,反演给出了有关汶川地震发震断层几何、同震位错分布以及断层破裂历史等结果(如:王卫民等,2008;张勇等,2008;杜海林等,2009;Shen et al., 2009; De Michele et al., 2010; Tong et al., 2010; Feng et al., 2010; Xu et al, 2010; Wang et al., 2011; Fielding et al., 2013;Zhang et al., 2014;Pan et al., 2014).尽管不同的作者采用不同类型的观测资料,运用不同的计算方法反演给出了不同的震源模型,但其基本特征大体相同.其主要特点如下:(1)同震位错的最大值分别分布在映秀和北川地区;(2)以高川为分界点,其西南方向的破裂机制以逆冲为主,破裂速度较慢;而东北方向以走滑型为主,且其破裂速度较快;(3)发震断层模型中,具有近直线(或直面)展布的映秀—北川断裂带在高川地区发生明显拐折,形成高川右弯,北川是在相距高川不远的东北方向.通常情况下,距离震中越远地震灾害会越来越轻,而北川地区距离震中有100多千米,其震害出现了严重的反常现象.
根据上述现象提出如下问题:(1)为什么远离震中的北川地区地震灾害如此严重?(2)高川右弯对汶川地震的整个断层破裂过程影响如何?(3)断层破裂与地震灾害之间的关系怎样?为此,本文拟利用有限元数值计算方法,模拟汶川地震的主要发震断裂带(即:映秀—北川断层)的自发破裂过程,计算给出强地面运动峰值加速度的空间分布,分析北川地区地震灾害特别严重的动力学机制.
1 同震破裂特征及有限元模型 1.1 汶川地震破裂的主要特征2008年汶川大地震是龙门山断裂带映秀—北川断裂突发错动的结果(张培震,2008).龙门山断裂带是青藏高原和华南地块的边界构造带,经历了长期的地质演化,具有十分复杂的地质结构和演化历史.晚新生代以来,在青藏高原向东扩展的推挤和四川盆地(华南地块)的阻挡作用下,使得中生代形成的逆冲断裂复活, 并发生强烈的隆升作用.晚第四纪以来活动的龙门山断裂带主要由3条具有发生强烈地震能力的主干断裂所组成(如图 1所示).西边是后山断裂(也称汶川—茂县断裂),大体上沿汶川到茂县的高深峡谷延伸,这次地震时没有发生破裂,但滑坡等地质灾害十分严重;中间是中央断裂(即映秀—北川断裂),沿映秀—北川—平通—南坝—水观展布,连续性较好,是2008年8.0级汶川地震的主要发震断裂;东边是前山断裂(亦称灌县—江油断裂),沿龙门山与成都平原交界附近分布,这次地震形成了73 km长的通济—汉旺地表破裂带(见图 1).除此之外,在成都平原内部靠近山前的地方,还发育一系列断续分布的隐伏断裂,但他们规模有限、位移量较小,尚未形成明显的地貌现象(张培震,2008).

|
图 1 龙门山断裂带及其周边的地质构造图 红色曲线表示汶川地震地表破裂迹线,高川右弯位于映秀—北川断裂带的中部. Fig. 1 Regional tectonic map of the Longmen Shan fault zone Thick red lines are the surface ruptures and black lines are the active faults. Gaochuan right bend is located in the middle of the Yingxiu-Beichuan fault. |
汶川地震造成了映秀—北川断裂产生长达240 km的地表破裂带.该断裂带从映秀镇以南开始向东北方向延伸,经北川县城,过南坝镇,终止在平武县的石坎乡附近.从地图上看,映秀—北川断裂带大体上为直线.
无论是震后的地质勘查还是地球物理学反演其结果都表明,近似于直线(或平直的面)的映秀—北川断裂带在其中部附近的高川地区发生了拐折,实际上是向右拐了一个弯(亦称高川右弯)(见图 1所示).北川县城位于高川右弯不远的东北方向.早期高川右弯就被地质学家所关注(如:Tapponnier and Molnar, 1977; 徐锡伟等, 2008; Shen et al, 2009; Ren et al., 2010; Xu et al., 2010; Zhang et al., 2010; Deng et al., 2011),它是龙门山断裂带上的一个重要几何节点.
由于高川地区山势险峻,道路险阻,加上汶川地震中产生的大量滑坡,所以汶川地震中对该地区地表的破裂情况没有详尽的调查资料(Zhang et al., 2010).因此,映秀—北川断裂带在高川右弯地区的连续性情况也没有定论,尽管目前发表的大多数文章中都将该断裂带绘制为连续的曲线.
对汶川地震发生以来大量的研究结果分析得出(王卫民等,2008;张勇等,2008;张培震,2008;杜海林等,2009;Shen et al., 2009; De Michele, et al., 2010; Tong et al., 2010; Feng et al., 2010; Xu et al, 2010; Wang et al., 2011; Fielding et al., 2013),高川右弯对于整个汶川地震的破裂过程起着非常重要的作用:(1)最大同震位移分布位于高川右弯的两侧,即映秀和北川地区;(2)最严重的地震灾害也是分布在高川右弯的两边;(3)特别是,跨越高川右弯后,断层破裂速度由小变大(杜海林等,2009;Wang et al., 2016),断层破裂性质也从地震起始时的几乎纯逆冲变化到跨过高川右弯后的近纯走滑.
1.2 有限单元模型为研究远离震中的北川地区地震灾害特别严重的原因,考察高川右弯在整个汶川地震破裂过程中的作用,文中将采用有限元方法对汶川地震的破裂动力学过程进行数值模拟.
汶川地震中断层破裂规模巨大,断层几何形状复杂多变,既有平面也有曲面,断层面倾角自南向北也不断发生变化,断层在空间上还存在不连续性分布等多种特征(朱守彪和张培震, 2009; Zhu and Zhang, 2010, 2013; Zhu, 2013).研究中,重点突出高川右弯对北川地区地震灾害的影响,文中将实际的三维地质体简化为二维模型(通过震源的水平面);此外仅考虑汶川地震的主要发震断裂─映秀—北川断裂,而其他的断裂带(如山前断裂带等)均不予考虑.具体模拟中,将图 1中曲折复杂的映秀—北川断裂带简化为图 2中的断层模型.图 2展示了模拟所采用的有限元模型示意图,其中模型的几何尺度为300 km×300 km;图中曲线ABCDE代表映秀—北川断裂带,其中弯曲部分代表高川右弯,红色曲线BC表示断层空间的不连续区段.模拟中为尽量消除沙漏现象对模型计算产生的影响,模型全部采用3节点单元剖分(Hibbitt et al., 2006).为突出研究断层的破裂过程,在有限元网格剖分时,尽量让断层附近网格密集,该处网格长度仅为50 m, 但随着离开断层的距离增加,单元尺度逐渐增大,在模型边缘处,单元长度为350 m,这样整个模型中三角形单元总数为2550846,节点数为1282160.模型四周的吸收边界采用的是无限单元(Hibbitt et al., 2006; 袁杰和朱守彪, 2014a, b, 2017;Yuan and Zhu, 2016; 朱守彪等,2017).图 2中红色五角星表示汶川地震的成核位置(震源),计算时首先让破裂在汶川地震的震源处成核,然后让破裂自发地向两侧传播、演化.

|
图 2 有限元模型及初始、边界条件示意图 ABCDE表示映秀—北川断裂带,曲线BCD表示高川右弯,红色曲线BC表示断层不连续段,红色五角星表示破裂成核位置(震源),黑色三角形S1、S2表示虚拟接收台站位置,模型四周的灰色部分表示吸收单元,用于吸收地震波在边界的反射. Fig. 2 Model geometry, the initial and boundary conditions Line ABCDE represents the Yingxiu-Beichuan fault, the curved line BCD denotes the Gaochuan right bend, and curved BC discontinuous fault segment. The red star marks the nucleation patch located at the hypocenter of the Wenchuan main shock. The black triangles denote virtual seismometers, and the gray region around the model is the absorbing boundary (infinite elements in ABAQUS). |
为简单起见,模型中的介质假定为均匀各向同性的线弹性材料.材料的杨氏模量、泊松比等根据龙门山地区的地震波速度结构选定(Wang et al., 2007, 2009; Liu et al., 2009, 2014);模型中的初始应力场也假定为均匀,其大小及方位根据GPS观测计算的方位(Zhu et al., 2006; Zhu and Shi, 2011)以及应力场反演结果(Zhu and Shi, 2007)给出;断层面上的摩擦关系为滑移弱化的摩擦本构关系(朱守彪等,2017).具体的材料参数、初始应力场大小及摩擦参数等见表 1.此外,在有限元模拟中,计算的时间步长取为0.0001 s.
|
|
表 1 模型中的材料参数、初始应力场及摩擦参数 Table 1 Model parameters used for simulation in the study |
当破裂在成核处(震源)启动后(袁杰和朱守彪, 2014a, b; 朱守彪和袁杰,2016;朱守彪等,2017),就会自发地向断层两侧传播、演化.断层破裂的传播完全是动力学过程,计算之前不知道破裂速度大小及其变化,破裂速度只受介质属性、初始应力状态、断层几何以及摩擦关系所控制.下文将详细介绍高川右弯对破裂传播过程的控制作用以及对北川地区地震灾害的影响.
2.1 高川右弯对产生超剪切破裂过程的促进作用断层破裂速度及其速度的变化对地震灾害会产生重要作用(Das, 2007),下面我们将重点研究高川右弯对断层破裂速度的影响.
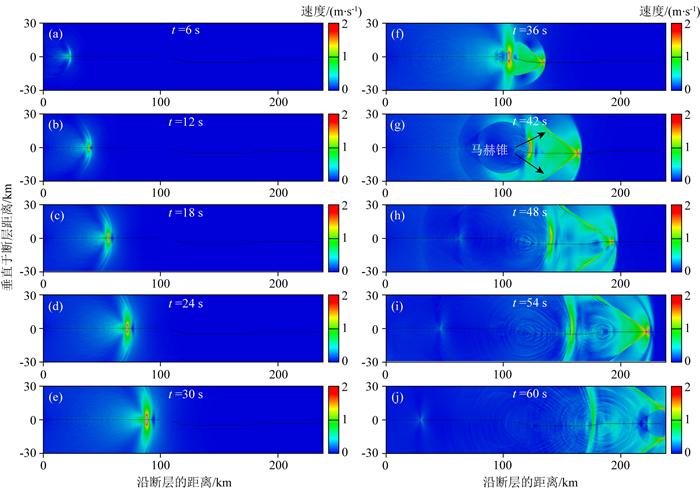
图 3为断层破裂在传播过程中在不同时刻质点振动速度等值线云图的快照.其中图(a)、(b)、(c)、(d)以及(e)分别表示破裂在开始后的第6 s、12 s、18 s、24 s以及第30 s时的质点振动速度等值线云图.图中显示,在这期间破裂一直是沿着映秀—高川断层段向东北方向传播,其平均破裂速度为2790 m·s-1.而由表 1可知介质的S波速度为3380 m·s-1,可见破裂在这一阶段其速度小于S波速度,故为亚剪切破裂.但是,从第36 s开始(见图 3f)破裂已经跨越了高川右弯,在高川—北川断层段上传播,这时图中清晰地出现了马赫波.在其后的图(g)、(h)、(i)以及图(j)中也显示了马赫锥,由此说明破裂在高川—北川—南坝段上是超剪切速度的.实际上通过计算可知,在该段上破裂传播的平均速度为5160 m·s-1,接近P波的速度(5800 m·s-1),由此进一步证实破裂在该断层段为超剪切波速度传播.

|
图 3 破裂传播过程在不同时刻的快照 破裂在映秀—高川断层段上的平均传播速度为2790 m·s-1,低于S波速度,为亚剪切破裂;一旦破裂跨越高川右弯后,破裂速度迅速变化,其平均值转变为5160 m·s-1,该值大大高于S波速度,这时的破裂为超剪切破裂. Fig. 3 Snapshots of spontaneously propagating dynamic rupture at different times Rupture propagates at constant speed with the average value of 2790 m·s-1, less than that of shear wave speed, before it goes to the Gaochuan right bend, shown in from Figure (a) to Figure (e). Once the rupture travels across the Gaochuan right bend, shown in Figure (f), Mach waves are formed immediately, and rupture speed is about 5160 m·s-1, larger than that of S wave speed, suggesting the supershear rupture in the Gaochuan-Beichuan fault, displayed in from Figure (f) to Figure (j). |
破裂通过高川右弯后,之所以转换为超剪切破裂,其主要原因是高川右弯为弯曲的断层面,断层的走向与整个映秀—北川断层的走向不一致,这样高川右弯断层面上的正应力和剪切应力都要减小,但正应力减小得更快,这就造成了破裂易于在高川右弯上成核并快速传播.
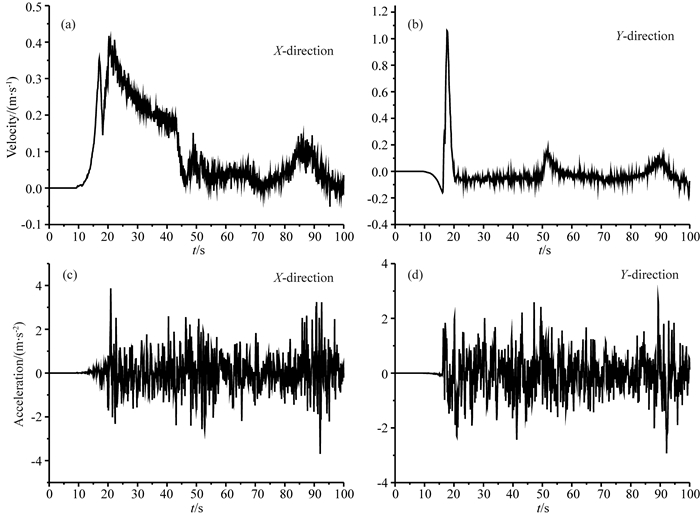
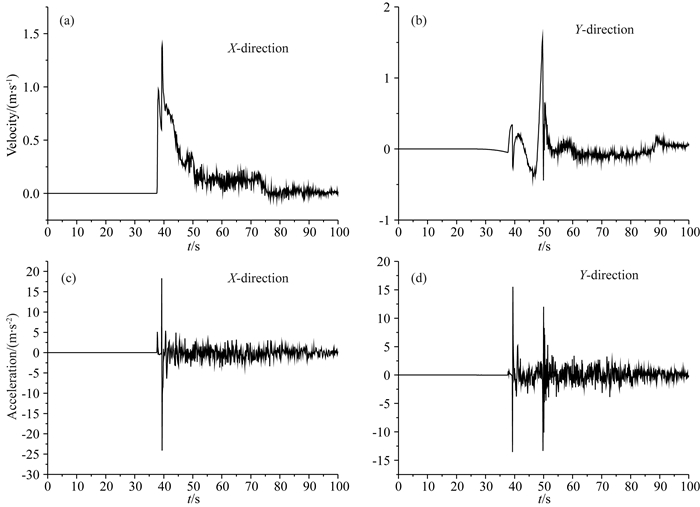
为进一步考察超剪切破裂产生的地震波特征,图 4—5分别给出了2个虚拟地震台(见图 2中的黑色三角形)记录的地震波结果.

|
图 4 S1台记录的质点振动速度和加速度随时间变化的曲线 Fig. 4 Time histories for two components of velocity and acceleration at the seismostation S1, respectively |

|
图 5 S2台记录的质点振动速度和加速度随时间变化的曲线 Fig. 5 Time histories for two components of velocity and acceleration at the seismostation S2, respectively |
图 4是S1台站记录的地震波随时间变化的曲线,其中(a)、(b)分别表示质点振动速度在x和y方向随着时间的变化,而图(c)、(d)分别表示质点振动加速度在x和y方向上的变化.图中显示,大约在震后10 s S1台记录到地震波的到达,最大振动速度值超过1.0 m·s-1,最大峰值加速度绝对值高达5.6 m·s-2 (在x和y两个方向的峰值都约为4 m·s-2). 图 5表示S2台站记录的地震波随时间变化的曲线.图中显示,大约在震后38 s,S2台开始记录到地震波的到达,最大振动速度值超过2.0 m·s-1,最大峰值加速度高达20 m·s-2,其幅值远远超过S1台站记录的结果,说明超剪切破裂对地震波的放大作用,特别对强地面运动的放大作用更为显著.
通过仔细分析还发现,在高川右弯将地震破裂由亚剪切转换为超剪切过程中,不需要任何时间停顿;这种情况与断层阶区对超剪切破裂的作用不同.不管是哪种类型的断层阶区,在将亚剪切破裂转换为超剪切破裂的过程中都需要一定的时间停顿(如:Harris et al., 1991; Harris and Day, 1993; Ryan and Oglesby, 2014; 袁杰和朱守彪, 2014b, 2017).
上述有限元计算结果与前人利用地震波反演的汶川地震断层破裂过程有一定的可比性.如:杜海林等(2009)利用美国阿拉斯加台阵的地震记录,反演给出了汶川地震的总破裂长度,并认为整个震源过程可分为两大阶段:前段持续时间为50 s,破裂长度约110 km,破裂传播的平均速度为2.2 km·s-1, 后段持续时间约40 s,长度约190 km,平均破裂速度为4.8 km·s-1,超过S波速度.同样,Wang等(2016)利用欧洲台站地震记录,反演给出了类似的结果:第一阶段为40 s,破裂平均速度为1.8 km·s-1;第二阶段为60 s, 平均破裂速度为4.5 km·s-1.可见,地震波反演给出的断层破裂速度与本文正演计算给出的断层破裂速度结果大体相同.但是,本研究模拟给出的破裂速度比反演结果要高,如在破裂开始的第一阶段本文给出平均破裂速度为2.79 km·s-1, 比杜海林等(2009)以及Wang等(2016)反演给出的破裂平均速度分别为2.2 km·s-1及1.8 km·s-1在量值上都要高,其主要原因是:映秀—北川断裂带上存在很多断层阶区,如:清平阶区(Ren et al., 2010).当破裂穿过这些断层阶区时,破裂要发生时间停顿,这样其平均破裂速度就会变小;但本研究没有考虑这些断层阶区的作用,所以本文给出的破裂速度比反演结果要高.这也可能是多数反演模型没有探索到汶川地震中断层出现超剪切破裂的主要原因.
2.2 超剪切破裂导致北川地区地震灾害大大增加由于地震灾害是地面运动加速度直接作用的结果,加速度越大,地面物体受到的地震作用力越大,相应地,地震灾害就会越严重.因此,下面进一步研究强地面运动加速度的空间分布,分析断层破裂传播速度与强地面运动加速度之间的关联,进而考察北川地区的致灾机制.
数值模拟中,通过有限元计算的后处理程序,导出研究区域每个节点振动加速度随着时间的变化(如图 4—5所示的结果).然后将其最大值(峰值)取出,再绘制成空间等值线云图(见图 6).由图 6可见,峰值加速度的高值区主要分布在近断层附近.进一步考察还发现,峰值加速度大小随离开断层距离的增加而迅速衰减,但在不同的断层段衰减速度不同.在映秀—高川断层段,加速度衰减很快,图中的红色区域(加速度高于17.5 m·s-2)只分布在近断层附近,呈现出非常狭小的粗线;但在高川—南坝断层段,加速度高值区的红色区域明显加宽,呈现出一个较宽的条带;并且高川—南坝断层段红色条带的宽度比映秀—高川段的要大5~10倍.说明当断层发生超剪切破裂时,地震动在空间的衰减变慢,该结果与前人研究的非常吻合(Dunham and Archuleta, 2005; Bernard and Baumont, 2005; Dunham and Bhat, 2008; Andrews, 2010; Bizzarri et al., 2010; Cruz-Atienza and Olsen, 2010; Vallée and Dunham, 2012; Yue et al., 2013; Huang et al., 2016; 袁杰和朱守彪; 2017;朱守彪等, 2017).特别是在北川附近,峰值加速度高值区域的红色范围最大,这就从物理上解释了为什么在北川地区地震灾害会那么严重.

|
图 6 强地面运动峰值加速度等值线云图 红色表示加速度峰值大于或等于17.5 m·s-2的区域. Fig. 6 Contour map of PGA spatial distribution Thered color zone stands for the value of PGA is equal to or greater than 17.5 m·s-2. |
详细分析还发现,峰值加速度高值区与断层破裂速度密切相关:映秀—高川断层段,断层发生亚剪切破裂,高值区仅限于近断层区域,空间上几乎为一条粗线,范围很小;但在高川—南坝断层段,断层发生了超剪切破裂,峰值加速度高值区域明显增大,为一条带.由此可见,当发生超剪切破裂时,峰值加速度的高值区明显增大,因此造成的地震破坏范围也大大增强,所以,与同等水平的地震相比,超剪切地震的破坏力会明显增强.其原因是当发生超剪切破裂时,地震波发生相长干涉,形成马赫波;马赫锥上的地震动为所有时刻断层破裂辐射地震波的合成,其振幅会大大增加(Bernard and Baumont, 2005; Dunham and Archuleta, 2005; Bhat et al., 2007;Dunham and Bhat, 2008; Bizzarri et al., 2010; Vallée and Dunham, 2012;朱守彪等,2017),导致地震灾害显著增强.
实际上,汶川地震震中的映秀地区,强地面运动加速度也很大,但文中的有限元模拟结果不能体现这种情况,主要原因是本文为二维模型,没有考虑实际的三维地质结构,没有考虑映秀—高川断层段的逆冲错动特征;也没有考虑龙门山断裂带前山断裂及后山断裂的动力学影响及其断层之间的相互作用.所以要得到更好的结果,需要今后进行三维结构地震破裂的模拟.
3 问题讨论本文的有限元数值模拟,尽管其模型进行了许多简化(断层假定为包含高川右弯的二维情形、初始应力场均匀、介质均匀且假设为线弹性等),但不影响我们研究北川地区地震灾害特别严重的核心物理问题;同时,也能够抓住汶川地震中断层破裂的最基本特征,即:断层破裂速度经过高川右弯后转换为超剪切破裂,北川地区的峰值加速度大,导致该地区破坏严重.所以,本文的结果可以认为是汶川地震破裂过程的一级近似.
此外,就高川右弯对于汶川地震破裂过程的影响还做了进一步的考察分析,先后构造了其他多种模型进行计算比较:(1)断层中不存在高川右弯,模型中将映秀—北川断裂带视作一条直线,然后在其他模型参数都保持不变的情况下重复有限元模拟计算,结果发现该情形下不可能产生超剪切破裂,北川地区的地震灾害也没有那么严重.(2)让断层在高川右弯附近的不连续区域增大,模拟发现当断层的不连续区域增大到一定程度,破裂就无法跳跃继续传播,高川右弯就阻止了断层破裂继续前进,这样产生的地震其震级会显著减小,北川地区的地震灾害也会大大降低.(3)若整个映秀—北川断裂带的断层都保持连续(全部贯通),即图 2中红色曲线不存在时(断层在高川右弯处都保持连续),那么此种模型不仅能够产生超剪切破裂,而且超剪切破裂还会返回向震源方向传播(西南方向),即本来愈合的映秀—高川断层段还会再一次重复破裂,这样映秀地区的地震灾害会大大增加.因此,本文的计算结果证实高川右弯处应该存在不连续的断层段,否则断层破裂会向回传播.
将初始应力场的方位改变,Duan(2010)模拟了汶川地震的破裂过程,发现初始应力场的不均匀性对破裂行为影响很大.但Duan的模型中,断层假定为平面,且保持其倾角为33°不变,更没有考虑高川右弯的影响.所以,今后应该根据实际断层几何、实际的初始应力状态以及实际的介质结构等构造更为合理的数值模型,获得更加符合实际的模拟结果.
4 结论本文利用有限单元方法对2008年汶川地震的断层自发破裂过程进行了数值模拟,其主要结论如下.
高川右弯对于汶川地震的破裂过程起着非常关键性作用,高川右弯不仅没有阻碍地震破裂继续前行,反而促进地震破裂的传播,导致了断层破裂速度由亚剪切波速度转换为超剪切,并且转换过程不需要时间停顿.由于超剪切破裂的产生,形成马赫波,导致地震动被显著放大,计算给出的强地面运动峰值加速度等值线云图空间分布显示,峰值加速度大小与断层破裂速度密切相关,亚剪切破裂引起的峰值加速度数值小,强地面运动衰减快,但超剪切地震破裂产生的地面运动峰值加速度数值大,并且在空间衰减慢.北川地区由于其断层产生了超剪切破裂,所以在北川及周边地区的峰值加速度量值大、分布范围广,从而造成北川地区的地震灾害特征严重.
若映秀—北川断裂带上没有高川右弯(即断层面平直),则断层不会产生超剪切破裂,也就不会在北川地区造成严重的地震灾害;若高川右弯的不连续程度增大,则其会阻止破裂继续前行,破裂会在此终止,这样北川地区也不会发生严重的地震灾害.但是,若高川右弯附近的断层全部贯通(不存在间断),那么不仅会促进超剪切破裂的发生,而且产生的超剪切破裂还会返回向映秀(震源)方向传播,原先愈合的断层会重新发生破裂,这样会造成更为严重的地震灾害.因此,本文的模拟结果将有助于对汶川地震破裂过程的认识,有助于理解为什么远离震中的北川地区地震灾害特别严重的现象.
致谢两位审稿专家提出了十分宝贵的建议,在此表示衷心地感谢!
Andrews D J.
2010. Ground motion hazard from supershear rupture. Tectonophysics, 439(3-4): 216-221.
|
|
Bernard P, Baumont D.
2005. Shear Mach wave characterization for kinematic fault rupture models with constant supershear rupture velocity. Geophysical Journal International, 162(2): 431-447.
DOI:10.1111/j.1365-246X.2005.02611.x |
|
Bhat H S, Dmowska R, King G C P, et al.
2007. Off-fault damage patterns due to supershear ruptures with application to the 2001 MW8.1 Kokoxili (Kunlun) Tibet earthquake. Journal of Geophysical Research: Solid Earth, 112(B6): B06301.
DOI:10.1029/2006JB004425 |
|
Bizzarri A, Dunham E M, Spudich P.
2010. Coherence of Mach fronts during heterogeneous supershear earthquake rupture propagation: Simulations and comparison with observations. Journal of Geophysical Research: Solid Earth, 115(B8): B08301.
DOI:10.1029/2009JB006819 |
|
Cruz-Atienza V M, Olsen K B.
2010. Supershear Mach-waves expose the fault breakdown slip. Tectonophysics, 493(3-4): 285-296.
DOI:10.1016/j.tecto.2010.05.012 |
|
Das S.
2007. The need to study speed. Science, 317(5840): 905-906.
DOI:10.1126/science.1142143 |
|
De Michele M, Raucoules D, De Sigoyer J, et al.
2010. Three-dimensional surface displacement of the 2008 May 12 Sichuan earthquake (China) derived from Synthetic Aperture Radar: evidence for rupture on a blind thrust. Geophysical Journal International, 183(3): 1097-1103.
DOI:10.1111/j.1365-246X.2010.04807.x |
|
Deng Q D, Chen G H, Zhu A L.
2011. Discussion of rupture mechanisms on the seismogenic fault of the 2008 MS8.0 Wenchuan earthquake. Science China Earth Sciences, 54(9): 1360-1377.
DOI:10.1007/s11430-011-4230-1 |
|
Du H L, Xu L S, Chen Y T.
2009. Rupture process of the 2008 great Wenchuan earthquake from the analysis of the Alaska-array data. Chinese Journal of Geophysics, 52(2): 372-378.
|
|
Duan B C.
2010. Role of initial stress rotations in rupture dynamics and ground motion: A case study with implications for the Wenchuan earthquake. Journal of Geophysical Research: Solid Earth, 115(B5): B05301.
DOI:10.1029/2009JB006750 |
|
Dunham E M, Archuleta R J.
2005. Near-source ground motion from steady state dynamic rupture pulses. Geophysical Research Letters, 32(3): L03302.
DOI:10.1029/2004GL021793 |
|
Dunham E M, Bhat H S.
2008. Attenuation of radiated ground motion and stresses from three-dimensional supershear ruptures. Journal of Geophysical Research: Solid Earth, 113(B8): B08319.
DOI:10.1029/2007JB005182 |
|
Feng G C, Hetland E A, Ding X L, et al.
2010. Coseismic fault slip of the 2008 MW7.9 Wenchuan earthquake estimated from InSAR and GPS measurements. Geophysical Research Letters, 37(1): L01302.
DOI:10.1029/2009GL041213 |
|
Fielding E J, Sladen A, Li Z H, et al.
2013. Kinematic fault slip evolution source models of the 2008 M7.9 Wenchuan earthquake in China from SAR interferometry, GPS and teleseismic analysis and implications for Longmen Shan tectonics. Geophysical Journal International, 194(2): 1138-1166.
DOI:10.1093/gji/ggt155 |
|
Fu B H, Shi P L, Wang P, et al.
2009. Geometry and kinematics of the 2008 Wenchuan earthquake surface ruptures around the Qushan Town of Beichuan County, Sichuan: implications for mitigation of seismic and geologic disasters. Chinese Journal of Geophysics, 52(2): 485-495.
|
|
Harris R A, Archuleta R J, Day S M.
1991. Fault steps and the dynamic rupture process: 2-D numerical simulations of a spontaneously propagating shear fracture. Geophysical Research Letters, 18(5): 893-896.
DOI:10.1029/91GL01061 |
|
Harris R A, Day S M.
1993. Dynamics of fault interaction: Parallel strike-slip faults. Journal of Geophysical Research: Solid Earth, 98(B3): 4461-4472.
DOI:10.1029/92JB02272 |
|
Hibbitt H, Karlsson B, Sorensen P. 2006. ABAQUS: Theory Manual.
|
|
Huang Y H, Ampuero J P, Helmberger D V.
2016. The potential for supershear earthquakes in damaged fault zones-theory and observations. Earth and Planetary Science Letters, 433: 109-115.
DOI:10.1016/j.epsl.2015.10.046 |
|
Liu Q, Li Y, Chen J, et al.
2009. Wenchuan MS8.0 earthquake: preliminary study of the S-wave velocity structure of the crust and upper mantle. Chinese Journal of Geophysics, 52: 309-319.
|
|
Liu Q Y, Van Der Hilst R D, Li Y, et al.
2014. Eastward expansion of the Tibetan Plateau by crustal flow and strain partitioning across faults. Nature Geoscience, 7(5): 361-365.
DOI:10.1038/ngeo2130 |
|
Pan J W, Li H B, Si J L, et al.
2014. Rupture process of the Wenchuan earthquake (MW7.9) from surface ruptures and fault striations characteristics. Tectonophysics, 619: 13-28.
|
|
Ren J, Chen G, Xu X, et al.
2010. Surface rupture of the 2008 Wenchuan, China, earthquake in the Qingping stepover determined from geomorphologic surveying and excavation, and its tectonic implications. Bulletin of the Seismological Society of America, 100(5B): 2651-2659.
DOI:10.1785/0120090267 |
|
Ryan K J, Oglesby D D.
2014. Dynamically modeling fault step overs using various friction laws. Journal of Geophysical Research: Solid Earth, 119(7): 5814-5829.
DOI:10.1002/2014JB011151 |
|
Shen Z K, Sun J B, Zhang P Z, et al.
2009. Slip maxima at fault junctions and rupturing of barriers during the 2008 Wenchuan earthquake. Nature Geoscience, 2(10): 718-724.
DOI:10.1038/ngeo636 |
|
Tapponnier P, Molnar P.
1977. Active faulting and tectonics in China. Journal of Geophysical Research, 82(20): 2905-2930.
DOI:10.1029/JB082i020p02905 |
|
Tong X P, Sandwell D T, Fialko Y.
2010. Coseismic slip model of the 2008 Wenchuan earthquake derived from joint inversion of interferometric synthetic aperture radar, GPS, and field data. Journal of Geophysical Research: Solid Earth, 115(B4): B04314.
DOI:10.1029/2009JB006625 |
|
Vallée M, Dunham E M.
2012. Observation of far-field Mach waves generated by the 2001 Kokoxili supershear earthquake. Geophysical Research Letters, 39(5): L05311.
DOI:10.1029/2011GL050725 |
|
Wang C Y, Han W B, Wu J P, et al.
2007. Crustal structure beneath the eastern margin of the Tibetan Plateau and its tectonic implications. Journal of Geophysical Research: Solid Earth, 112(B7): B07307.
DOI:10.1029/2005JB003873 |
|
Wang C Y, Mooney W D, Ding Z F, et al.
2009. Shallow seismic structure of Kunlun fault zone in northern Tibetan Plateau, China: implications for the 2001 MS8.1 Kunlun earthquake. Geophysical Journal International, 177(3): 978-1000.
DOI:10.1111/gji.2009.177.issue-3 |
|
Wang D, Mori J, Koketsu K.
2016. Fast rupture propagation for large strike-slip earthquakes. Earth and Planetary Science Letters, 440: 115-126.
DOI:10.1016/j.epsl.2016.02.022 |
|
Wang Q, Qiao X J, Lan Q G, et al.
2011. Rupture of deep faults in the 2008Wenchuan earthquake and uplift of the Longmen Shan. Natural Geoscience, 4(9): 634-640.
DOI:10.1038/NGEO1210 |
|
Wang W M, Zhao L F, Li J, et al.
2008. Rupture process of the MS8.0 Wenchuan earthquake of Sichuan, China. Chinese Journal of Geophysics, 51(5): 1403-1410.
|
|
Xu C J, Liu Y, Wen Y M, et al.
2010. Coseismic slip distribution of the 2008 MW7.9 Wenchuan earthquake from joint inversion of GPS and InSAR data. Bulletin of the Seismological Society of America, 100(5B): 2736-2749.
DOI:10.1785/0120090253 |
|
Xu X W, Wen X Z, Ye J Q, et al.
2008. The MS8.0 Wenchuan earthquake surface ruptures and its seismogenic structure. Seismology and Geology, 30(3): 597-629.
|
|
Yuan J, Zhu S B.
2014a. FEM simulation of the dynamic processes of fault spontaneous rupture. Chinese Journal of Geophysics, 57(1): 138-156.
|
|
Yuan J, Zhu S B.
2014b. Effects of stepover on rupture propagation. Chinese Journal of Geophysics, 57(5): 1510-1521.
DOI:10.6038/cjg20140515 |
|
Yuan J, Zhu S B.
2016. Distributions of strong ground motion due to dynamic ruptures across a bimaterial fault: Implications for seismic hazard analyses. Journal of Asian Earth Sciences, 131: 81-94.
DOI:10.1016/j.jseaes.2016.09.010 |
|
Yuan J, Zhu S B.
2017. Numerical simulation of seismic supershear rupture process facilitated by a fault stepover. Chinese Journal of Geophysics, 60(1): 212-224.
DOI:10.6038/cjg20170118 |
|
Yue H, Lay T, Freymueller J T, et al.
2013. Supershear rupture of the 5 January 2013 Craig, Alaska (MW7.5) earthquake. Journal of Geophysical Research: Solid Earth, 118(11): 5903-5919.
DOI:10.1002/2013JB010594 |
|
Zhang P Z.
2008. Present-day deformation, strain partition and dynamic processes on the eastern margin of the Tibetan plateau. Science in China Series D: Earth Sciences, 38(9): 1041-1056.
|
|
Zhang P Z, Wen X Z, Shen Z K, et al.
2010. Oblique, high-angle, listric-reverse faulting and associated development of strain: The Wenchuan earthquake of May 12, 2008, Sichuan, China. Annual Review of Earth and Planetary Sciences, 38(1): 353-382.
DOI:10.1146/annurev-earth-040809-152602 |
|
Zhang Y, Wang R, Zschau J, et al.
2014. Automatic imaging of earthquake rupture processes by iterative deconvolution and stacking of high-rate GPS and strong motion seismograms. Journal of Geophysical Research: Solid Earth, 119: 5633-5650.
DOI:10.1002/2013JB010469 |
|
Zhu S B, Shi Y L, Cai Y E.
2006. The contemporary tectonic strain rate field of continental China predicted from GPS measurements and its geodynamics implications. Pure and Applied Geophysics, 163: 1477-1493.
DOI:10.1007/s00024-006-0087-1 |
|
Zhu S B, Shi Y L.
2007. Origin of tectonic stresses in the Chinese continent and adjacent areas. Science in China Series D: Earth Sciences, 50(1): 67-74.
DOI:10.1007/s11430-007-2064-7 |
|
Zhu S B, Zhang P Z.
2009. A study on the dynamical mechanisms of the Wenchuan MS8.0 earthquake, 2008. Chinese Journal of Geophysics, 52(2): 418-427.
|
|
Zhu S B, Zhang P Z.
2010. Numeric modeling of the strain accumulation and release of the 2008 Wenchuan, Sichuan, China, Earthquake. Bulletin of the Seismological Society of America, 100(5B): 2825-2839.
DOI:10.1785/0120090351 |
|
Zhu S B, Shi Y L.
2011. Estimation of GPS strain rate and its error analysis in the Chinese continent. Journal of Asian Earth Sciences, 40(1): 351-362.
DOI:10.1016/j.jseaes.2010.06.007 |
|
Zhu S B.
2013. Numerical simulation of dynamic mechanisms of the 2008 Wenchuan MS8.0 earthquake: implications for earthquake prediction. Natural Hazards, 69(2): 1261-1279.
DOI:10.1007/s11069-013-0629-7 |
|
Zhu S B, Zhang P Z.
2013. FEM simulation of interseismic and coseismic deformation associated with the 2008 Wenchuan earthquake. Tectonophysics, 584: 64-80.
DOI:10.1016/j.tecto.2012.06.024 |
|
Zhu S B, Yuan J.
2016. Mechanisms for the fault rupture of the 2008 Wenchuan earthquake (MS=8.0) with predominately unilateral propagation. Chinese Journal of Geophysics, 59(10): 4063-4074.
DOI:10.6038/cjg20161111 |
|
Zhu S B, Yuan J, Miao M.
2017. Dynamic mechanisms for supershear rupture processes of the Yushu earthquake (MS=7.1). Chinese Journal of Geophysics, 60(10): 3832-3843.
DOI:10.6038/cjg20171013 |
|
杜海林, 许力生, 陈运泰.
2009. 利用阿拉斯加台阵资料分析2008年汶川大地震的破裂过程. 地球物理学报, 52(2): 372–378.
|
|
刘启元, 李昱, 陈九辉, 等.
汶川MS8.0地震:地壳上地幔S波速度结构的初步研究. 地球物理学报, 52(2): 309–319.
|
|
王卫民, 赵连锋, 李娟, 等.
2008. 四川汶川8.0级地震震源过程. 地球物理学报, 51(5): 1403–1410.
|
|
徐锡伟, 闻学泽, 叶建青, 等.
2008. 汶川MS8.0地震地表破裂带及其发震构造. 地震地质, 30(3): 597–629.
|
|
袁杰, 朱守彪.
2014a. 断层自发破裂动力过程的有限单元法模拟. 地球物理学报, 57(1): 138–156.
|
|
袁杰, 朱守彪.
2014b. 断层阶区对震源破裂传播过程的控制作用研究. 地球物理学报, 57(5): 1510–1521.
DOI:10.6038/cjg20140515 |
|
袁杰, 朱守彪.
2017. 断层阶区对产生超剪切地震破裂的促进作用. 地球物理学报, 60(1): 212–224.
DOI:10.6038/cjg20170118 |
|
张培震. 2008. 青藏高原东缘川西地区的现今构造变形、应变分配与深部动力过程, 中国科学D辑: 38(9): 1041-1056.
http://www.oalib.com/references/18985988 |
|
张勇, 冯万鹏, 许力生, 等.
2008. 2008年汶川大地震的时空破裂过程. 中国科学D辑:地球科学, 38(10): 1186–1194.
|
|
朱守彪, 张培震.
2009. 2008年汶川MS8.0地震发生过程的动力学机制研究. 地球物理学报, 52(2): 418–427.
|
|
朱守彪, 袁杰.
2016. 2008年汶川大地震单侧破裂过程的动力学机制研究. 地球物理学报, 59(11): 4063–4074.
DOI:10.6038/cjg20161111 |
|
朱守彪, 袁杰, 缪淼.
2017. 青海玉树地震(MS=7.1)产生超剪切破裂过程的动力学机制研究. 地球物理学报, 60(10): 3832–3843.
DOI:10.6038/cjg20171013 |
|
 2018, Vol. 61

