 2018, Vol. 61


2. 浙江大学海洋科学系, 浙江舟山 316021;
3. 青岛海洋科学与技术国家实验室海洋矿产资源评价与探测技术功能实验室, 山东青岛 266237;
4. 中国地震台网中心, 北京 100045
2. Department of Marine Sciences, Zhejiang University, Zhejiang Zhoushan 316021, China;
3. Laboratory of Marine Mineral Resources, Qingdao National Laboratory for Marine Science and Technology, Shandong Qingdao 266237, China;
4. China Earthquake Networks Center, Beijing 100045, China
印度板块与欧亚板块的碰撞与会聚导致青藏高原东缘成为我国地震活动最为复杂和强烈的区域之一(图 1).自2008年5月12日汶川MS8.0地震以后,该区域先后发生了4次M≥6.5大地震,即2013年芦山MS7.0、2013年岷县MS6.6、2014年鲁甸MS6.5和2017年九寨沟MS7.0地震.青藏高原东缘大地震频发与该区域复杂的地质构造、地壳形变、岩石温度和富含流体等因素密切相关(胡亚平等, 2017).一般而言,发震层深度主要受控于岩石圈力学性质的变化,即脆-塑性转换带的深度变化,而温度则是控制岩石脆-塑性变形的一个重要因素(McKenzie et al., 2005; Burov and Watts, 2006; Chen et al., 2013; 王健等, 2016).

|
图 1 青藏高原东缘构造及震中分布图 黑色三角形为地震台站,蓝色圆点为原始地震目录震中,红色星号自北向南分别为2013年岷县MS6.6,2017年九寨沟MS7.0,2008年汶川MS8.0,2013年芦山MS7.0以及2014鲁甸MS6.5地震.彩色方块为地表热流测量,红色方框为地震重定位范围.EKL:东昆仑断裂;LMS:龙门山断裂带;XSH:鲜水河断裂. Fig. 1 Tectonic map and epicenter distribution in the eastern margin of the Tibetan Plateau Black triangles are seismic stations, blue dots are original epicenters from the catalogue. Red stars represent the 2013 MS6.6 Minxin, 2017 MS7.0 Jiuzhaigou, 2008 MS8.0 Wenchuan, 2013 MS7.0 Lushan and 2014 MS6.5 Ludian earthquakes. Colored squares are surface heat flow measurements. Red lines delimit the region for relocation in this study. EKL: East Kunlun fault; LMS: Longmenshan fault zone; XSH: Xianshuihe fault. Black triangles are seismic stations, blue dots are original epicenters from the catalogue. Red stars represent the 2013 MS6.6 Minxin, 2017 MS7.0 Jiuzhaigou, 2008 MS8.0 Wenchuan, 2013 MS7.0 Lushan and 2014 MS6.5 Ludian earthquakes. Colored squares are surface heat flow measurements. Red lines delimit the region for relocation in this study. EKL: East Kunlun fault; LMS: Longmenshan fault zone; XSH: Xianshuihe fault. |
近年来,许多学者利用重磁、电磁与地震学方法对青藏高原东缘进行了详细的密度、电性和速度结构成像(张季生等, 2009;闫亚芬等, 2016;胡亚平等, 2017;李军等, 2017),对该区域的地壳结构与地震活动关系研究取得了大量认识与成果.然而,由于青藏高原东缘的地表热流测量主要分布于四川盆地内部,地震活动强烈的龙门山断裂带及鲜水河断裂以西的区域则缺乏热流测量(图 1).因此,很难有效地研究青藏高原东缘整个区域的地壳温度结构与地震活动之间的相关性.由磁异常数据反演得到的居里点深度Zb则可以很好地用于区域深部地壳温度结构的研究(Tanaka et al., 1999; Li et al, 2010, 2012, 2013; Li, 2011; Wang and Li, 2015; 王健等, 2016).
本文应用双差定位法(Waldhauser and Ellsworth, 2000)对2008—2017年青藏高原东缘发生的地震进行重定位,然后根据磁异常数据反演青藏高原东缘的居里点深度,并分析该区域地震活动与居里点深度之间的相关性.在地表热流测量值的约束下,探讨汶川地震及该区域其他大地震震源区温度及其动力学意义.
1 地震重定位受定位方法、速度模型等因素的影响,在研究地震活动性及其相关的科学问题之前,必须对原始地震目录中的定位结果进行重定位.
我们收集了2008—2017年发生在青藏高原东缘M≥2.0的6406次地震(图 1),获得了由267个台站记录到的203683条P波和166693条S波到时资料.为了确保重定位结果的可靠性,剔除台站记录数小于6的地震,并选择P波和S波震中距在250 km范围内的到时资料,得到6365个地震事件.然后采用最大空间距离为10 km的搜索半径对地震事件进行配对,最终共有5652次地震配对并参与重新定位.由于四川盆地东、西两侧地壳厚度与速度结构均存在较大差异,我们采用速度分区方法(王健等, 2016),选取赵珠和陈农(1995)和赵珠等(1997)的一维速度模型作为研究区东部区域的参考地壳速度模型,选取黄媛等(2008)的一维速度模型作为研究区西部区域的参考地壳速度模型(图 2f).将P波走时残差的权重设为1.0,S波走时残差的权重设为0.5,利用共轭梯度法求取阻尼最小二乘解.

|
图 2 (a) 青藏高原东缘地震重定位结果,其中2008年汶川MS8.0地震重定位结果陈九辉等(2009).红线为4条剖面位置,紫线为研究区东、西部速度模型分界线;(b)和(c)分别为重定位后沿纬度和经度方向的震中分布侧面图;(d)和(e)分别为重定位前、后震源深度统计图;(f)为速度模型. Fig. 2 (a) Epicenter distribution after relocation. The relocation of the 2008 MS8.0 Wenchuan earthquake is from Chen et al. (2009). Red lines are locations of four profiles, and purple line is the boundary between two different velocity models used in this study; (b) and (c) are side views of focal depths along the latitude and longitude directions after relocation, respectively; (d) and (e) are histograms of focal depths before and after relocation, respectively; (f) shows velocity models, red and black lines represent western and eastern velocity models, respectively |
在5652个可进行重新定位的地震数据中,有731个地震事件在迭代反演过程中由于分布比较零散无法配对或重定位到地表以上,导致与其他地震完全失去联系而被剔除.最终,采用不同的地壳速度分区模型,获得了4921个高质量的地震事件(图 2a),走时均方根残差由重定位前的0.82 s下降至重定位后的0.38 s(东部)和0.37 s(西部),定位偏差在东西、南北及深度方向的平均相对误差分别为0.62 km(东部)和0.61 km(西部)、0.60 km(东部)和0.60 km(西部)以及0.87 km(东部)和0.94 km(西部).
从平面上看,重定位后的震中更加集中分布于龙门山断裂带、鲜水河断裂以及四川盆地南缘(图 2a);从深部剖面上看,重定位后的大多数震源深度在5~20 km以内(图 2b和c),且分布形态更接近于正态分布,其峰值出现在15~20 km内(图 2e),而重定位前的震源深度分布则出现多个峰值,如5、10、15、20 km(图 2d).本文对2008年MS8.0汶川地震之后发生的4次大地震(2013年芦山MS7.0、2013年岷县MS6.6、2014年鲁甸MS6.5和2017年九寨沟MS7.0地震)的重定位结果与前人结果相比,深度差异约为±2 km(表 1).
|
|
表 1 青藏高原东缘M≥6.5地震重定位结果 Table 1 Relocations of M≥6.5 earthquakes in the eastern margin of the Tibetan Plateau |
美国国家地球物理数据中心(NGDC)根据磁异常模型EMAG2(Maus et al., 2009)和卫星磁异常模型MF6(Maus et al., 2008)构建了全球720阶球谐磁异常模型NGDC-720(Maus, 2010a).该模型可以计算任意经纬度处不同观测高度的三分量磁异常,因而具有广阔的应用价值.由于航磁异常测网大小不同,使得不同测区的网格合并时造成磁异常数据长波长组分存在噪声.另外,不同的测量年代也使得正常场校正时因选择不同的参考模型造成误差.卫星磁异常模型MF6能提供全球统一且更为准确的长波长(>330 km)磁异常(Langel and Hinze, 1998; Maus, 2010a).Arnaiz-Rodríguez和Orihuela(2013)根据中心点法(见第3节)分别利用EMM2010(同样基于EMAG2和MF6模型)(Maus, 2010b)和航磁异常计算了委内瑞拉东部的居里点深度,发现二者结果很相似.Gao等(2013, 2015b)分别利用NGDC-720模型研究了新疆和鄂尔多斯盆地的磁异常及居里点深度.文丽敏等(2017)根据NGDC-720模型计算了云南地区的磁异常.本文根据NGDC-720模型计算青藏高原东缘区域的三分量磁异常及梯度张量异常,并分析其与地震活动之间的相关性.
地磁场的位函数可表达为球谐形式(Langel and Hinze, 1998),公式为

|
(1) |
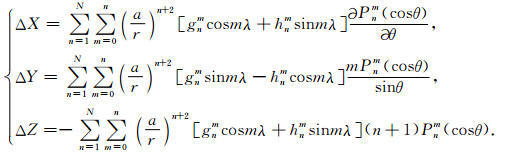
其中a为地球半径(6371.2 km),r为地心坐标,θ和λ分别为余纬和经度,gnm和hnm为高斯系数,Pnm(cosθ)为n阶m次Schmidt准归一化缔合勒让德函数.地磁场三分量则分别表示为球谐模型,公式为
|
(2) |
应用式(2)可以分别计算16~720阶的三分量磁异常,进而计算其梯度张量异常.这些分量异常类似方向滤波,可以强化相应方向上的构造特征,特别是垂直分量与垂直梯度张量相当于化极磁异常,可以更好地刻画磁源体的边界信息.
图 3显示了观测高度为0 km的总场及其三分量磁异常与重定位后的震中分布.沿龙门山断裂带分布的地震主要对应负磁异常,而沿鲜水河断裂的地震分布则呈现明显的南北分段特征,其中北段对应负磁异常,南段对应正磁异常.虽然总场显示四川盆地南缘部分地震位于正磁异常区域(图 3a),但垂直分量显示这些地震仍然位于负磁异常区域(图 3d).2017年九寨沟MS7.0地震位于负磁异常区域,2013年岷县MS6.6地震则位于磁平静区域.2008年汶川MS8.0地震则位于2个磁异常峰值之间的负磁异常区域.类似地,2013年芦山MS7.0地震和2014年鲁甸MS6.5地震也位于2个磁异常峰值之间的负磁异常区域.梯度张量图则更加明显的显示了这3个地震均位于2个正梯度张量之间的负梯度张量区域(图 4d).

|
图 3 (a) 青藏高原东缘NGDC-720总场磁异常;(b)、(c)和(d)分别为X、Y和Z方向分量磁异常 (a)—(d)观测高度为0 km.黑色圆点为重定位后震中分布. Fig. 3 (a) Total-field magnetic anomalies of NGDC-720 in the eastern margin of the Tibetan Plateau; (b), (c) and (d) are the magnetic anomalies of X-, Y-and Z-directions, respectively The observation altitudes of (a)—(d) are 0 km. Black dots are the epicenters after relocation. |

|
图 4 (a)、(b)、(c)和(d)分别为XY、XZ、YZ和ZZ方向梯度张量磁异常(观测高度为10 km) Fig. 4 (a), (b), (c) and (d) are the gradient tensors of XY-, XZ-, YZ-and ZZ-directions, respectively (The observation altitudes are 10 km) |
常用的根据磁异常数据反演居里点深度(Zb)方法一般有2种,一种称为拐点法(spectral peak method)(Connard et al., 1983),另一种称为中心点法(centroid method)(Tanaka et al., 1999).这些方法是基于Zb对应于深部一个起伏的温度界面,位于此界面之下由于岩石温度超过其居里温度而变为顺磁性物质.近年来,许多学者应用分形磁化模型反演居里点深度(Bouligand et al., 2009; Bansal et al., 2011; Li et al., 2013).本文采用Li等(2013)的方法,应用三维分形磁化模型计算青藏高原东缘的居里点深度,公式为
|
(3) |
|
(4) |
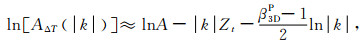
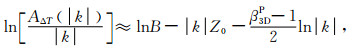
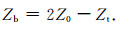
其中,AΔT为磁异常的径向平均振幅谱,k为波数,Zt和Z0分别为磁源体的顶界和中心点深度,βP3D为三维功率谱分形指数,A和B为常数.根据方程(3)和(4)可以分别在中-高波数域和低波数域内拟合直接线求得Zt和Z0,则居里点深度的计算公式为
|
(5) |
Li和Wang(2016)和Li等(2017)根据EMAG2磁异常,应用三维分形指数3.0分别计算了东亚和全球的居里点深度.Witter等(2018)根据热模拟结果认为Li等(2017)的全球居里点深度模型在加拿大Yukon地区非常符合实际地质特征.Li和Wang(2016)在研究东亚居里点深度时,认为三维分形指数3.0较符合实际地质构造.因此,本文选取βP3D=3.0计算青藏高原东缘的居里点深度.为了捕获最深部磁源体的信息、提高居里点深度的分辨率并降低其误差,我们采用窗口大小为100.8×100.8 km2和201.6×201.6 km2分别计算Zb,并取其平均值为最终的居里点深度.
为了消除浅层磁源体的影响,本文选取观测高度为10 km的NGDC-720磁异常计算Zb.居里点深度结果显示(图 5),青藏高原东缘的居里点深度约为20~40 km,平均值约为31 km,其计算拟合误差主要分布在±4 km以内(图 6a),与Li和Wang(2016)计算的居里点深度差异主要在±5 km以内(图 6b).四川盆地和龙门山断裂带西北侧主要呈现较大的居里点深度,而鲜水河断裂西南侧和秦岭则显示较小的居里点深度.这一居里点深度变化样式与Gao等(2015a)利用POMME-6.2磁异常计算得到的居里点深度变化样式类似.龙门山断裂带南段东侧与鲜水河断裂南段西侧显示为较小的居里点深度,与胡亚平等(2017)和王志等(2017)发现的低波速异常区域较为一致,表明这些区域受到深部热物质的影响.这些区域还呈现出高泊松比和低电阻率的特征,可能与深部流体侵入或下地壳部分熔融有关(胡亚平等, 2017; 王志等, 2017).沿龙门山断裂带分布的地震以及四川盆地南缘地震主要分布在居里点深度较大的区域,而沿鲜水河断裂分布的地震则位于居里点深度过渡区域(图 5).除了2013年岷县MS6.6地震以外,该区域其他M≥6.5地震均位于居里点深度较大的区域.

|
图 5 青藏高原东缘居里点深度 Fig. 5 Curie-point depths in the eastern margin of the Tibetan Plateau |

|
图 6 (a) 居里点深度拟合误差;(b)本文与Li and Wang(2016)居里点深度差异 Fig. 6 (a) Errors of Curie depth estimation; (b) Differences between Curie depths of this study and of Li and Wang (2016) |
根据居里点深度可以计算青藏高原东缘磁性层的平均地温梯度,结果显示青藏高原东缘整体的地温梯度较低,大部分区域具有明显较低的地温梯度(<20 ℃·km-1)(图 7).虽然无法直接获得地壳深部的地温梯度结果,但由于地壳浅部广泛的流体活动、侵蚀作用等因素的影响,使得浅部的地温梯度明显大于深部的地温梯度.因此,由居里点深度计算得到的磁性层平均地温梯度将小于钻井的测量结果.徐明等(2011)根据四川盆地的钻井资料,发现该盆地具有明显低的地温梯度(17.7~33.3 ℃·km-1,平均~22.8 ℃·km-1).据此,可以认为本文计算得到的青藏高原东缘磁性层平均地温梯度较符合实际地质情况.

|
图 7 青藏高原东缘磁性层平均地温梯度 Fig. 7 Average thermal gradients of the magnetic layer in the eastern margin of the Tibetan Plateau |
研究区重定位后的地震震中主要分布在青藏高原地温梯度高向四川盆地地温梯度低过渡的区域(图 7),沿龙门山断裂带分布的地震和四川盆地南缘地震主要位于地温梯度低的区域,而沿鲜水河断裂分布的地震则位于地温梯度过渡的区域.除了2013年岷县MS6.6地震位于相对较高的地温梯度区域外,其他4次大地震均位于地温梯度明显较低的区域(图 7).以上地震活动分布与地温梯度之间的相关性与华北地区(王健等, 2016)和日本东北部(Tanaka and Ishikawa, 2002)的研究结果一致,即呈现较为明显的负相关性.
4 基于居里点深度的温度场分析讨论我们收集了青藏高原东缘已发表的地表热流值(图 1)(汪集旸和黄少鹏, 1990; 胡圣标等, 2001; 姜光政等, 2016),以0.5°网格间距,应用张力系数为0.5的最小曲率法将原始热流数据进行网格化.可以看到原始和插值后的热流值较低的区域对应着较大的居里点深度,而热流值较高的区域则对应着较小的居里点深度(图 8).

|
图 8 地表热流(Qs)与居里点深度(Zb)之间的关系图 红色曲线为最小二乘拟合最优解k=3.39 W/(m℃)的理论曲线. Fig. 8 Correlation between surface heat flow (Qs) and Curie depths (Zb) The red curve is the best least-square fitting model of k=3.39 W/(m℃). |
地表热流测量值提供了地热特征的直接约束,居里点深度结合地表热流可以很好地提供区域地壳温度结构的一级近似约束.区域地壳平均热导率以及其他地热参数可以根据一维稳态热传导模型反演获得.假设只存在垂直热传导,通过地表热流qs和居里点深度Zb的关系为(Li, 2011):
|
(6) |
其中Tc(550 ℃)和T0(5 ℃)分别为磁性层底界和地表温度,k为岩石圈磁性层热导率,H0为地表热产率,hr为热产量随深度变化的衰减因子.
综合利用地表热流和居里点深度,Li等(2012)根据最小二乘法得到了苏鲁—大别造山带区域的最优拟合解为k=3.22 W/(m℃),hr=14.98 km,H0=1.37 μW·m-3. Martos等(2017)得到了南极地区的最优拟合解为k=2.8 W/(m℃),hr=8 km,H0=2.5 μW·m-3.
本文应用最小二乘法得到最优拟合解为k=3.39 W/(m℃),hr=8.684 km,H0=2.08 μW·m-3.徐明等(2011)测量了四川盆地25口钻孔297块岩心样品热导率,发现大多数岩石样品的热导率主要集中在2~4 W/(m℃).四川盆地中部沉积层热产率主要集中在1.3~2.1μW·m-3之间(黄方等,2012).这些实测结果表明本文最优拟合解可以用于青藏高原东缘区域地壳温度结构研究.根据图 2的4条剖面位置,利用一维稳态热传导方程(Li et al., 2012)分别计算了其地壳温度结构(图 9).

|
图 9 沿AA'(a和b)、BB'(c和d)、CC'(e和f)、DD'(g和h) 4条剖面的磁异常与梯度张量以及地壳温度结构和重定位后的震源深度分布图 Fig. 9 Magnetic anomalies and gradient tensors, crustal temperature structures and distribution of relocated focal depths along four profile AA' (a and b), BB' (c and d), CC' (e and f) and DD'(g and h) |
剖面AA'大致沿鲜水河断裂分布,M<.0地震震源深度分布特征大致与居里点深度变化较为一致,如泸定以北100 km的区域,震源深度自东北向西南逐渐变小,泸定以南至越西,震源深度又逐渐变大,对应的居里点深度也是先变小再变大,反映这些区域M<4.0地震震源深度分布主要受控于地壳温度结构.而M≥4.0地震震源深度分布与居里点深度变化特征不明显,主要分布在泸定至越西段以及昭通段(图 9b).这两段区域对应着明显的磁异常变化以及梯度张量变化,特别是2014年鲁甸MS6.5地震对应磁异常和梯度张量的极值区(图 9a和b),反映了更多的构造控制因素.沿剖面AA',大多数M≥2.0地震震源区温度约为100~500 ℃,M≥4.0地震震源区温度多为200~500 ℃,2014年鲁甸MS6.5地震震源区温度大约为300 ℃左右(图 9b和h).
剖面BB'大致沿龙门山断裂带分布,其震源深度与居里点深度变化具有明显的对应关系,自康县至汶川,震源深度和居里点深度均呈现先变大后变小的特点,反映了这些区域的地震震源深度主要受到温度因素的影响.自芦山至石棉,居里点深度整体抬升,但其震源深度反而变深,表明这些区域的地震震源深度可能还受到来自深部和区域构造应力因素的影响.2008年汶川MS8.0和2013年芦山MS7.0地震震源区对应的磁异常表现为较为平缓的变化特征,但其对应的梯度张量却呈现明显的变化,均位于梯度张量的极值附近(图 9c和d).沿剖面BB',大多数M≥2.0地震震源区温度约为100~500 ℃,M≥4.0地震震源区温度多为200~400 ℃,2008年汶川MS8.0地震震源区温度大约为300 ℃左右,但2013年芦山MS7.0地震震源区温度接近约400 ℃(图 9d和f).
沿剖面CC'的震源深度分布与居里点深度变化呈现出与剖面BB'类似的对应关系,即在芦山区域附近,虽然居里点深度较小,但其震源深度却较大.沿剖面CC'其他区域的震源深度则与居里点深度变化基本一致,表明这些区域的地震震源深度主要受控于地壳温度结构.2008年汶川MS8.0和2013年芦山MS7.0地震对应明显的梯度张量的极值区域(图 9e和f).沿剖面CC',大多数M≥2.0地震震源区温度约为100~500 ℃,M≥4.0地震震源区温度多为200~400 ℃,2008年汶川MS8.0、2013岷县MS6.6以及2017九寨沟MS7.0地震震源区温度均为300 ℃左右,而2013年芦山MS7.0地震震源区温度接近约400 ℃(图 9d和f).
沿剖面DD'的震源深度分布特征与居里点深度变化基本一致,重庆长寿区的震源深度较小,其居里点深度也较小,泸县附近的震源深度较大,其居里点深度也较大.自泸县往西南200 km,居里点深度整体抬升,其震源深度也较小.重庆长寿区和泸县地震活动较多,虽然这两个区域对应的磁异常变化较为平缓,但却明显对应了梯度张量的极值区(图 9d和h).泸县往西南约100 km范围内较多的地震却没有对应明显的磁异常或梯度张量变化,可能与本文所使用的数据分辨率不足有关.2014年鲁甸MS6.5地震则明显对应了梯度张量的极值区.沿剖面DD',大多数M≥2.0地震震源区温度约为100~400 ℃,M≥4.0地震震源区温度多为100~400 ℃,2014年鲁甸MS6.5地震震源区温度为300 ℃左右(图 9b和h).
以上结果显示,青藏高原东缘大多数地震震源区温度约为100~500 ℃.2008年汶川MS8.0、2013岷县MS6.6、2014年鲁甸MS6.5以及2017九寨沟MS7.0地震震源区温度均为300 ℃左右,与1976年唐山MS7.8地震震源区温度一致(王健等, 2016),均接近石英矿物脆-塑性变形过渡区的温度(~300±50 ℃)(Tullis and Yund, 1977; Shimada, 1992).然而,2013年芦山MS7.0地震震源温度却接近约400 ℃.芦山地震震源区位于龙门山断裂带与鲜水河断裂的交汇处,受到强烈的构造作用.因此,芦山地震震源区除了受到地壳温度结构的影响外,还受到局部构造应力异常的影响.
5 结论本文对2008—2017年发生在青藏高原东缘的地震根据双差定位法应用不同的地壳速度分区模型进行了重定位,得到了4921个精确定位的地震事件,重定位后的地震震源深度多分布在5~20 km.
根据全球NGDC-720磁异常模型,发现大多数地震位于负磁异常区域或强-弱磁异常边界.梯度张量相对于总场和三分量磁异常能更好地识别地震活动强烈区域,特别是大地震发生的区域.除了2013年岷县MS6.6地震以外,该区域其他4次M≥6.5地震震源区均位于居里点深度较大、地温梯度较低的区域.
地壳温度结构表明青藏高原东缘大多数M≥2.0地震震源区温度为100~500 ℃,M≥4.0地震震源区温度多为200~400 ℃.2008年汶川MS8.0、2013岷县MS6.6、2014年鲁甸MS6.5以及2017九寨沟MS7.0地震震源区温度大约均为300 ℃左右,而2013年芦山MS7.0地震震源区温度接近约400 ℃,更多与局部构造应力异常有关.
致谢感谢中国地震台网中心提供地震观测报告,感谢USGS提供位场数据处理程序包,本文大部分图件使用GMT软件绘制,在此一并致谢.
Arnaiz-Rodríguez M S, Orihuela N.
2013. Curie point depth in Venezuela and the Eastern Caribbean. Tectonophysics, 590: 38-51.
DOI:10.1016/j.tecto.2013.01.004 |
|
Bansal A R, Gabriel G, Dimri V P, et al.
2011. Estimation of depth to the bottom of magnetic sources by a modified centroid method for fractal distribution of sources: An application to aeromagnetic data in Germany. Geophysics, 76(3): L11-L22.
DOI:10.1190/1.3560017 |
|
Bouligand C, Glen J M G, Blakely R J.
2009. Mapping Curie temperature depth in the western United States with a fractal model for crustal magnetization. Journal of Geophysical Research (Solid Earth), 114: B11104.
DOI:10.1029/2009JB006494 |
|
Burov E B, Watts A B.
2006. The long-term strength of continental lithosphere: "jelly sandwich" or "crème brûlée"?. GSA Today, 16(1): 4-10.
DOI:10.1130/1052-5173(2006)016<4:TLTSOC>2.0.CO;2 |
|
Chen J H, Liu Q Y, Li S C, et al.
2009. Seismotectonic study by relocation of the Wenchuan MS8.0 earthquake sequence. Chinese Journal of Geophysics, 52(2): 390-397.
DOI:10.1002/cjg2.v52.2 |
|
Chen W P, Yu C Q, Tseng T L, et al.
2013. Moho, seismogenesis, and rheology of the lithosphere. Tectonophysics, 609: 491-503.
DOI:10.1016/j.tecto.2012.12.019 |
|
Connard G, Couch R, Gemperle M.
1983. Analysis of aeromagnetic measurements from the Cascade Range in central Oregon. Geophysics, 48(3): 376-390.
DOI:10.1190/1.1441476 |
|
Feng H W, Zhang Y S, Liu X Z, et al.
2013. Relocation of Mainshock and aftershocks of the 2013 Minxian-Zhangxian MS6.6 Earthquake in Gansu. China Earthquake Engineering Journal, 35(3): 443-447.
|
|
Gao G M, Kang G F, Bai C H, et al.
2013. Distribution of the crustal magnetic anomaly and geological structure in Xinjiang, China. Journal of Asian Earth Sciences, 77: 12-20.
DOI:10.1016/j.jseaes.2013.08.014 |
|
Gao G M, Kang G F, Bai C H, et al.
2015a. Study on crustal magnetic anomalies and Curie surface in Southeast Tibet. Journal of Asian Earth Sciences, 97: 169-177.
DOI:10.1016/j.jseaes.2014.10.035 |
|
Gao G M, Kang G F, Li G Q, et al.
2015b. Crustal magnetic anomaly in the Ordos region and its tectonic implications. Journal of Asian Earth Sciences, 109: 63-73.
DOI:10.1016/j.jseaes.2015.04.033 |
|
Hu S B, He L J, Wang J Y.
2001. Compilation of heat flow data in the China continental area (3rd edition). Chinese Journal of Geophysics, 44(5): 611-626.
|
|
Hu Y P, Wang Z, Liu G N, et al.
2017. Crustal structure imaging of multi-geophysical parameters and generating mechanisms of large earthquakes in North-South Seismic Zone. Chinese Journal of Geophysics, 60(6): 2113-2129.
DOI:10.6038/cjg20170608 |
|
Huang F, Liu Q Y, He L J.
2012. Tectono-thermal modeling of the Sichuan Basin since the Late Himalayan period. Chinese Journal of Geophysics, 55(11): 3742-3753.
DOI:10.6038/j.issn.0001-5733.2012.11.021 |
|
Huang Y, Wu J P, Zhang T Z, et al.
2008. Relocation of the MS8.0 Wenchuan earthquake and its aftershock sequence. Science in Series D: Earth Sciences, 51(12): 1703-1711.
DOI:10.1007/s11430-008-0135-z |
|
Jiang G Z, Gao P, Rao S, et al.
2016. Compilation of heat flow data in the continental area of China (4th edition). Chinese Journal of Geophysics, 59(8): 2892-2910.
DOI:10.6038/cjg20160815 |
|
Langel R A, Hinze W J. 1998.
The Magnetic Field of the Earth's Lithosphere: The Satellite Perspective. Cambridge: Cambridge University Press.
|
|
Li C F.
2011. An integrated geodynamic model of the Nankai subduction zone and neighboring regions from geophysical inversion and modeling. Journal of Geodynamics, 51(1): 64-80.
DOI:10.1016/j.jog.2010.08.003 |
|
Li C F, Lu Y, Wang J.
2017. A global reference model of Curie-point depths based on EMAG2. Scientific Reports, 7: 45129.
DOI:10.1038/srep45129 |
|
Li C F, Shi X B, Zhou Z Y, et al.
2010. Depths to the magnetic layer bottom in the South China Sea area and their tectonic implications. Geophysical Journal International, 182(3): 1229-1247.
DOI:10.1111/j.1365-246X.2010.04702.x |
|
Li C F, Wang J.
2016. Variations in Moho and Curie depths and heat flow in Eastern and Southeastern Asia. Marine Geophysical Research, 37(1): 1-20.
DOI:10.1007/s11001-016-9265-4 |
|
Li C F, Wang J, Lin J, et al.
2013. Thermal evolution of the North Atlantic lithosphere: New constraints from magnetic anomaly inversion with a fractal magnetization model. Geochemistry, Geophysics, Geosystems, 14(12): 5078-5105.
DOI:10.1002/ggge.v14.12 |
|
Li C F, Wang J L, Zhou Z Y, et al.
2012. 3D geophysical characterization of the Sulu-Dabie orogen and its environs. Physics of the Earth and Planetary Interiors, 192-193: 35-53.
DOI:10.1016/j.pepi.2012.01.003 |
|
Li J, Wang X B, Li D H, et al.
2017. Characteristics of the lithosphere physical structure in eastern margin of the Qinghai-Tibet plateau and their deep tectonic implications. Chinese Journal of Geophysics, 60(6): 2500-2511.
DOI:10.6038/cjg20170637 |
|
Martos Y M, Catalán M, Jordan T A, et al.
2017. Heat flux distribution of Antarctica unveiled. Geophysical Research Letters, 44(22): 11417-11426.
DOI:10.1002/2017GL075609 |
|
Maus S.
2010a. An ellipsoidal harmonic representation of Earth's lithospheric magnetic field to degree and order 720. Geochemistry, Geophysics, Geosystems, 11: Q06015.
DOI:10.1029/2010GC003026 |
|
Maus S. 2010b. Enhanced Magnetic Model (EMM2010). http://ngdc.noaa.gov/geomag/EMM/index.html.
|
|
Maus S, Barckhausen U, Berkenbosch H, et al.
2009. EMAG2: A 2-arc min resolution Earth Magnetic Anomaly Grid compiled from satellite, airborne, and marine magnetic measurements. Geochemistry, Geophysics, Geosystems, 10: Q08005.
DOI:10.1029/2009GC002471 |
|
Maus S, Yin F, Lühr H, et al.
2008. Resolution of direction of oceanic magnetic lineations by the sixth-generation lithospheric magnetic field model from CHAMP satellite magnetic measurements. Geochemistry, Geophysics, Geosystems, 9: Q07021.
DOI:10.1029/2008GC001949 |
|
McKenzie D, Jackson J, Priestley K.
2005. Thermal structure of oceanic and continental lithosphere. Earth and Planetary Science Letters, 233(3-4): 337-349.
DOI:10.1016/j.epsl.2005.02.005 |
|
Shimada M.
1992. Confirmation of two types of fracture in granite deformed at temperatures to 300 ℃. Tectonophysics, 211(1-4): 259-268.
DOI:10.1016/0040-1951(92)90063-C |
|
Tanaka A, Ishikawa Y.
2002. Temperature distribution and focal depth in the crust of the northeastern Japan. Earth and Planets Space, 54(11): 1109-1113.
DOI:10.1186/BF03353310 |
|
Tanaka A, Okubo Y, Matsubayashi O.
1999. Curie point depth based on spectrum analysis of the magnetic anomaly data in East and Southeast Asia. Tectonophysics, 306(3-4): 461-470.
DOI:10.1016/S0040-1951(99)00072-4 |
|
Tullis J, Yund R A.
1977. Experimental deformation of dry westerly granite. Journal of Geophysical Research, 82(36): 5705-5718.
DOI:10.1029/JB082i036p05705 |
|
Waldhauser F, Ellsworth W L.
2000. A double difference earthquake location algorithm: Method and application to the Northern Hayward fault, California. Bulletin of the Seismological Society of America, 90(6): 1353-1368.
DOI:10.1785/0120000006 |
|
Wang J, Li C F.
2015. Crustal magmatism and lithospheric geothermal state of western North America and their implications for a magnetic mantle. Tectonophysics, 638: 112-125.
DOI:10.1016/j.tecto.2014.11.002 |
|
Wang J, Li C F, Lei J S, et al.
2016. Relationship between seismicity and crustal thermal structure in North China. Acta Seismologica Sinica, 38(4): 618-631.
|
|
Wang J Y, Huang S P.
1990. Compilation of heat flow data in the China continental area (2nd edition). Seismology and Geology, 12(4): 351-366.
|
|
Wang W L, Wu J P, Fang L H, et al.
2014. Double difference location of the Ludian MS6.5 earthquake sequences in Yunnan province in 2014. Chinese Journal of Geophysics, 57(9): 3042-3051.
DOI:10.6038/cjg20140929 |
|
Wang Z, Wang X B, Huang R Q, et al.
2017. Deep structure imaging of multi-geophysical parameters and seismogenesis in the Longmenshan fault zone. Chinese Journal of Geophysics, 60(6): 2068-2079.
DOI:10.6038/cjg20170604 |
|
Wen L M, Kang G F, Bai C H, et al.
2017. Crustal magnetic anomalies and geological structure in the Yunnan region. Chinese Journal of Geophysics, 60(9): 3493-3504.
DOI:10.6038/cjg20170918 |
|
Witter J B, Miller C A, Friend M, et al. 2018. Curie point depths and heat production in Yukon, Canada. //Proceedings, 43rd Workshop on Geothermal Reservoir Engineering. California, 1-11.
|
|
Xu M, Zhu C Q, Tian Y T, et al.
2011. Borehole temperature logging and characteristics of subsurface temperature in Sichuan Basin. Chinese Journal of Geophysics, 54(4): 1052-1060.
DOI:10.3969/j.issn.0001-5733.2011.04.020 |
|
Yan Y F, Teng J W, Ruan X M, et al.
2016. Aeromagnetic field characteristics and the Wenchuan earthquakes in the Longmenshan mountains and adjacent areas. Chinese Journal of Geophysics, 59(1): 197-214.
DOI:10.6038/cjg20160117 |
|
Yi G X, Long F, Liang M J, et al.
2017. Focal mechanism solutions and seismogenic structure of the 8 August 2017 M7.0 Jiuzhaigou earthquake and its aftershocks, northern Sichuan. Chinese Journal of Geophysics, 60(10): 4083-4097.
DOI:10.6038/cjg20171033 |
|
Zhang J S, Gao R, Zeng L S, et al.
2009. Relationship between characteristics of gravity and magnetic anomalies and the earthquakes in Longmenshan range and adjacent areas. Chinese Journal of Geophysics, 52(2): 572-578.
|
|
Zhao B, Gao Y, Huang Z B, et al.
2013. Double difference relocation, focal mechanism and stress inversion of Lushan MS7.0 earthquake sequence. Chinese Journal of Geophysics, 56(10): 3385-3395.
DOI:10.6038/cjg20131014 |
|
Zhao Z, Chen N.
1995. Accuracy amendment of focal location along the Longmenshan Fault in the North of Sichuan. Earthquake Research in Sichuan(4): 19-30.
|
|
Zhao Z, Fan J, Zheng S H, et al.
1997. Crustal velocity structure and accuracy amendment of focal location along the Longmenshan Fault. Acta Seismologica Sinica, 19(6): 615-622.
|
|
陈九辉, 刘启元, 李顺成, 等.
2009. 汶川MS8.0地震余震序列重新定位及其地震构造研究. 地球物理学报, 52(2): 390–397.
|
|
冯红武, 张元生, 刘旭宙, 等.
2013. 2013年甘肃岷县漳县MS6.6地震及其余震序列重定位. 地震工程学报, 35(3): 443–447.
|
|
胡圣标, 何丽娟, 汪集旸.
2001. 中国大陆地区大地热流数据汇编(第三版). 地球物理学报, 44(5): 611–626.
|
|
胡亚平, 王志, 刘冠男, 等.
2017. 南北地震带地壳结构多参数成像及强震触发机制研究. 地球物理学报, 60(6): 2113–2129.
DOI:10.6038/cjg20170608 |
|
黄方, 刘琼颖, 何丽娟.
2012. 晚喜山期以来四川盆地构造-热演化模拟. 地球物理学报, 55(11): 3742–3753.
DOI:10.6038/j.issn.0001-5733.2012.11.021 |
|
黄媛, 吴建平, 张天中, 等.
2008. 汶川8. 0级大地震及其余震序列重定位研究. 中国科学D:地球科学, 38(10): 1242–1249.
|
|
姜光政, 高堋, 饶松, 等.
2016. 中国大陆地区大地热流数据汇编(第四版). 地球物理学报, 59(8): 2892–2910.
DOI:10.6038/cjg20160815 |
|
李军, 王绪本, 李大虎, 等.
2017. 青藏高原东缘岩石圈物性结构特征及深部构造涵义. 地球物理学报, 60(6): 2500–2511.
DOI:10.6038/cjg20170637 |
|
汪集旸, 黄少鹏.
1990. 中国大陆地区大地热流数据汇编(第二版). 地震地质, 12(4): 351–366.
|
|
王健, 李春峰, 雷建设, 等.
2016. 华北地区地震活动与地壳热结构关系研究. 地震学报, 38(4): 618–631.
DOI:10.11939/jass.2016.04.008 |
|
王未来, 吴建平, 房立华, 等.
2014. 2014年云南鲁甸MS6.5地震序列的双差定位. 地球物理学报, 57(9): 3042–3051.
DOI:10.6038/cjg20140929 |
|
王志, 王绪本, 黄润秋, 等.
2017. 龙门山断裂带多参数深部结构成像与地震成因研究. 地球物理学报, 60(6): 2068–2079.
DOI:10.6038/cjg20170604 |
|
文丽敏, 康国发, 白春华, 等.
2017. 云南地区地壳磁异常与地质构造. 地球物理学报, 60(9): 3493–3504.
DOI:10.6038/cjg20170918 |
|
徐明, 朱传庆, 田云涛, 等.
2011. 四川盆地钻孔温度测量及现今地热特征. 地球物理学报, 54(4): 1052–1060.
DOI:10.3969/j.issn.0001-5733.2011.04.020 |
|
闫亚芬, 滕吉文, 阮小敏, 等.
2016. 龙门山和相邻地域航磁场特征与汶川大地震. 地球物理学报, 59(1): 197–214.
DOI:10.6038/cjg20160117 |
|
易桂喜, 龙锋, 梁明剑, 等.
2017. 2017年8月8日九寨沟M7.0地震及余震震源机制解与发震构造分析. 地球物理学报, 60(10): 4083–4097.
DOI:10.6038/cjg20171033 |
|
张季生, 高锐, 曾令森, 等.
2009. 龙门山及邻区重、磁异常特征及与地震关系的研究. 地球物理学报, 52(2): 572–578.
|
|
赵博, 高原, 黄志斌, 等.
2013. 四川芦山MS7.0地震余震序列双差定位、震源机制及应力场反演. 地球物理学报, 56(10): 3385–3395.
DOI:10.6038/cjg20131014 |
|
赵珠, 陈农.
1995. 龙门山断裂带四川北段震源位置的精确修定. 四川地震(4): 19–30.
|
|
赵珠, 范军, 郑斯华, 等.
1997. 龙门山断裂带地壳速度结构和震源位置的精确修定. 地震学报, 19(6): 615–622.
|
|