 2018, Vol. 61


龙门山断裂带位于青藏东缘松潘甘孜地块与四川盆地交界处,是一条长约470 km、宽约50 km呈NE—SW展布的活动断裂带(Yin and Nie, 1996).它由一系列断裂系组成,主要包括:汶川—茂县断裂(后山断裂),映秀—北川断裂(中央断裂),灌县—安县断裂(前山断裂)以及山前隐伏断裂(邓起东等, 1994; 李勇等, 2006; Jia et al., 2006; 贾秋鹏等, 2007).映秀—北川和灌县—安县断裂是龙门山的主要断裂,尤其是映秀—北川断裂带为龙门山陡变带的边界(图 1b),它们的活动控制着龙门山的隆升(王焕等, 2013).映秀—北川断裂是2008年汶川MW7.9地震的主要发震断裂,具有逆冲兼右旋走滑的性质,同震地表破裂带长约240~275 km;而灌县—安县断裂带同震破裂带表现为纯逆冲性质,其地表破裂带长度约80 km(徐锡伟等, 2008; Lin et al., 2008, 2009; Xu et al., 2009; Jia et al., 2010).自中生代以来龙门山地区经历了两次主要的造山运动(印支造山事件和印度—亚洲板块碰撞有关的新生代变形)(Dirks et al., 1994; Burchfiel et al., 1995; Jia et al., 2006),从青藏高原东缘至四川盆地横跨龙门山褶皱冲断带几十公里范围内,地形起伏达5 km(图 1c),形成了现今青藏高原东缘最陡的地形(Burchfiel et al., 1995; Jia et al., 2006;Kirby et al., 2008).前人已对龙门山断裂带的隆升机制进行了大量的研究,主要存在两种观点:1)地壳缩短,认为脆性地壳以若干拆离断层的形式产生大量滑移而缩短增厚(Avouac and Tapponnier, 1993; Tapponnier et al., 2001; Hubbard and Shaw, 2009; Hubbard et al., 2010; Jia et al., 2010; Robert et al., 2010; Guo et al., 2013);2)中下地壳流,认为青藏高原软弱的中下地壳物质向东移动的过程中,受到坚硬的四川盆地的阻挡,产生物质的堆积增厚(Bird, 1991; Burchfiel et al., 1995, 2008; Royden et al., 1997, 2008; Clark and Royden, 2000; Kirby et al., 2002, 2003; Cook and Royden, 2008).这两种观点目前仍在争论之中(Fu et al., 2011; Guo et al., 2013; 柳畅等, 2014).

|
图 1 青藏高原东部区域地形图 (a)青藏高原,红色虚框显示为图(b)的区域,蓝色箭头为GPS水平速度场(Zhang et al., 2004);(b)青藏高原东缘与四川盆地,白线为垂直龙门山走向的直线用于获取图(c)的地形,黑色虚框为选取对地观测数据的区域;(c)横跨龙门山断层的地形曲线. WMF:汶川—茂县断裂;YBF:映秀—北川断裂;PGF:灌县—安县断裂;LQSF:龙泉山断裂;LRBF:龙日坝断裂;MJF:岷江断裂. Fig. 1 Topographic map of eastern Tibetan plateau (a) Tibetan plateau. Red dash box is scope of (b). Blue arrows denote horizontal velocity field of GPS (Zhang et al., 2004); (b) Eastern Tibetan plateau and Sichuan basin. The white line perpendicular to the Longmen Shan fault zone is the trace of (c). Black dash box represents the area in which observation data is selected; (c) Elevation across the Longmen Shan fault. |
2008年5月12日14时汶川发生举世震惊的MW7.9地震,约7万人因此丧生(张培震等, 2008).汶川地震发生之前,测地学和地貌学观测数据均显示龙门山断裂带具有较低的缩短速率 <3 mm·a-1(Shen et al., 2000; Chen et al., 2000; Wang et al., 2001; Zhang et al., 2004),并且缺乏典型的新生代前陆盆地(贾东等, 2003; Jia et al., 2006; Hubbard et al., 2010),支持中下地壳流是龙门山地区的主要造山机制,对龙门山的隆升机制提供了重要的线索.然而,汶川地震的发生使得地壳缩短约为8.5 m,造成最大的垂直位移约为10 m(Fu et al., 2011),直接体现了现今龙门山断裂带的上地壳缩短造山,这对中下地壳流造山机制提出了质疑.Hubbard等(Hubbard and Shaw, 2009; Hubbard et al., 2010)利用石油地震剖面建立了龙门山山前地区的地质剖面,研究发现青藏东缘的上地壳缩短和地形之间存在极其匹配的关系,说明上地壳脆性缩短是形成和维持青藏东缘地形的主要驱动力.Burchfiel等(2008)提出的模型将龙门山断层传播褶皱模型和地壳深处韧性增厚相结合,说明龙门山地区存在地壳缩短与中下地壳流的共同作用.
近年来,空间依赖的地形变测量技术迅速发展,使我们获得了大量的地壳短期变形数据.这些短期变形数据的时间跨度一般小于几十年.近年的GPS(Global Positioning System)及其他大地变形测量数据显示横跨龙门山断层带具有较小的水平缩短与抬升速率(Zhang et al., 2004; Gan et al., 2007; Shen et al., 2009; Wang et al., 2009; Zhao et al., 2015).而热年代学测量、古地震以及地形地貌估计的变形的时间跨度一般以数万年、百万年计,代表长期的变形.其地形变测量显示从四川盆地跨龙门山至青藏高原,地形由几百米的高程一直上升到5 km的高度(图 1c).谭锡斌等(2015)利用热年代学得出距今8万年以来断层的平均滑动速率,并估算出NW—SE水平缩短量达8~12 km.那么,短期地壳变形怎样与长期地质构造变形联系起来?短期变形如何演化为长期造山?这些问题一直是地球科学家十分关注的重要问题.
我们建立了一个二维平面应变黏弹塑性有限元模型,模拟了龙门山断裂带的一个地震循环各个阶段(包括震间加载期、同震瞬间和震后黏弹性应力松弛期)的变形,一个地震循环(数千年)的变形演化,以及多个地震循环(数万年)的变形演化.我们探索了构造缩短背景下逆冲断层的地震循环过程及其变形演化.研究结果帮助我们理解短期变形与长期地质构造变形之间的关系,和认识龙门山的隆升造山机制.
1 有限元数值模型 1.1 模型设置我们建立了二维黏弹塑性有限元模型(图 2).该模型以汶川地震震中为中心横跨青藏高原东部与四川盆地(图 1b白色直线),模型长度为600 km,深度至100 km.横向上模型主要分为两个部分,左侧部分为青藏高原东部,右侧部分为四川盆地,模型两侧具有不同的地壳厚度,左侧地壳厚度为60 km,右侧为40 km(王有学等, 2005; Liu et al., 2009a; Wang et al., 2007; Zhang et al., 2009; 柳畅等, 2012),从青藏高原至四川盆地在龙门山地区存在Moho面深度的转折.

|
图 2 二维黏弹塑性有限元模型; TP代表青藏高原东缘,SB代表四川盆地 Fig. 2 Two-dimensional visco-elastic-plastic finite element model. TP represents eastern Tibetan plateau. SB represents Sichuan basin |
模型顶部20 km为上地壳或生震地壳(Luo and Liu, 2010; Liu et al., 2015).青藏高原东部上地壳和四川盆地上地壳是理想弹塑性的;四川盆地上地壳强度更大(表 1).断层位于模型顶部中央,贯穿整个上地壳;断层厚度设置为2 km(Luo and Liu, 2009, 2010, 2012),是对断层(带)的一级近似,倾角为30°;断层由应变软化的弹塑性单元模拟,相对于周围地壳,断层强度较弱(表 1).模型左侧20~60 km为中下地壳,60~100 km为岩石圈地幔;右侧20~40 km为中下地壳,40~100 km为岩石圈地幔.模型的中下地壳和岩石圈地幔均由Maxwell黏弹性材料模拟(表 1).
|
|
表 1 参考模型岩石圈各地层物质参数设置 Table 1 Material parameter of the reference model |
模型的参数为:杨氏模量E、泊松比ν、黏度η、内聚力C、密度ρ以及内摩擦角ϕ.参考模型的参数设置如表 1所示.
关于黏度的设定,参考石耀霖和曹建玲(2008)中国大陆岩石圈等效黏度的研究结果.参考模型没有精细地划分黏度结构分层,而是对黏度结构进行了简化.杨氏模量、密度等的取值根据以往研究(柳畅等, 2012, 2014; Zhu and Zhang, 2013)选取其平均值,不考虑泊松比差异的影响.内聚力和内摩擦角的设置参考(Chéry et al., 2001; Li et al., 2009; He et al., 2013),已知三个构造单元的力学相对强度从强至弱依次为四川盆地、青藏高原、断层,由于内摩擦角和内聚力无法直接获得,力学强度(内摩擦角和内聚力)的取值是对三个构造单元的强度的一级近似,从表 1可以看出龙门山断层的强度显著弱于青藏高原及四川盆地的上地壳.
在模型左侧,我们施加了5 mm·a-1的右向水平速度;而在模型右侧,水平方向位移固定,垂直方向可自由运动(图 2).因此,模型的水平缩短速度是5 mm·a-1,这是与由大地测量学和GPS数据得到的横跨龙门山断裂带600 km范围地壳缩短速率一致的(Zhang et al., 2004; Shen et al., 2005; Gan et al., 2007).由于中下地壳与岩石圈地幔的运动速度很难约束,因此,与前人的研究类似,我们假设中下地壳及岩石圈地幔均与上地壳运动速度无差异(Bendick and Flesch, 2007; Wang et al., 2008; 柳畅等, 2012, 2014; Zhu and Zhang, 2013; Liu et al., 2015).模型底边界的垂直方向固定,水平方向可自由滑动.模型上界面为自由表面.
初始条件是地球动力学数值模拟中非常关键的,但也是很难确定很难约束的问题(柳畅等, 2012, 2014; 祝爱玉等, 2016; 黄禄渊等, 2017a, 2017b).以往的研究对初始条件的设置,假设初始应力为0,忽略了重力的影响(柳畅等, 2012, 2014).岩石圈的长期流变特性,使得应力状态趋向于静岩压力(祝爱玉等, 2016).因此,我们的模型的初应力场是一个静岩压力场(无偏应力):模型内任意一点的正应力等于该点上覆岩石的重力.经过5万年时间的边界加载,模型达到稳定加载状态,因此我们获得了稳定的背景应力场.应力可以在一定的范围内波动,这是由于地震导致的应力扰动(图 4).我们选取模型进入稳定状态后的地震循环模拟结果,分析了地震循环的地表位移演化.由于本模型没有模拟长期的地质造山过程,而且我们研究的时间尺度较短,为万年时间尺度(多个地震循环,图 4),因此我们忽略了地形载荷的影响(Li and Liu, 2006; Liu et al., 2010; Luo and Liu, 2012).

|
图 4 断层上盘深度为11.2 km处节点上的应力随时间变化曲线上图是下图矩形框区域的放大, 本文压应力为正. Fig. 4 Stress-time curve of a node on fault at depth of 11.2 km Upper is the magnification of the rectangular box in lower. Compressive stress is positive. |
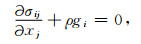
模型通过求解静态的力平衡方程来模拟岩石圈变形:
|
(1) |
其中σij为应力张量(i, j=1, 2, 3),ρ为密度,gi为重力加速度.
在进行数值模拟的过程中,对于每个时间步,模型可计算出总的应变增量,总的应变增量包括黏性应变增量、弹性应变增量和塑性应变增量(Li et al., 2009; Luo and Liu, 2012):

|
(2) |
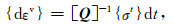
其中{ }代表矢量.对于黏弹性地层,本构方程可写成:
|
(3) |

|
(4) |
|
(5) |

|
(6) |
其中[Q]和[D]分别为黏性和弹性的材料矩阵(公式(5)、(6));η为黏滞系数,E为杨氏模量,ν为泊松比;σt为t时刻的应力张量;dσ为应力增量张量;dt为时间增量(Li et al., 2009; Luo and Liu, 2010, 2012).
1.3 地震及地震循环的数值模拟以往的研究对于地震的模拟,一般是使用解析或半解析的方法,在弹性或黏弹性位错模型(Savage, 1983; Okada, 1985; Pollitz, 2001; Freed et al., 2007; Smith and Sandwell, 2004; Wang et al., 2003)中预设一个固定的同震位错量;也有一些研究使用分裂节点法将预设的地震位错量嵌入到有限元模型当中(Dixon et al., 2002; Fay and Humphreys, 2005).这些运动学模型的优势在于相对简单,并且能够通过地表观测(大地测量以及地震数据)反演得到的同震位错对其进行直接约束,但不能够考虑背景应力场、构造加载及其演化过程,因此当调查断层的力学耦合以及不同时间尺度之间的地球动力学联系时会受到限制.
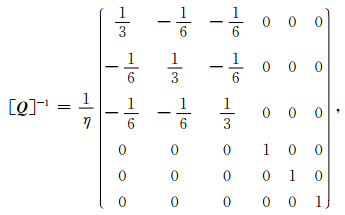
在此,我们采用一种不同的处理方法.在我们的动力学模型中,首先需要模拟岩石圈的稳定的背景应力场;然后在此背景应力场的基础上,模拟了地震及地震循环.我们的黏弹塑性模型在重力以及边界加载的条件下经过几万年时间的加载,模型达到稳定的加载状态,此时区域背景应力场已经达到稳定.地震是断层在边界条件下被加载达到屈服强度时突然应变软化的结果(Pande, 1990; Jaeger et al., 2007; Hu et al., 2009; Luo and Liu, 2009, 2010, 2012).模型的断层是由2 km厚的有着应变软化的弹塑性断层单元来模拟.我们使用Drucker-Prager屈服准则(Luo and Liu, 2010, 2012)来判断断层单元是否到达屈服,若达到屈服,即发生同震位错.我们通过降低断层单元的内聚力来模拟断层的突然失稳和突然滑动(图 3),本文模拟设置的内聚力降ΔC为10 MPa,内聚力降的取值参考Kanamori和Anderson(1975)关于倾滑断层的平均滑动量与应力降相关的经验公式,且经过多次调试最终确定.Drucker-Prager准则是Mohr-Coulomb屈服准则的连续且平滑的表达方式(Drucker and Prager, 1952; Khan and Huang, 1995):

|
图 3 地震循环过程中应力积累、释放图(修改自Luo and Liu, 2010) Fig. 3 Stress accumulation and release during seismic cycles (modified from Luo and Liu, 2010) |
|
(7) |

|
(8) |
|
(9) |
其中,I1为应力张量的第一不变量(本文压应力为正);J2为偏应力张量的第二不变量;α和β为Drucker-Prager屈服准则的参数,是内聚力C和内摩擦角ϕ的函数.采用塑性势函数(不相关塑性流动法则):

|
(10) |
塑性应变增量为:
|
(11) |
其中,dλ为塑性乘子,其与D-P屈服准则、塑性势函数、硬化模量相关(Zienkiewicz and Taylor, 2005; Li et al., 2009).
如图 3所示,当应力达到屈服极限σy0之前,断层处于震间闭锁(弹性加载)阶段,没有塑性变形.当应力达到屈服极限σy0时,突然降低断层内聚力至C-ΔC,断层屈服极限降低为σre,断层失稳产生应力降和塑性应变(同震变形),当应力降到剩余应力强度σre时地震结束,同震变形的发生过程在很短的时间内完成,并且是在一个迭代步内完成,因此将时间步长设为1 s.此后恢复内聚力为原值C,断层闭锁并进入下一个震间加载阶段,此时时间步长恢复为1年,直至下一次地震的发生.这个过程在地震循环的过程中重复发生(图 3).受地震以及边界加载的影响,应力场在背景应力场附近发生波动.基于背景应力场,可以计算地震诱发的应力变化Δσ.当模拟地震时,可以利用已知的该地震的地震矩大小来约束同震滑动量或释放的塑性应变量Δε(Luo and Liu, 2010).
本文计算所使用的程序为二维黏弹塑性有限元程序,该程序计算的可靠性已经通过许多研究的验证(Luo and Liu, 2009, 2010, 2012; Li and Liu, 2009; Wang H et al., 2010a).模拟采用的震间加载的时间步长为1年;发生地震时,时间步长变为1 s;经过几万年的构造加载,模型进入稳定加载状态,应力场已经趋于稳定.该有限元程序为并行程序,所有模拟计算案例均在双CPU/28核的工作站上运行.
2 结果利用二维黏弹塑性有限元模型,我们研究了:1)一个地震循环不同阶段的地表位移和演化,以及多个地震循环的地表位移演化和分布;2)地壳分层结构及其黏度特征对地表位移的影响;3)断层倾角和几何形状对地表位移的影响;4)跨过铲形龙门山断裂的地震循环的地表速度分布和演化.
2.1 地震以及地震循环的位移演化经过5万年时间的计算,模型已经进入稳定的加载和变形状态,图 4显示了断层上盘深度为11.2 km处一个断层节点上的应力随时间的演化曲线.在应力已经趋于稳定后的时间段中选取1个地震循环进行地表位移的演化分析.
图 4中灰色曲线为I1/3,反映了平均应力的变化;黑色曲线为
选取一个大地震循环进行地表的位移演化分析,即震间加载阶段、同震瞬时滑动阶段和震后中下地壳上地幔的黏弹性应力松弛阶段.实际情况下和数值模拟中,两次大地震之间的加载过程中的总变形包含了上一次大地震的震后应力松弛效应所产生的变形和本次震间构造加载所产生的变形,这两种效应是耦合在一起的.我们假设两次大地震之间的加载阶段的晚期,即在经过了2000~4000年时间之后,上一次大地震造成的中下地壳和上地幔的应力松弛效应已经结束或非常微弱.这个假设与许多研究和观测结果是一致的(Hearn, 2003; Hu and Wang, 2012; Simpson, 2015; Zhao et al., 2015).因此,我们把两次大地震之间的晚期变形速度作为边界构造加载所造成的变形速度,从而可以把边界构造加载所造成的变形从两次大地震之间的总变形中移除,最后可以得到这一次地震的边界构造加载效应和上一次大地震的震后应力松弛效应各自产生的变形.因此,在本文中,我们分析了一个大地震震前的震间构造加载阶段、大地震同震瞬间和大地震后的中下地壳及上地幔的黏弹性应力松弛阶段各自的地表位移.
对于一个大地震循环,我们得到三条不同的地表位移曲线.三条曲线分别显示了大地震循环的三个阶段各自的位移(图 5a和图 5b):黑色实线为一个地震循环中震前的震间构造加载的位移曲线,即本次大地震发生之前与上一次大地震发生之后由于构造加载效应所产生的位移;浅灰色虚线为同震位移曲线,即本次同震时刻产生的位移;灰色实线为震后的应力松弛阶段的位移曲线,即本次大地震之后,下一次大地震之前由于应力松弛效应所产生的位移.震间构造加载阶段水平位移呈现连续变形的模式;垂向位移显示,模型左侧发生凸状隆起,右侧基本不发生隆起.同震变形阶段水平位移显示出明显的错动,上盘向右下盘向左相向移动,造成断层及其附近较小范围的水平缩短;垂向上,断层左侧上盘较小的范围内产生剧烈抬升,其他部分基本保持不变.震后松弛阶段,水平位移显示模型左侧部分较大范围内产生较大的右向滑移量,而模型右侧基本保持不变;在垂向上断层左侧距断层较近范围内继续产生抬升,且向远处逐渐下降.

|
图 5 一个地震循环的地表位移 (a)不同阶段的水平位移;(b)不同阶段的垂向位移;(c)不同阶段水平位移的叠加;(d)不同阶段垂向位移的叠加.其中横坐标0位置处表示断层所在位置;I表示震间加载阶段;C表示同震阶段;P表示震后应力松弛阶段. Fig. 5 Surface displacement of one seismic cycle (a) Horizontal displacement at different stages; (b) Vertical displacements at different stages; (c) Summation of horizontal displacements of different stages; (d) Summation of vertical displacements of different stages. Zero location on horizontal axis represents the fault. I represents inter-seismic, C represents co-seismic, P represents post-seismic. |
我们分析了一个大地震循环的位移演化:即对一个大地震循环不同阶段的位移随发生的时间顺序进行叠加,得到该地震循环的总位移.图 5c显示了不同阶段的水平总位移,可以看出经过一个地震循环之后,模型两侧产生的水平缩短主要由断层的位错所调解,水平方向上看不出明显的永久变形,说明一个地震循环之后水平应变积累基本得到释放,没有产生水平向的永久应变;而垂向上(图 5d),一个地震循环之后,模型左侧较大范围内产生显著抬升,并且随着距离断层越近抬升越大,模型左侧产生明显的垂向永久变形,而模型右侧基本保持不变,没有产生明显的永久变形.一个地震循环过后整个模型发生整体缩短,模型左侧产生增厚抬升,右侧基本保持不变.
我们也分析了经过多个地震循环后的总位移(图 6).从图 6a中可以看出,模型总的水平缩短主要由断层位错所调解,模型左右两侧水平向上没有明显的永久变形,说明模型左右两盘积累的水平应变基本得到释放,没有产生水平永久变形.而垂向上(图 6b),模型左侧较大范围内产生显著的抬升,每经过一次地震循环,模型左侧部分均会产生一定量的永久抬升.如此经过多个地震循环,模型左侧及附近较大范围内积累了大量的垂向永久变形,而模型右侧仅有少量的水平变形和抬升.以上结果说明,模型的整体缩短,主要由断层位错以及模型左侧的增厚抬升所调解.

|
图 6 多个地震循环后的地表总位移 (a)水平位移;(b)垂向位移.其中横坐标0位置处表示断层所在位置;I表示震间加载阶段;C表示同震阶段;P表示震后应力松弛阶段.1T表示1个地震循环,依次类推. Fig. 6 Total surface displacement after multiple seismic cycles (a) Horizontal displacement; (b) Vertical displacement. Zero location on horizontal axis represents the fault, I represents inter-seismic, C represents co-seismic, P represents post-seismic. 1T represents one seismic cycle, and so forth. |
四川盆地中下地壳和上地幔黏度高、力学强度大(Royden et al., 1997; 胡圣标等, 2001; Li et al., 2006, 2008; 石耀霖等, 2008),因此,在模型中对四川盆地中下地壳和上地幔分配了高黏度值(表 1).深反射剖面、重磁、地温梯度研究表明,青藏高原东部中下地壳具有较低的黏度;其岩石圈呈现脆性的上地壳、韧性的中下地壳以及较强的上地幔的一种“三明治”式的结构;青藏东缘是具有热且软的结构(胡圣标等, 2001; Huang et al., 2007; 石耀霖等, 2008; 郭飚等, 2009; 刘启元等, 2009; Robert et al., 2010; Wang C Y et al., 2010b; 郑勇等, 2013).为了研究青藏东部岩石圈的黏度结构对地表变形的影响,我们对模型左侧中下地壳及岩石圈地幔使用不同的黏度值和黏度结构(表 2中模型1至模型5),分析了模型结果.所考察的黏度变化范围为1018~1021Pa·s(表 2);对于震后变形和地震循环时间尺度,这是一个合适的黏度范围(张培震等, 2008; 石耀霖等, 2008; 柳畅等, 2012; Zhu and Zhang, 2013).模型2为参考模型,模型1、3、4均是在模型2的基础上,只改变模型左侧中下地壳及岩石圈地幔的黏度大小,其他参数以及边界条件均不变.而模型5,相对于模型2只改变了岩石圈地幔黏度的大小,其他参数以及边界条件均不变.各个模型具体的黏度大小见表 2.可以看出模型1、2、3、4考虑黏度的大小对地表变形的影响,而模型5,考虑了黏度分层结构对地表变形的影响.
|
|
表 2 黏度η及断层角度φ设置 Table 2 Angle φ and viscosity η settings |
选取的震间地表变形速率为本次大地震发生前的一个时间步计算出的变形速率(图 7).从水平地表变形速率上看(图 7a),模型1左侧地表变形的曲线斜率与右侧相比较大,说明模型左侧相对于模型右侧发生更大的变形.模型2和模型3变形速率差异较小,模型2、3相较于模型1,左侧曲线斜率降低,而右侧的曲线斜率增加,说明左侧中下地壳与上地幔黏度的升高,使模型左侧的变形量降低,右侧的变形量增加.模型4相较于模型2、3,同样出现左侧的曲线斜率降低而右侧增加.以上结果说明当模型左右两侧中下地壳及岩石圈地幔黏度差异较大(左侧黏度较低)时,模型左侧相对于模型右侧会产生相对较大的水平速率梯度(或水平应变率),从而模型左侧相对于右侧将会产生较大的震间水平变形.而当黏度差异逐渐减小(左侧黏度增高)时,地表的水平变形速率呈现出趋于均匀的变形模式,模型左右两侧将产生均匀的水平变形.

|
图 7 震间地表变形速率对比 (a)水平速率;(b)垂向速率.其中横坐标0位置处表示断层所在位置. Fig. 7 Velocity contrast between different models at inter-seismic stage (a) Horizontal velocity; (b) Vertical velocity. Zero location on horizontal axis represents the fault. |
从垂向地表变形速率上看(图 7b),由于模型1、2、3左右两侧的黏度差异较大,模型右侧部分抬升速率较左侧相比均较小.因此,对比模型1、2、3显示,随着黏度的增加,模型左侧垂向抬升速率最大值向右偏移,并且其左侧边界的垂向抬升速率依次降低.这是因为当黏度变大时,中下地壳的剪切应力增大并且对上地壳施加剪切应力变大,从而致使上地壳的垂向变形速率的峰值右移.而模型4由于左右两侧的黏度差异较小,应变更易向模型右侧内部传递,导致垂向地表变形速率左右两侧差异变小,呈现出模型整体的抬升.对比模型1、2、3、4可以看出随着左右两侧黏度差异的降低,模型两侧的抬升速率差异也随之降低.
模型5相对于模型2仅存在岩石圈地幔的黏度差异,而相对于模型4仅存在中下地壳的黏度差异.模型5的水平变形速率较模型2和模型4并没有明显的差异(图 7a),但也明显表现出模型左侧变形速率较右侧大的特点.在垂向上(图 7b),模型5的变形速率介于模型2和模型4之间.
2.2.2 对同震地表变形速率的影响提取大地震同震时刻的地表位移如图 8所示.从图 8中可以看出,模型左侧的中下地壳及上地幔的黏度结构和黏度大小的变化,对同震的变形样式几乎没有影响.这是因为在大地震的同震瞬间,模型整个区域表现为弹性响应;不同的黏度值不影响这个瞬间的弹性变形和位移.

|
图 8 同震地表位移对比 (a)水平位移;(b)垂向位移.其中横坐标0位置处表示断层所在位置. Fig. 8 Displacement contrast between different models at co-seismic stage (a) Horizontal displacement; (b) Vertical displacement. Zero location on horizontal axis represents the fault. |
选取的震后地表变形速率为大地震发生之后的一个时间步计算出的变形速率.模型1、2、3、4的震后变形速率对比显示(图 9),随着模型左侧中下地壳及上地幔黏度的增加,震后的水平和垂向变形速率均逐渐减低,说明了不同的黏度值对震后变形速率的影响.模型5相对于模型2(图 9),由于上地幔黏度的增大,导致水平变形速率的降低,但降低幅度较小;在垂直变形速率上,模型5的变形速率相对模型2较小,且变形范围较窄.因此,相对于上地幔,中下地壳的黏度大小对震后地表变形速率影响更大.这些结果与前人关于中下地壳及上地幔的黏度对上地壳震后变形的影响的研究结果是一致的(Freed and Burgmann, 2004; Hilley et al., 2005; 许才军等, 2009; Li et al., 2009).

|
图 9 震后5年地表平均变形速率对比 (a)水平变形速率;(b)垂向变形速率.其中横坐标0位置处表示断层所在位置(注意纵坐标轴尺度的变化). Fig. 9 Average velocity contrast between different models for first 5 years after an earthquake at post-seismic stage (a) Horizontal velocity; (b) Vertical velocity. Zero location on horizontal axis represents the fault (note the change of scale of vertical axis). |
为了探讨断层倾角对同震地表位移的影响,我们对两个具有不同断层倾角的模型进行模拟.其中模型3的断层角度为30°,为低角度断层(模型2);模型6的断层角度为60°,为高角度断层(模型6).为探讨断层几何形态对地表位移的影响,我们也设置了一个断层倾角从顶部到底部逐渐变化的模型(模型7);模型7的断层角度深部为30°,至浅部逐渐过渡到60°,为铲形断层.模型7从断层几何形状上更接近真实的龙门山断层带,因为2008年MW7.9汶川地震的主断层北川—映秀断层呈铲形,且其深部断层倾角约30°,而浅部断层角度>60°(Liu-Zeng et al., 2009; Zhang et al., 2010; Zhu and Zhang, 2013).模型2、6和7(表 2)仅存在断层倾角和几何形态上的差异,其他参数条件均不变.
图 10显示了计算的同震位移矢量图,可以看出不同的断层模型具有不同的同震变形样式.图 11为计算的同震地表位移曲线.

|
图 10 计算同震位移矢量图 (a)模型2,断层角度为30°;(b)模型6,断层角度为60°;(c)模型7,断层角度为30°~60°.其中横坐标0位置处表示断层所在位置.纵坐标0位置处为地表. Fig. 10 Computed co-seismic slip vectors (a) Model 2, the fault angle is 30°; (b) Model 6, the fault angle is 60°; (c) Model 7, the fault angle is 30°~60°. Zero location on horizontal axis represents the fault. Zero location on vertical axis represents the surface. |

|
图 11 不同断层几何形态的同震地表位移对比 (a)水平位移;(b)垂向位移.其中横坐标0位置处表示断层所在位置. Fig. 11 Co-seismic displacement contrast between different models which have different fault geometries (a) Horizontal displacement; (b) Vertical displacement. Zero location on horizontal axis represents the fault. |
从同震水平位移上看(图 11a),低角度断层在断层两侧及附近产生了较大的水平缩短,断层两侧水平位错高达13 m;而高角度断层模型具有很小的水平缩短,断层两侧水平位错约5 m.从垂向变形上看(图 11b),不同角度的模型也表现出不同的变形样式,低角度模型断层两侧的最大相对抬升为8 m,而高角度模型断层两侧的最大相对抬升为11 m;低角度模型断层右侧没有发生明显的下降,而高角度模型断层右侧较小范围内产生较大的沉降.铲形模型的特点表现为前两者的结合,表现出断层远处缩短量较大,至断层附近时逐渐改变为向上抬升(图 11a与11b).这些结果说明,低角度断层产生的同震水平缩短量大,而且其水平缩短量比垂向抬升量大;反之,高角度断层的同震水平缩短量小,而且其水平缩短量比垂向抬升量小;而铲形断层在距离断层较远处产生较大的水平缩短,至断层附近产生显著的垂向抬升(图 11).在长期的构造演化过程中,龙门山断层带的大地震可以在其不同的断裂带上破裂(图 1),并不总是沿着单一产状的断层破裂,汶川地震也仅是构造演化过程中所有地震当中的一个特例.对逆冲断层不同倾角和几何形状的模拟,研究断层几何形态对地表变形的影响,可以帮助我们理解同震变形和断层几何形状之间的关系,以及帮助地球科学家通过野外观测数据估算断层沿深部的几何形态.
2.4 铲形龙门山断裂带的地震循环位移演化综合以上研究结果,我们使用了更现实的龙门山断裂带的几何形状,以及青藏东部弱的中下地壳和强的上地幔的黏度结构(模型8,见表 2),进行龙门山断裂带地震循环的数值模拟.模型左侧中下地壳黏度为5.0×10¹⁹ Pa·s-1;岩石圈地幔黏度为7.0×10²⁰ Pa·s-1.2008年MW7.9汶川地震,发生于北川—映秀断裂和彭灌断裂(刘静等, 2008; 徐锡伟等, 2008);作为主断裂的北川—映秀断层呈铲形,且其深部断层倾角约30°,而浅部断层角度>60°(Liu-Zeng et al., 2009; Zhang et al., 2010; Zhu and Zhang, 2013).因此,模型8的断层形状为铲形,即倾角从深部的30°,至浅部的60°.其他参数相对于参考模型均不变.
我们使用了地表观测数据包括GPS和大地水准测量数据(Zhang et al., 2004; Gan et al., 2007; Shen et al., 2009; Wang et al., 2009; Zhao et al., 2015),并经过投影获得地表运动速度(图 12),作为模型约束.震前地表观测数据为汶川地震发生之前近十年的平均地表变形速率,因此我们将求取模拟的大地震之前十年的平均变形速率与之对比,体现了大地震发生之前震间构造加载的变形速率(图 12a);同震地表位移为汶川地震发生时刻观测到的地表位移,将模拟的大地震同震位移与之对比,反映了同震时刻的地表变形(图 12b);震后地表观测数据为汶川地震之后6年的平均地表变形速率,将求取模拟的大地震震后6年的平均地表变形速率与之对比,体现了震后时刻的地表变形速率(图 12c).

|
图 12 模拟地表变形和地表观测数据的对比 (a)震间变形速率;(b)同震位移;(c)震后变形速率.其中横坐标0位置处表示断层所在位置.GPS代表GPS观测数据,Leveling代表大地测量数据,Comp代表模拟结果,H代表水平方向,V代表垂直方向. Fig. 12 Contrast between modeling results and observation data (a) Velocity at inter-seismic stage; (b) Co-seismic displacement; (c) Average velocity of the first 5 years at post-seismic stage. Zero location on horizontal axis represents the fault. GPS represents GPS data, Leveling represents the geodetic data, Comp represents model results, H represents the horizontal direction, V represents the vertical direction. |
震间、同震及震后的变形模拟结果与地表观测数据对比均显示出较好的对比效果(图 12),因为该模型(模型8,表 2)能够反映出龙门山两侧青藏东缘与四川盆地的相对强度、黏度结构以及龙门山断裂带的几何形态的特征.图 12b中同震水平位移观测结果和模拟结果对比相差较大,可能的原因是:1)模拟断层水平位移和断层角度及断层几何形状有关,从图 11a中可以看出断层的角度越大上盘的水平位移越小;而本模型所设置的浅部断层角度偏小,实际地质调查也发现某些部位断层角度大于60°.2)选取的地表观测数据分布稀疏且分散(图 1b),采用单一产状的断层模型不能完全表征真实情况下断层的扩展样式(比如,断层的几何形状、倾角沿着断层走向变化),因此其模拟结果也不能完全表征分布分散的观测站点所获得实际观测数据.以上因素可能解释同震水平位移观测结果和模拟结果对比相差较大的原因.
经过一次地震循环的变形演化如图 13所示.对一个大地震循环不同阶段的位移随发生的时间顺序进行叠加,得到该地震循环的总位移.一个地震循环后从水平总位移可以看出(图 13a),地震(断层位错)释放了总变形量的60%;青藏东部内部有少量残余变形,约30%;而四川盆地内部有更少量残余变形,约10%.而垂向总变形显示(图 13b),青藏东部广大范围内产生了抬升,且随断层的距离越近抬升越大,而四川盆地内部基本不抬升.因此,经过一次地震循环,青藏东部产生了明显的缩短与抬升,而四川盆地基本不变形.

|
图 13 龙门山断裂带的一个地震循环地表总位移 (a)水平位移;(b)垂向位移.其中横坐标0位置处表示断层所在位置;I表示震间加载阶段;C表示同震阶段;P表示震后应力松弛阶段. Fig. 13 Total surface displacement of one seismic circle in Longmen Shan fault zone (a) Horizontal displacement; (b) Vertical displacement. Zero location on horizontal axis represents the fault. I represents inter-seismic, C represents co-seismic, P represents post-seismic. |
我们开发并使用了一个二维黏弹塑性有限元模型模拟了龙门山断裂带的地震循环.研究了跨龙门山断层带的地震循环各个阶段(包括震间加载阶段、同震位错瞬间和震后中下地壳上地幔的黏弹性松弛阶段)的位移,一个地震循环和多个地震循环的位移演化.模型结果显示(图 13):震间加载期在青藏东部上地壳积累了挤压变形;这些变形被龙门山断层大地震大大地释放了;而震后变形进一步恢复青藏东部的挤压变形;因此,跨龙门山断层带的地震循环的总的变形中的大部分(永久变形或塑性变形)由龙门山断裂带容纳,形成了青藏东部永久的垂直抬升,青藏东部内部仍然容纳了小部分的挤压变形,而四川盆地内部有更微小的挤压变形.在我们的模型里,在青藏东部和四川盆地内部,都不包含断层.因此,地震循环应变位移演化的结果是在青藏东部和四川盆地的残余变形几乎是比较均匀地分布在它们内部.如果在一个更加现实的包含了青藏东部和四川盆地内部断层(比如龙泉山断层)的模型里,这些均匀分布的残余的永久变形将集中分布于其内部的断层;并由这些内部断层吸收容纳(Hubbard and Shaw, 2009; Sun et al., 2016).
我们探索了青藏东部中下地壳及上地幔的黏度与黏度结构对模型结果的影响.青藏东部中下地壳及上地幔的黏度越低,大地震后的黏弹性松弛效应在震后短时间内的作用就越大,震后变形速度也越大(图 9)(Hammond et al., 2009; 张克亮和魏东平, 2009).许多学者利用这一特征和震后变形速率的地表观测数据来约束和反演中下地壳及上地幔的黏度(Hilley et al., 2005).模型1~4结果显示(图 7),藏东和川西较大的中下地壳及上地幔的黏度差异是造成它们较大的震间变形速率差异的前提.当藏东中下地壳及上地幔黏度在1018~1020 Pa·s范围内时,藏东与川西存在较大的震间变形速率差异.当黏度为~1021 Pa·s时,川西盆地产生较大变形速率,这与实际观测不符.因此,青藏东部和四川盆地较大的黏度差异或力学强度差异是造成其差异抬升的一个先决条件.通过模型1~4的模拟结果(图 7)可见,当黏度较低(1018 Pa·s)时,模型在加载边界附近抬升速率最大,而当黏度较高时(1020 Pa·s)时,模型在断层附近抬升最快.这是因为当黏度变大时,中下地壳的剪切应力增大并且对上地壳施加剪切应力变大,从而致使上地壳的垂向变形速率的峰值右移.
我们也分析了断层倾角和断层几何形状对模型结果的影响.模型结果也与前人的模拟结果一致(Zhu and Zhang, 2013).比如:断层倾角越低,地震同震的水平位错越大,而同震的垂向位移越小;而高倾角断层易于造成较小的水平位错和较大的垂向抬升(图 11).一个铲形的龙门山断层模型计算的震间速度和同震位移,可以与GPS和Leveling地形变数据吻合很好(图 12).另外,我们发现拥有铲形龙门山断层以及青藏东部低黏度的中下地壳和相对高黏度的上地幔的模型(模型8,表 2),其计算的震间速度、同震位移和震后速度都可以与GPS及Leveling地形变观测数据拟合很好(图 12).模型8计算的一个地震循环的水平位移(图 13a)显示,在断裂带附近震间累积的挤压变形没有被完全恢复,因此藏东上地壳累积的应变没有被完全释放,从而产生永久变形储存在藏东上地壳;而垂向位移(图 13b)显示藏东龙门山附近较小范围内具有较大的抬升,且川西盆地抬升不明显.
地壳缩短是导致造山的重要机制(Yin and Harrison, 2000; Allmendinger et al., 2003).我们的模型模拟了地壳缩短的构造加载条件下龙门山断层带地震循环位移和速度分布及演化;经过地震循环各个时期以及多个地震循环的演化,青藏东部被大大抬升了.
剥蚀作用对造山有重要的影响(Fu et al., 2011).由于我们没有模拟地质造山过程,并且剥蚀作用的物理机制还不是很清楚,只有相应的经验方程的描述(Howard and Kerby, 1983; Tucker et al., 2001),因此我们的模型没有模拟剥蚀作用.影响剥蚀作用的因素有很多且约束差,因此把剥蚀作用加入本模型会造成模型参数变多且很难约束.
在此强调我们的模型没有模拟大变形的长期地质造山过程,因为我们的模型是被设计来研究和解释短期地壳变形和长期地质变形之间关系和连接的.近二三十年以来,空间依赖的地形变测量蓬勃发展(孙超, 1989; 陈俊勇, 2005),其测量数据(如GPS和InSAR)越来越丰富(Zhang et al., 2004; Gan et al., 2007; Shen et al., 2009; Wang et al., 2009; Zhao et al., 2015).地球科学家面临一个重要问题:如何从这些短期地壳变形信号提取长期地质变形信号,或者短期地壳变形如何与长期地质变形相联系.我们的模型探索了这个问题.我们模拟了地震循环,模型结果把短期地壳变形和长期地质造山(长期变形)连接起来.
青藏东部中下地壳流是导致青藏东部抬升隆起的一个重要机制;这个机制会对地壳和地表位移及速度产生影响(Royden et al., 1997, 2008; Clark and Royden, 2000).本文的模型中,我们没有考虑青藏东部中下地壳流的影响.但目前,我们正在研究青藏东部中下地壳流在地震循环中对地壳和地表变形的影响;这个影响将在我们未来的研究和文章中查明.龙门山断层带附近还存在着其他重要的断层,比如岷江断层、龙日坝断层、龙泉山断层(图 1b)等等,我们的模型只包括了龙门山断层,是对这个区域断层系统的简化.我们的二维平面应变模型也是对现实的三维的逆冲龙门山断层带的简化.在未来的研究中,我们可以查明这些简化对地震循环的变形造成的影响,比如可以考虑包含多条断层和使用三维更现实的模型来研究青藏东部地震循环的变形及其演化.
另外,一些研究指出龙门山断裂带大地震伴随大量的滑坡,其滑坡量大于同震抬升量从而造成龙门山的净亏损,从而可能销毁山区地形(Parker et al., 2011; 许冲和徐锡伟, 2012),但这些研究仍然处于争论之中.我们的模型也没有模拟地震可能导致的滑坡对变形和位移的影响.未来在更短时间尺度(一个或几个地震循环)的模型中,我们可以考虑包括水流剥蚀以及地震导致的滑坡和泥石流,调查它们对变形和位移的影响.
4 结论我们模拟了龙门山断裂带的地震循环的变形.模型结果将短期变形与长期造山联系起来.我们的研究结果说明,青藏东缘向东运动的过程中受到冷而硬的四川盆地的阻挡;在地震循环的过程中,藏东整体可以产生水平缩短增厚抬升;而在边界处龙门山区域,以断层位错(地震)的形式释放构造所积累的应变,造成龙门山逆冲褶皱冲断带的形成,青藏东缘与四川盆地的差异抬升.具体结论如下:
(1) 在龙门山断裂带地震循环过程中,震间的构造加载在龙门山断裂带及青藏东部较大范围内积累了变形;大地震大大释放了断裂带及其附近累积的应变;大地震发生后,由于中下地壳以及上地幔的黏性松弛效应,青藏东部继续东移和抬升.
(2) 经过一次地震循环青藏东部产生了明显的水平缩短,并产生了永久的抬升;经过多个地震循环,龙门山地区及青藏东部会抬升隆起.
(3) 青藏东部中下地壳和上地幔的不同黏度结构和黏度大小对震间速度分布和震后黏弹性松弛速度影响很大.青藏东部中下地壳及上地幔的黏度越低,大地震后的黏弹性松弛效应在震后短时间内的作用就越大、震后变形速度也越大.藏东和川西较大的中下地壳及上地幔的黏度差异是造成它们较大的震间变形速率差异的前提,是造成藏东和川西差异抬升形成龙门山最陡地形的一个先决条件.
(4) 不同的断层倾角和几何形状会导致不同的同震变形样式.低倾角断层产生的同震水平位移很大,且一般大于垂向位移,而高倾角断层反之.对于铲形断层,在距离断层较远处易于产生较大的水平缩短,而至断层附近易于产生显著的垂向抬升.
致谢感谢两位审稿专家提出的建设性意见和建议.
Allmendinger R W, Jordan T E, Kay M S, et al.
2003. The evolution of the Altiplano-Puna plateau of the central Andes. Annual Review of Earth and Planetary Sciences, 25(1): 139-174.
|
|
Avouac J P, Tapponnier P.
1993. Kinematic model of active deformation in central Asia. Geophysical Research Letters, 20(10): 895-898.
DOI:10.1029/93GL00128 |
|
Bendick R, Flesch L.
2007. Reconciling lithospheric deformation and lower crustal flow beneath central Tibet. Geology, 35(10): 895-898.
DOI:10.1130/G23714A.1 |
|
Bird P.
1991. Lateral extrusion of lower crust from under high topography in the isostatic limit. Journal of Geophysical Research:Solid Earth, 96(B6): 10275-10286.
DOI:10.1029/91JB00370 |
|
Burchfiel B C, Chen Z, Liu Y, et al.
1995. Tectonics of the Longmen Shan and adjacent regions. International Geology Review, 37(8): 661-735.
DOI:10.1080/00206819509465424 |
|
Burchfiel B C, Royden L H, van der Hilst R D, et al.
2008. A geological and geophysical context for the Wenchuan earthquake of 12 May 2008, Sichuan, People's Republic of China. GSA Today, 18(7): 4-11.
DOI:10.1130/GSATG18A.1 |
|
Chéry J, Zoback M D, Hassani R.
2001. An integrated mechanical model of the San Andreas fault in central and northern California. Journal of Geophysical Research:Solid Earth, 106(B10): 22051-22066.
DOI:10.1029/2001JB000382 |
|
Chen J Y.
2005. Contribution and progress in the determination of terrestrial coordinate frame, earth deformation and earth gravity field with spatial geodetic technology-Notes on IAG 2005 Scientific Assembly. Advances in Earth Science, 20(10): 1053-1058.
|
|
Chen Z, Burchfiel B C, Liu Y, et al.
2000. Global Positioning System measurements from eastern Tibet and their implications for India/Eurasia intercontinental deformation. Journal of Geophysical Research:Solid Earth, 105(B7): 16215-16227.
DOI:10.1029/2000JB900092 |
|
Clark M K, Royden L H.
2000. Topographic ooze:building the eastern margin of Tibet by lower crustal flow. Geology, 28(8): 703-706.
DOI:10.1130/0091-7613(2000)28<703:TOBTEM>2.0.CO;2 |
|
Cook K L, Royden L H.
2008. The role of crustal strength variations in shaping orogenic plateaus, with application to Tibet. Journal of Geophysical Research:Solid Earth, 113(B8): B08407.
DOI:10.1029/2007JB005457 |
|
Deng Q D, Chen S F, Zhao X L.
1994. Tectonics, seismicity and dynamics of Longmen Shan mountains and its adjacent regions. Seismology and Geology, 16(4): 389-404.
|
|
Dirks P H G M, Wilson C J L, Chen S, et al.
1994. Tectonic evolution of the NE margin of the Tibetan Plateau:Evidence from the central Longmen Mountains, Sichuan province, China. Journal of Southeast Asian Earth Sciences, 9(1-2): 181-192.
DOI:10.1016/0743-9547(94)90074-4 |
|
Dixon T, Decaix J, Farina F, et al.
2002. Seismic cycle and rheological effects on estimation of present-day slip rates for the Agua Blanca and San Miguel-Vallecitos faults, northern Baja California, Mexico. Journal of Geophysical Research:Solid Earth, 107(B10): ETG 5-1-ETG 5-23.
DOI:10.1029/2000JB000099 |
|
Drucker D C, Prager W.
1952. Soil mechanics and plastic analysis for limit design. Quarterly of Applied Mathematics, 10(2): 157-165.
DOI:10.1090/qam/1952-10-02 |
|
Fay N P, Humphreys E D.
2005. Fault slip rates, effects of elastic heterogeneity on geodetic data, and the strength of the lower crust in the Salton Trough region, southern California. Journal of Geophysical Research:Solid Earth, 110(B9): B09401.
DOI:10.1029/2004JB003548 |
|
Freed A M, Ali S T, Bürgmann R.
2007. Evolution of stress in southern California for the past 200 years from coseismic, postseismic and interseismic stress changes. Geophysical Journal International, 169(3): 1164-1179.
DOI:10.1111/j.1365-246X.2007.03391.x |
|
Freed A M, Bürgmann R.
2004. Evidence of power-law flow in the Mojave desert mantle. Nature, 430(6999): 548-551.
DOI:10.1038/nature02784 |
|
Fu B H, Shi P L, Guo H D, et al.
2011. Surface deformation related to the 2008 Wenchuan earthquake, and mountain building of the Longmen Shan, eastern Tibetan Plateau. Journal of Asian Earth Sciences, 40(4): 805-824.
DOI:10.1016/j.jseaes.2010.11.011 |
|
Gan W J, Zhang P Z, Shen Z K, et al.
2007. Present-day crustal motion within the Tibetan Plateau inferred from GPS measurements. Journal of Geophysical Research:Solid Earth, 112(B8): B08416.
DOI:10.1029/2005JB004120 |
|
Guo B, Liu Q Y, Chen J H, et al.
2009. Teleseismic P-wave tomography of the crust and upper mantle in Longmenshan area, west Sichuan. Chinese Journal of Geophysics, 52(2): 346-355.
|
|
Guo X Y, Gao R, Randy Keller G, et al.
2013. Imaging the crustal structure beneath the eastern Tibetan Plateau and implications for the uplift of the Longmen Shan range. Earth and Planetary Science Letters, 379: 72-80.
DOI:10.1016/j.epsl.2013.08.005 |
|
Hammond W C, Kreemer C, Blewitt G. 2009. Geodetic constraints on contemporary deformation in the northern Walker Lane:3. Central Nevada seismic belt postseismic relaxation.//Oldow J S, Cashman P H, eds. Late Cenozoic Structure and Evolution of the Great Basin-Sierra Nevada Transition. Special Paper of the Geological Society of America, 447:33-54, doi:10.1130/2009.2447(03).
|
|
He J K, Lu S J, Wang W M.
2013. Three-dimensional mechanical modeling of the GPS velocity field around the northeastern Tibetan plateau and surrounding regions. Tectonophysics, 584: 257-266.
DOI:10.1016/j.tecto.2012.03.025 |
|
Hearn E H.
2003. What can GPS data tell us about the dynamics of post-seismic deformation?. Geophysical Journal International, 155(3): 753-777.
DOI:10.1111/gji.2003.155.issue-3 |
|
Hilley G E, Büergmann R, Zhang P Z, et al.
2005. Bayesian inference of plastosphere viscosities near the Kunlun fault, northern Tibet. Geophysical Research Letters, 32(1): L01302.
DOI:10.1029/2004GL021658 |
|
Howard A D, Kerby G.
1983. Channel changes in badlands. GSA Bulletin, 94(6): 739-752.
DOI:10.1130/0016-7606(1983)94<739:CCIB>2.0.CO;2 |
|
Hu S B, He L J, Wang J Y.
2001. Compilation of heat flow data in the China continental area (3rd Edition). Chinese Journal of Geophysics, 44(5): 611-626.
|
|
Hu C B, Zhou Y J, Cai Y E.
2009. A new finite element model in studying earthquake triggering and continuous evolution of stress field. Science in China Series D:Earth Sciences, 52(7): 994-1004.
DOI:10.1007/s11430-009-0082-3 |
|
Hu Y, Wang K L.
2012. Spherical-Earth finite element model of short-term postseismic deformation following the 2004 Sumatra earthquake. Journal of Geophysical Research:Solid Earth, 117(B5): B05404.
DOI:10.1029/2012JB009153 |
|
Huang J L, Zhao D P, Zheng S H.
2007. Lithospheric structure and its relationship to seismic and volcanic activity in southwest China. Journal of Geophysical Research:Solid Earth, 107(B10): ESE 13-1-ESE 13-14.
|
|
Huang L Y, Zhang B, Cheng H H, et al.
2017a. The co-seismic effect of the 2015 Chile Illapel MW8.3 earthquake and its effect on seismic risk of South America. Chinese Journal of Geophysics, 60(1): 163-173.
DOI:10.6038/cjg20170114 |
|
Huang L Y, Zhang B, Qu W L, et al.
2017b. The co-seismic effects of 2010 Maule earthquake. Chinese Journal of Geophysics, 60(3): 972-984.
DOI:10.6038/cjg20170312 |
|
Hubbard J, Shaw J H.
2009. Uplift of the Longmen Shan and Tibetan plateau, and the 2008 Wenchuan (M=7.9) earthquake. Nature, 457(7235): 194-197.
DOI:10.1038/nature07837 |
|
Hubbard J, Shaw J H, Klinger Y.
2010. Structural setting of the 2008 Mw7.9 Wenchuan earthquake, China, Earthquake. Bulletin of the Seismological Society of America, 100(5B): 2713-2735.
DOI:10.1785/0120090341 |
|
Jaeger J C, Cook N G W, Zimmerman R W. 2007. Fundamentals of Rock Mechanics. 4th ed. Malden, Massachusetts:Blackwell Publishing, 475.
|
|
Jia D, Chen Z X, Jia C Z, et al.
2003. Structural features of the Longmen Shan fold and thrust belt and development of the western Sichuan Foreland Basin, Central China. Geological Journal of China Universities, 2003.
|
|
Jia D, Wei G Q, Chen Z X, et al.
2006. Longmen Shan fold-thrust belt and its relation to the western Sichuan Basin in central China:new insights from hydrocarbon exploration. AAPG Bulletin, 90(9): 1425-1447.
DOI:10.1306/03230605076 |
|
Jia D, Li Y Q, Lin A M, et al.
2010. Structural model of 2008 MW7.9 Wenchuan earthquake in the rejuvenated Longmen Shan thrust belt, China. Tectonophysics, 491(1-4): 174-184.
DOI:10.1016/j.tecto.2009.08.040 |
|
Jia Q P, Jia D, Zhu A L, et al.
2007. Active tectonics in the Longmen thrust belt to the eastern Qinghai-Tibetan plateau and Sichuan Basin:evidence from topography and seismicity. Chinese Journal of Geology, 42(1): 31-44.
|
|
Kanamori H, Anderson D L.
1975. Theoretical basis of some empirical relations in seismology. Bulletin of the Seismological Society of America, 65(5): 1073-1095.
|
|
Khan A S, Huang S. 1995. Continuum Theory of Plasticity. New York:John Wiley & Sons Inc., 440.
|
|
Kirby E, Reiners P W, Krol M A, et al.
2002. Late Cenozoic evolution of the eastern margin of the Tibetan Plateau:Inferences from 40Ar/39Ar and (U-Th)/He thermochronology. Tectonics, 21(1): 1001.
DOI:10.1029/2000TC001246 |
|
Kirby E, Whipple K X, Tang W Q, et al.
2003. Distribution of active rock uplift along the eastern margin of the Tibetan Plateau:inferences from bedrock channel longitudinal profiles. Journal of Geophysical Research:Solid Earth, 108(B4): 2217.
DOI:10.1029/2001JB000861 |
|
Kirby E, Whipple K, Harkins N.
2008. Topography reveals seismic hazard. Nature Geoscience, 1(8): 485-487.
DOI:10.1038/ngeo265 |
|
Li C, Van Der Hilst R D, Toksöz M N.
2006. Constraining P-wave velocity variations in the upper mantle beneath Southeast Asia. Physics of the Earth and Planetary Interiors, 154(2): 180-195.
DOI:10.1016/j.pepi.2005.09.008 |
|
Li C, Van Der Hilst R D, Engdahl E R, et al.
2008. A new global model for P wave speed variations in Earth's mantle. Geochemistry, Geophysics, Geosystems, 9(5): Q05018.
DOI:10.1029/2007GC001806 |
|
Li H B, Si J L, Pan J W, et al.
2008. Deformation feature of active fault and recurrence intervals estimation of large earthquake. Geological Bulletin of China, 27(12): 1968-1991.
|
|
Li Q S, Liu M.
2006. Geometrical impact of the San Andreas fault on stress and seismicity in California. Geophysical Research Letters, 33(8): L08302.
DOI:10.1029/2005GL025661 |
|
Li Q S, Liu M, Zhang H.
2009. A 3-D viscoelastoplastic model for simulating long-term slip on non-planar faults. Geophysical Journal International, 176(1): 293-306.
DOI:10.1111/j.1365-246X.2008.03962.x |
|
Li Y, Zhou R J, Densmore A L, et al.
2006. Geomorphic evidence for the late Cenozoic strike-slipping and thrusting in Longmen Mountain at the eastern margin of the Tibetan Plateau. Quaternary Sciences, 26(1): 40-51.
|
|
Lin A M, Jia D, Ren Z K, et al.
2008. Reports on the co-seismic surface rupture and related disasters associated with the MW7.9 Wenchuan earthquake, China. Journal of Geography, 117(3): 593-598.
DOI:10.5026/jgeography.117.593 |
|
Lin A M, Ren Z K, Jia D, et al.
2009. Co-seismic thrusting rupture and slip distribution produced by the 2008 Mw 7.9 Wenchuan earthquake, China. Tectonophysics, 471(3-4): 203-215.
DOI:10.1016/j.tecto.2009.02.014 |
|
Liu C, Zhu B J, Shi Y L.
2012. Stress accumulation of the Longmenshan fault and recurrence interval of Wenchuan earthquake based on viscoelasticity simulation. Acta Geologica Sinica, 86(1): 157-169.
|
|
Liu C, Shi Y L, Zhu B J, et al.
2014. Crustal rheology control on the mechanism of the earthquake generation at the Longmen Shan fault. Chinese Journal of Geophysics, 57(2): 404-418.
DOI:10.6038/cjg20140207 |
|
Liu C, Zhu B J, Yang X L.
2015. How does crustal shortening contribute to the uplift of the eastern margin of the Tibetan Plateau?. Journal of Asian Earth Sciences, 98: 18-25.
DOI:10.1016/j.jseaes.2014.10.037 |
|
Liu J, Zhang Z H, Wen L, et al.
2008. The MS8.0 Wenchuan earthquake co-seismic rupture and its tectonic implications-an out-of-sequence thrusting event with slip partitioned on multiple faults. Acta Geologica Sinica, 82(12): 1707-1722.
|
|
Liu M, Wang H, Li Q S.
2010. Inception of the Eastern California shear zone and evolution of the Pacific-North American plate boundary:from kinematics to geodynamics. Journal of Geophysical Research:Solid Earth, 115(B7): B07401.
DOI:10.1029/2009JB007055 |
|
Liu Q Y, Li Y, Chen J H, et al.
2009. Wenchuan MS8.0 earthquake:preliminary study of the S-wave velocity structure of the crust and upper mantle. Chinese Journal of Geophysics, 52(2): 309-319.
|
|
Liu-Zeng J, Zhang Z, Wen L, et al.
2009. Co-seismic ruptures of the 12 May 2008, MS8.0 Wenchuan earthquake, Sichuan:East-west crustal shortening on oblique, parallel thrusts along the eastern edge of Tibet. Earth and Planetary Science Letters, 286(3-4): 355-370.
DOI:10.1016/j.epsl.2009.07.017 |
|
Luo G, Liu M.
2009. How does trench coupling lead to mountain building in the Subandes? A viscoelastoplastic finite element model. Journal of Geophysical Research:Solid Earth, 114(B3): B03409.
DOI:10.1029/2008JB005861 |
|
Luo G, Liu M.
2010. Stress evolution and fault interactions before and after the 2008 Great Wenchuan earthquake. Tectonophysics, 491(1-4): 127-140.
DOI:10.1016/j.tecto.2009.12.019 |
|
Luo G, Liu M.
2012. Multi-timescale mechanical coupling between the San Jacinto fault and the San Andreas fault, southern California. Lithosphere, 4(3): 221-229.
DOI:10.1130/L180.1 |
|
Okada Y.
1985. Surface deformation due to shear and tensile faults in a half-space. Bulletin of the Seismological Society of America, 75(4): 1135-1154.
|
|
Pande G N. 1990. Numerical Methods in Rock Mechanics. West Sussex, England:John Wiley & Sons Inc., 327.
|
|
Parker R N, Densmore A L, Rosser N J, et al.
2011. Mass wasting triggered by 2008 Wenchuan Earthquake is greater than orogenic growth. Nature Geoscience, 4(7): 449-452.
DOI:10.1038/ngeo1154 |
|
Pollitz F F.
2001. Viscoelastic shear zone model of a strike-slip earthquake cycle. Journal of Geophysical Research:Solid Earth, 106(B11): 26541-26560.
DOI:10.1029/2001JB000342 |
|
Robert A, Zhu J, Vergne J, et al.
2010. Crustal structures in the area of the 2008 Sichuan earthquake from seismologic and gravimetric data. Tectonophysics, 491(1-4): 205-210.
DOI:10.1016/j.tecto.2009.11.010 |
|
Royden L H, Burchfiel B C, King R W, et al.
1997. Surface deformation and lower crustal flow in eastern Tibet. Science, 276(5313): 788-790.
DOI:10.1126/science.276.5313.788 |
|
Royden L H, Burchfiel B C, Van Der Hilst R D.
2008. The geological evolution of the Tibetan Plateau. Science, 321(5892): 1054-1058.
DOI:10.1126/science.1155371 |
|
Savage J C.
1983. A dislocation model of strain accumulation and release at a subduction zone. Journal of Geophysical Research:Solid Earth, 88(B6): 4984-4996.
DOI:10.1029/JB088iB06p04984 |
|
Shen Z K, Zhao C K, Yin A, et al.
2000. Contemporary crustal deformation in East Asia constrained by Global Positioning System measurements. Journal of Geophysical Research:Solid Earth, 105(B3): 5721-5734.
DOI:10.1029/1999JB900391 |
|
Shen Z K, Sun J B, Zhang P Z, et al.
2009. Slip maxima at fault junctions and rupturing of barriers during the 2008 Wenchuan earthquake. Nature Geoscience, 2(10): 718-724.
DOI:10.1038/ngeo636 |
|
Shen Z K, Lü J N, Wang M, et al.
2005. Contemporary crustal deformation around the southeast borderland of the Tibetan Plateau. Journal of Geophysical Research:Solid Earth, 110(B11): B11409.
DOI:10.1029/2004JB003421 |
|
Shi Y L, Cao J L.
2008. Effective viscosity of China continental lithosphere. Earth Science Frontiers, 15(3): 82-95.
DOI:10.1016/S1872-5791(08)60064-0 |
|
Simpson G.
2015. Accumulation of permanent deformation during earthquake cycles on reverse faults. Journal of Geophysical Research:Solid Earth, 120(3): 1958-1974.
DOI:10.1002/2014JB011442 |
|
Smith B, Sandwell D.
2004. A three-dimensional semianalytic viscoelastic model for time-dependent analyses of the earthquake cycle. Journal of Geophysical Research:Solid Earth, 109(B12): B12401.
DOI:10.1029/2004JB003185 |
|
Sun C.
1989. Geodetic deformation measurement and space technology. Advances in Earth Sciences, 4(2): 4-8.
|
|
Sun C, Jia D, Yin H W, et al.
2016. Sandbox modeling of evolving thrust wedges with different pre-existing topographic relief:implications for the Longmen Shan thrust belt, eastern Tibet. Journal of Geophysical Research:Solid Earth, 121(6): 4591-4614.
DOI:10.1002/2016JB013013 |
|
Tan X B, Xu X W, Lee Y H, et al.
2015. Differential Late-Cenozoic vertical motions of the Beichuan-Yingxiu Fault and the Jiangyou-Guanxian Fault in the central Longmenshan range and their tectonic implications. Chinese Journal of Geophysics, 58(1): 143-152.
DOI:10.6038/cjg20150112 |
|
Tapponnier P, Xu Z Q, Roger F, et al.
2001. Oblique stepwise rise and growth of the Tibet plateau. Science, 294(5547): 1671-1677.
DOI:10.1126/science.105978 |
|
Tucker G E, Lancaster S T, Gasparini N M, et al. 2001. The channel-hillslope integrated landscape development model (CHILD).//Harmon R S, Doe W W, eds. Landscape Erosion and Evolution Modeling. Boston, MA:Springer, 349-388.
|
|
Wang C Y, Han W B, Wu J P, et al.
2007. Crustal structure beneath the eastern margin of the Tibetan plateau and its tectonic implications. Journal of Geophysical Research:Solid Earth, 112(B7): B07307.
DOI:10.1029/2005JB003873 |
|
Wang C Y, Flesch L M, Silver P G, et al.
2008. Evidence for mechanically coupled lithosphere in central Asia and resulting implications. Geology, 36(5): 363-366.
DOI:10.1130/G24450A.1 |
|
Wang C Y, Lou H, Silver P G, et al.
2010b. Crustal structure variation along 30°N in the eastern Tibetan Plateau and its tectonic implications. Earth and Planetary Science Letters, 289(3-4): 367-376.
DOI:10.1016/j.epsl.2009.11.026 |
|
Wang H, Liu M, Shen X H, et al.
2010a. Balance of seismic moment in the Songpan-Ganze region, eastern Tibet:Implications for the 2008 Great Wenchuan earthquake. Tectonophysics, 491(1-4): 154-164.
DOI:10.1016/j.tecto.2009.09.022 |
|
Wang H, Li H B, Si J L, et al.
2013. The relationship between the internal structure of the Wenchuan earthquake fault zone and the uplift of the Longmenshan. Acta Petrologica Sinica, 29(6): 2048-2060.
|
|
Wang Q, Zhang P Z, Freymueller J T, et al.
2001. Present-day crustal deformation in China constrained by Global Positioning System measurements. Science, 294(5542): 574-577.
DOI:10.1126/science.1063647 |
|
Wang Q L, Cui D X, Zhang X, et al.
2009. Coseismic vertical deformation of the MS8.0 Wenchuan earthquake from repeated leveling and its constraint on listric fault geometry. Earthquake Science, 22(6): 595-602.
DOI:10.1007/s11589-009-0595-z |
|
Wang R J, Martín F L, Roth F.
2003. Computation of deformation induced by earthquakes in a multi-layered elastic crust-FORTRAN programs EDGRN/EDCMP. Computers & Geosciences, 29(2): 195-207.
|
|
Wang Y X, Mooney W D, Han G H, et al.
2005. Crustal P-wave velocity structure from Altyn Tagh to Longmen mountains along the Taiwan-Altay geoscience transect. Chinese Journal of Geophysics, 48(1): 98-106.
|
|
Xu C, Xu X W. 2012. The correlation of the Wenchuan earthquake triggered landslide erosion and co-seismic crustal uplift.//The 28th Annual Meeting of the Chinese Society of Geophysics (in Chinese), Beijing, China. 2.
|
|
Xu C J, Wang J J, Wen Y M.
2009. Study of viscoelastic rheological model for postseismic relaxation:a case study on 1997 MW7.6 Manyi Earthquake. Geomatics and Information Science of Wuhan University, 34(3): 253-256.
|
|
Xu X W, Wen Z X, Ye J Q, et al.
2008. The MS8.0 Wenchuan earthquake surface ruptures and its seismogenic structure. Seismology and Geology, 30(3): 597-629.
|
|
Xu X W, Wen X Z, Yu G H, et al.
2009. Coseismic reverse-and oblique-slip surface faulting generated by the 2008 Mw7.9 Wenchuan earthquake. China. Geology, 37(6): 515-518.
DOI:10.1130/G25462A.1 |
|
Yin A, Nie S. 1996. A Phanerozoic palinspastic reconstruction of China and its neighboring regions.//Yin A, Harrison M, eds. The Tectonic Evolution of Asia. New York:Cambridge University Press, 442-485.
|
|
Yin A, Harrison T M.
2000. Geologic evolution of the Himalayan-Tibetan Orogen. Annual Review of Earth and Planetary Sciences, 28(28): 211-280.
|
|
Zhang K L, Wei D P.
2009. The influences of gravitation and viscoelasticity on coseismic and postseismic deformation in the Wenchuan Earthquake. Physics, 38(4): 254-260.
|
|
Zhang P Z, Shen Z K, Wang M, et al.
2004. Continuous deformation of the Tibetan Plateau from Global Positioning System data. Geology, 32(9): 809-812.
DOI:10.1130/G20554.1 |
|
Zhang P Z, Xu X W, Wen X Z, et al.
2008. Slip rates and recurrence intervals of the Longmen Shan active fault zone and tectonic implications for the mechanism of the May 12 Wenchuan earthquake, 2008, Sichuan, China. Chinese Journal of Geophysics, 51(4): 1066-1073.
|
|
Zhang P Z, Wen X Z, Shen Z K, et al.
2010. Oblique, high-angle, listric-reverse faulting and associated development of strain:The Wenchuan Earthquake of May 12, 2008, Sichuan, China. Annual Review of Earth and Planetary Sciences, 38(1): 353-382.
DOI:10.1146/annurev-earth-040809-152602 |
|
Zhang Z J, Wang Y, Chen Y, et al.
2009. Crustal structure across Longmenshan fault belt from passive source seismic profiling. Geophysical Research Letters, 36(17): L17310.
DOI:10.1029/2009GL039580 |
|
Zhao B, Huang Y, Zhang C H, et al.
2015. Crustal deformation on the Chinese mainland during 1998-2014 based on GPS data. Geodesy and Geodynamics, 6(1): 7-15.
DOI:10.1016/j.geog.2014.12.006 |
|
Zheng Y, Ge C, Xie Z J, et al.
2013. Crustal and upper mantle structure and the deep seismogenic environment in the source regions of the Lushan earthquake and the Wenchuan earthquake. Science China:Earth Sciences, 56(7): 1158-1168.
DOI:10.1007/s11430-013-4641-2 |
|
Zhu A Y, Zhang D N, Guo Y X.
2016. The numerical simulation on the seismogenic mechanism of the Lushan MS7.0 earthquake constrained by deformation observation. Chinese Journal of Geophysics, 59(5): 1661-1672.
DOI:10.6038/cjg20160511 |
|
Zhu S B, Zhang P Z.
2013. FEM simulation of interseismic and coseismic deformation associated with the 2008 Wenchuan Earthquake. Tectonophysics, 584: 64-80.
DOI:10.1016/j.tecto.2012.06.024 |
|
Zienkiewicz O C, Taylor R L. 2005. The Finite Element Method for Solid and Structural Mechanics. 6th ed. Burlington, Massachusetts:Butterworth-Heinemann, 631.
|
|
陈俊勇.
2005. 空间大地测量技术对确定地面坐标框架、地形变与地球重力场的贡献和进展——出席2005年国际大地测量协会(IAG)科学大会札记. 地球科学进展, 20(10): 1053–1058.
DOI:10.3321/j.issn:1001-8166.2005.10.002 |
|
邓起东, 陈社发, 赵小麟.
1994. 龙门山及其邻区的构造和地震活动及动力学. 地震地质, 16(4): 389–404.
|
|
郭飚, 刘启元, 陈九辉, 等.
2009. 川西龙门山及邻区地壳上地幔远震P波层析成像. 地球物理学报, 52(2): 346–355.
|
|
胡圣标, 何丽娟, 汪集旸.
2001. 中国大陆地区大地热流数据汇编(第三版). 地球物理学报, 44(5): 611–626.
|
|
黄禄渊, 张贝, 程惠红, 等.
2017a. 2015年智利Illapel MW8.3地震同震效应及其对南美大陆地震危险性影响. 地球物理学报, 60(1): 163–173.
DOI:10.6038/cjg20170114 |
|
黄禄渊, 张贝, 瞿武林, 等.
2017b. 2010智利Maule特大地震的同震效应. 地球物理学报, 60(3): 972–984.
DOI:10.6038/cjg20170312 |
|
贾东, 陈竹新, 贾承造, 等.
2003. 龙门山前陆褶皱冲断带构造解析与川西前陆盆地的发育. 高校地质学报, 9(3): 402–410.
|
|
贾秋鹏, 贾东, 朱艾斓, 等.
2007. 青藏高原东缘龙门山冲断带与四川盆地的现今构造表现:数字地形和地震活动证据. 地质科学, 42(1): 31–44.
|
|
李海兵, 司家亮, 潘家伟, 等.
2008. 活动断裂的变形特征及其大地震复发周期的估算. 地质通报, 27(12): 1968–1991.
DOI:10.3969/j.issn.1671-2552.2008.12.003 |
|
李勇, 周荣军, DensmoreA L, 等.
2006. 青藏高原东缘龙门山晚新生代走滑-逆冲作用的地貌标志. 第四纪研究, 26(1): 40–51.
|
|
柳畅, 朱伯靖, 石耀霖.
2012. 粘弹性数值模拟龙门山断裂带应力积累及大震复发周期. 地质学报, 86(1): 157–169.
|
|
柳畅, 石耀霖, 朱伯靖, 等.
2014. 地壳流变结构控制作用下的龙门山断裂带地震发生机理. 地球物理学报, 57(2): 404–418.
DOI:10.6038/cjg20140207 |
|
刘静, 张智慧, 文力, 等.
2008. 汶川8级大地震同震破裂的特殊性及构造意义——多条平行断裂同时活动的反序型逆冲地震事件. 地质学报, 82(12): 1707–1722.
DOI:10.3321/j.issn:0001-5717.2008.12.007 |
|
刘启元, 李昱, 陈九辉.
2009. 汶川MS8.0地震:地壳上地幔S波速度结构的初步研究. 地球物理学报, 52(2): 309–319.
|
|
石耀霖, 曹建玲.
2008. 中国大陆岩石圈等效粘滞系数的计算和讨论. 地学前缘, 15(3): 82–95.
|
|
孙超.
1989. 大地形变测量与空间技术. 地球科学进展, 4(2): 4–8.
|
|
谭锡斌, 徐锡伟, 李元希, 等.
2015. 龙门山中段中央断裂和前山断裂的晚新生代垂向活动性差异及其构造意义. 地球物理学报, 58(1): 143–152.
DOI:10.6038/cjg20150112 |
|
王焕, 李海兵, 司家亮, 等.
2013. 汶川地震断裂带结构特征与龙门山隆升的关系. 岩石学报, 29(6): 2048–2060.
|
|
王有学, MooneyWD, 韩果花, 等.
2005. 台湾-阿尔泰地学断面阿尔金-龙门山剖面的地壳纵波速度结构. 地球物理学报, 48(1): 98–106.
|
|
许冲, 徐锡伟. 2012. 汶川地震滑坡剥蚀量与地壳抬升量的关系. //中国地球物理学会第二十八届年会.
|
|
许才军, 汪建军, 温扬茂.
2009. 震后松弛过程的粘弹性模型在1997年MW7.6玛尼地震中的应用研究. 武汉大学学报(信息科学版), 34(3): 253–256.
|
|
徐锡伟, 闻学泽, 叶建青, 等.
2008. 汶川MS8.0地震地表破裂带及其发震构造. 地震地质, 30(3): 597–629.
|
|
张克亮, 魏东平.
2009. 重力与粘弹性对汶川地震同震及震后变形的影响. 物理, 38(4): 254–260.
|
|
张培震, 徐锡伟, 闻学泽, 等.
2008. 2008年汶川8.0级地震发震断裂的滑动速率、复发周期和构造成因. 地球物理学报, 51(4): 1066–1073.
|
|
郑勇, 葛粲, 谢祖军, 等.
2013. 芦山与汶川地震震区地壳上地幔结构及深部孕震环境. 中国科学(D辑), 43(6): 1027–1037.
|
|
祝爱玉, 张东宁, 郭颖星.
2016. 以形变观测为约束的芦山MS7.0地震孕震机理数值模拟研究. 地球物理学报, 59(5): 1661–1672.
DOI:10.6038/cjg20160511 |
|