 2018, Vol. 61


2. 中国地震局地震观测与地球物理成像重点实验室, 北京 100081;
3. Department of Geology, University of Illinois at Urbana-Champaign, IL 61820, USA;
4. 武汉大学测绘学院, 武汉 430079
2. Key Laboratory of Seismic Observation and Geophysical Imaging, China Earthquake Administration, Beijing 100081, China;
3. Department of Geology, University of Illinois at Urbana-Champaign, IL 61820, USA;
4. School of Geodesy and Geomatics, Wuhan University, Wuhan 430079, China
作为中国大陆东西部大地构造的主要分界,南北地震带的地壳厚度及岩石圈厚度发生了急剧的变化,并可以进一步分为北段、中段和南段,其中北段位于青藏高原和华北克拉通的过渡区域,区内主要块体包括阿拉善块体、鄂尔多斯盆地、松潘—甘孜块体、祁连造山带及秦岭造山带等(图 1)(王椿镛等, 2015).由于印度板块与欧亚板块的碰撞,青藏高原经历了南北向的缩短及向东、东南和东北方向的生长,这使得包括松潘—甘孜块体、秦岭造山带和祁连造山带在内的青藏高原东北缘发生了强烈的地质变形演化并影响了阿拉善块体、鄂尔多斯盆地等周边地块,从而导致了南北地震带北段地震活动频繁、构造作用强烈.获取南北地震带北段壳幔速度结构对于理解研究区域内不同块体之间的深部构造、动力学演化过程及青藏高原东北缘的变形机制有着重要的帮助.近年来,众多学者围绕着相关区域利用多种地球物理手段开展了大量的研究,包括人工深地震测深(滕吉文等, 2010; Wang et al., 2014; 王海燕等, 2014)、P波成像(Huang and Zhao, 2006; Liang and Song, 2006; Lei and Zhao, 2016; He and Santosh, 2017)、各向异性(王椿镛等, 2007; 钱旗伟等, 2017)、面波成像(黄忠贤等, 2013; Jiang et al., 2014; Li et al., 2014b; 余大新等, 2014)、接收函数(He et al., 2014; 刘启民等, 2014; 姚志祥等, 2014; 张洪双等, 2015)等等.

|
图 1 (a) 研究区地形与地质构造; (b)流动地震台站分布图 (a)中黑色虚线表示区内主要构造单元分界,蓝色箭头为相对于稳定欧亚板块的地壳运动(Liang et al., 2013).(b)中黑色三角代表地震台站,红色三角为图 4例子中两个台站的位置,红色实线表示图 7三条剖面的位置. Fig. 1 (a) Topography and geological setting in the study region; (b) Locations of temporary seismic stations (a) Black dashed lines represent main block boundaries. Blue arrows mark crust motion relative to the stable Eurasia block (Liang et al., 2013); (b) Black triangles represent seismic stations. Red triangles mark the two stations plotted in Fig. 4. Red solid lines are three profiles in Fig. 7. |
然而,由于台站分布不均匀及台间距较大等客观条件的制约,已有的一些研究结果难以获得较为精细且全面的结构特征.如果试图进一步提升研究的分辨率需要使用分布更为均匀的密集地震观测台阵.“中国地震科学台阵探测”项目二期在南北地震带北段区域布设了676套密集分布的流动数字地震观测台站,这为探测研究区地壳上地幔精细结构提供了可靠的数据保障.众多学者也围绕此项目的观测数据开展包括各向异性(常利军等, 2016; Chang et al., 2017; 谢振新等, 2017; 张艺和高原, 2017)、远震P波成像(郭慧丽等, 2017)、接收函数(王兴臣等, 2017)、面波成像(Li et al., 2017a; 潘佳铁等, 2017; 钟世军等, 2017)等方法在内的多种研究并得到了很多有意义的结果.这些新的结果有助于增强对南北地震带北段深部构造的认识和理解.例如接收函数与面波成像方法都是探测地下结构的有效手段,通过这些方法能够获得壳幔的S波速度结构,其中接收函数对于台站下方的速度界面信息较为敏感,但对S波的绝对速度不够敏感,与之相反,面波频散对于介质S波的平均速度敏感,但对速度变化约束较差(Ammon et al., 1990; Julià et al., 2000).因此,有必要通过新的地震观测资料及研究成果,对接收函数与面波频散进行联合反演,充分利用二者在介质速度结构研究上的互补性,弥补各自存在的缺点,进而获得更为可靠的S波速度结构(Deng et al., 2015; Zheng et al., 2016; 郑晨等, 2016; Li et al., 2017b).
本文利用研究区域内大范围高密度地震台阵的观测数据,对面波频散与接收函数数据进行联合反演.通过密集的台站分布、多种资料及方法的联合约束,得到研究区域更为准确可靠的壳幔S波速度结构,并在此基础上探讨研究区速度结构分布特征及地球动力学构造演化过程.
1 数据 1.1 接收函数本文所使用的接收函数数据为2013年9月到2015年8月期间布设在南北地震带北段区域的“中国地震科学台阵探测”项目二期676套流动地震台站为期两年的远震观测资料,选取震中距在30°~90°范围内,震级大于5.5级的远震事件,从中进一步挑选出具有清晰震相记录的398个地震事件,图 2给出了研究中所用到地震事件的震中位置分布情况.通过对波形数据进行去仪器响应、去倾斜、去均值、重采样等处理,并进行0.05~2 Hz频率范围的带通滤波,最后在时间域内进行反褶积计算,提取各个台站的接收函数(Ligorría and Ammon, 1999; Zhu and Kanamori, 2000).由于不同震中距的地震其Ps转换波与直达P波之间的走时差不同,进行倾斜叠加处理可以校正Ps转换波走时,从而压制噪声、增强Ps波信号.但需要说明的是,由于动校正算法仅针对Ps波,其他多次波在此过程中可能发生不恰当的改变.考虑到准确的Ps波走时与振幅信息对反演结果有着很大的影响而且截取接收函数部分波形进行计算能在一定程度上减小后续多次波对反演结果的干扰,因此本文首先对每个台站的接收函数进行动校正,将接收函数调整到67°参考震中距并叠加获得台站下方的平均接收函数(Yuan et al., 1997),然后截取前20 s波形作为联合反演的接收函数数据.

|
图 2 接收函数研究中所用远震事件的震中分布 Fig. 2 Epicentral distribution of teleseismic events for receiver functions used in this study |
本文所使用的Rayleigh波群速度和相速度频散数据同样来自于“中国地震科学台阵探测”项目二期记录的远震波形数据,通过基于连续小波变换的时频分析方法(Wu et al., 2009)测量得到超过18000条独立路径的频散曲线并最终反演获得了南北地震带北段区域分辨率高达0.5°×0.5°的Rayleigh波群速度和相速度分布(Li et al., 2017a; 潘佳铁等, 2017).我们从中提取了各个台站对应10~60 s的Rayleigh波群速度值和10~80 s的Rayleigh波相速度值作为联合反演的面波频散数据.
2 反演方法本文的反演程序基于NA算法(Neighborhood Algorithm)进行修改,在联合反演面波频散和接收函数数据时,通过对模型参数空间内的参数在一定的范围进行搜索,计算200个不同初始模型对应的失配值(misfit),从中选取失配值最低的5个模型并在各自Voronoi空间内均匀随机游动产生新的100个模型进行迭代计算,获得反演结果(Sambridge, 1999; Xu et al., 2013; 郑晨等, 2016).
本文将台站下方的S波速度结构分为3部分(图 3),分别表示沉积层、地壳、120 km深度内上地幔的速度结构.对于这3部分,分别用3个控制点、9个控制点、9个控制点的B样条曲线表示S波速度结构,加上沉积层厚度及地壳厚度2个参数,整个模型参数空间一共有23个参数.

|
图 3 联合反演中使用的23个参数 红色实线表示样条曲线,蓝色实线为根据样条曲线转换得到的分层模型. Fig. 3 Model parameters used in the joint inversion Red solid line represents the spline curve. Blue solid line represents the layered model from the spline curve. |
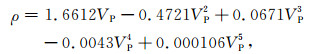
反演过程中,对不同参数给以不同的搜索区间,其中沉积层厚度的搜索范围为0~5 km,地壳厚度的搜索范围为30~70 km,并将每次搜索得到的样条曲线转换成分层速度模型,其中沉积层部分层厚0.1 km,地壳及上地幔顶部20 km部分层厚2 km,其余上地幔部分层厚5 km.同时,将各分层的VP/VS值固定,其中沉积层部分VP/VS值固定为2.0,地壳及地幔部分固定为1.75和1.795.然后,通过Nafe-Drake速度-密度关系式(Nafe and Drake, 1963)计算各层密度:
|
(1) |
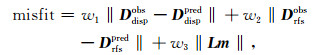
其中,ρ为密度,VP为P波的波速.根据分层速度模型可以正演得到理论面波频散及接收函数波形,并将正演结果代入式(2)计算失配值:
|
(2) |
式中,D代表面波频散及接收函数数据,L为Laplacian算子,m为模型参数,w1、w2、w3分别表示失配值计算中各部分的权重系数.首先,根据每次搜索的模型进行正演计算得到相应的面波频散,将其与实际面波频散比较,表示对面波频散数据的拟合程度,作为失配值的第一部分.同样,对搜索到的模型计算理论接收函数波形,将其与实际平均接收函数数据进行比较,表示对接收函数数据的拟合程度,作为失配值的第二部分.此外,为了减少最终获得S波速度模型相邻层间速度值的跳跃,根据Laplacian算子计算模型的平滑程度,作为失配值的第三部分.将每一部分赋以不同的权重并相加得到总的失配值,本文中三个权重分别选取1.0, 0.25, 0.2.整个联合反演过程一共进行800次迭代计算得到80200组模型并从中选取失配值最低的结果作为最终的S波速度模型.
3 结果根据前面介绍的联合反演方法对研究区域内各个台站的数据进行逐个反演,使用NA搜索得到失配值最低的S波速度模型,图 4给出了15720台站和51544台站的联合反演结果作为示例.其中,15720台站位于鄂尔多斯盆地中部,从反演结果来看,台站下方有着较厚的沉积层分布,并且在地壳和地幔部分S波速度值较大.而51544台站位于松潘—甘孜块体及秦岭造山带边界区域,其沉积层厚度很小,中下地壳及地幔部分S波速度值也较小.最后对所有台站的联合反演结果使用表面曲率连续的网格插值算法计算得到了整个研究区内地壳厚度、沉积层厚度和地壳上地幔S波速度结构.

|
图 4 利用面波频散和接收函数联合反演获得15720 (a),51544 (b)台站下方S波速度结构 对于每个台站,左侧小图中红色实线为失配值最低的S波速度模型,黑色背景为200组次优解.右上角小图黑色实线表示台站平均接收函数,红色虚线为根据S波速度模型正演得到的接收函数.右下角小图黑色三角表示真实的面波频散数据,红色实线为正演的面波频散曲线. Fig. 4 Joint inversion results with surface wave dispersion and receiver functions under station 15720 (a) and station 51544 (b) For each station, red solid line in the left figure represents the best VS model with smallest misfit value, and black background for the best 200 models. The black solid line in top right represents the averaged receiver function and the red dashed line denotes predicted receiver function. Black triangles in bottom right represent real surface wave dispersion data and the red solid lines denote surface wave dispersion from forward modeling. |
从地壳厚度的分布情况来看(图 5a),研究区域内地壳厚度从青藏高原东北缘向外总体呈现变薄的趋势.最厚的地壳厚度出现在北祁连造山带,其厚度超过了60 km,而鄂尔多斯盆地的中北部及蒙古褶皱带部分区域地壳厚度最薄,最薄处地壳厚度不到40 km.此结果与研究区域内地形高程变化有着一定的对应关系,同时也与此前学者通过人工地震、接收函数等方法获得的地壳厚度情况较为一致(滕吉文等, 2010; 王海燕等, 2014; Li et al., 2017a; Wang et al., 2017; 王兴臣等, 2017).

|
图 5 联合反演获得的地壳厚度(a)、沉积层厚度(b)分布图 黑色虚线表示区内主要构造单元分界. Fig. 5 Map of crustal thickness (a) and sedimentary thickness (b) from joint inversion Black dashed lines represent main block boundaries in study region. |
从沉积层厚度的分布情况来看(图 5b),本文获得的沉积层厚度与研究区域内盆地的分布情况较为一致.在鄂尔多斯盆地、河套盆地等区域有着非常厚的沉积层分布.同时,在阿拉善块体内部沿阿拉善经武威、张掖到酒泉一带呈条带状分布有若干较厚的沉积层,这些区域与巴彦浩特盆地、酒东盆地及酒西盆地的分布位置较为接近.此外在陇西及民和附近也有着一定沉积层的分布,而松潘—甘孜块体、秦岭造山带及北祁连造山带下方的沉积层厚度很小.
本文联合反演获得的地壳及上地幔S波速度结构水平切片结果(图 6)表明,研究区域各构造单元下方的速度结构有着一定的分布规律.具体表现为:

|
图 6 3 km (a)、22 km (b)、45 km (c)、70 km (d)、90 km (e)、110 km (f) S波速度模型深度水平切片 黑色虚线表示研究区内主要构造单元分界. Fig. 6 Horizontal slices of the VS model at depths of 3 km (a), 22 km (b), 45 km (c), 70 km (d), 90 km (e), and 110 km (f) Black dashed lines represent main block boundaries in study region. |
(1) 3 km深度的水平速度切片显示,在秦岭造山带、祁连造山带的东段以及蒙古褶皱带有着较高的S波速度,而鄂尔多斯盆地、河套盆地下方表现为S波低速异常,这些位置正好对应了研究区内沉积层较厚的区域.
(2) 22 km深度的水平速度切片显示,在松潘—甘孜块体、秦岭造山带西部及北祁连造山带下方有着S波低速异常,特别是松潘—甘孜块体及秦岭造山带西部低速异常显著.而鄂尔多斯盆地及蒙古褶皱带的部分区域分布有S波高速异常.
(3) 45 km深度的水平速度切片显示,研究区域内河套盆地、鄂尔多斯盆地中北部及蒙古褶皱带大部分区域已经开始进入地幔部分,有着相对较高的S波速度,而包括松潘—甘孜块体、北祁连造山带及秦岭造山带西部在内的青藏高原东北缘在此深度内还处于地壳部分,S波速度相对较低.
(4) 70 km深度的水平速度切片显示,研究区内的松潘—甘孜块体、北祁连造山带以及秦岭造山带的部分区域仍呈现为低速异常,而阿拉善块体、鄂尔多斯盆地的部分区域表现为S波高速异常,河套盆地下方高速异常显著.
(5) 90 km深度的水平速度切片显示,北祁连造山带及松潘—甘孜块体下方表现为低速异常,秦岭造山带呈现出高、低速异常兼具的分布特征.鄂尔多斯盆地在此深度内整体表现为明显的高速异常,而河套盆地下方的高速异常已经消失不见.
(6) 110 km深度的水平速度切片显示,研究区域内鄂尔多斯盆地及四川盆地下方表现为S波高速异常,松潘—甘孜块体、北祁连造山带及阿拉善块体西部等区域呈现为低速异常,而河套盆地在此深度内开始表现出较为明显的低速异常分布特征.
4 讨论和分析联合反演获得的壳幔速度结构显示,研究区域内不同块体下方的速度存在一定的分布特征.例如松潘—甘孜块体等青藏高原东北缘总体表现为S波低速异常,而鄂尔多斯盆地则在中下地壳以及上地幔部分都表现出较为明显的高速异常.为了更好地探讨研究区域内各块体的深部结构与地表构造之间的关系,本文沿3条不同测线(图 1b)给出测线下方的S波速度结构垂直切片(图 7).其中,AA′测线从西向东经过北祁连造山带、阿拉善块体及鄂尔多斯盆地,BB′测线从南向北穿过四川盆地、秦岭造山带、鄂尔多斯盆地及河套盆地,而CC′测线从松潘—甘孜块体沿北北东方向经过秦岭造山带、祁连造山带、阿拉善块体及河套盆地.

|
图 7 沿图 1b三条测线S波速度模型垂直切片 红色虚线代表地壳厚度,上方为切片所对应的地表地形. Fig. 7 Vertical cross-sections of VS model along three profiles in Fig. 1b Red dashed lines represent the crustal thickness. Topography is shown above each profile. |
地壳部分的S波速度结构显示,在松潘—甘孜块体、北祁连造山带及秦岭造山带的西部有着较低的S波速度,其中祁连造山带及秦岭造山带下方的低速异常主要出现在青藏高原东北缘一侧,表明青藏高原东北缘较低的力学强度.不同于北祁连造山带及秦岭造山带西部区域较低的S波速度,在祁连造山带和秦岭造山带的东部S波速度相对较高,而鄂尔多斯盆地中下地壳内分布有较为明显的高速异常,显示出刚性的特征.阿拉善块体在中下地壳深度内显示出高、低速异常共存的分布特征,从图 7a可以看出,阿拉善块体的中下地壳在103.5°E以西区域的S波速度明显小于103.5°E以东区域,这表明阿拉善块体西部可能更多地受到了祁连造山带等青藏高原东北缘的挤压作用而遭到破坏,而阿拉善块体的东部更接近于稳定的鄂尔多斯盆地,有着相对较为坚硬的中下地壳.接收函数的研究同样表明,阿拉善块体西部相比阿拉善块体东部有着较低的泊松比和较厚的地壳厚度(王兴臣等, 2017).此外,研究区域内地壳厚度由西向东、由南向北呈现出逐渐减薄的趋势.从北祁连造山带向东到阿拉善块体下方存在一个明显的Moho界面抬升(图 7a),此变化与地表地形的起伏形状有着较好的对应关系.需要注意的是,从秦岭造山带到祁连造山带东部区域地表高程由4 km下降到2 km,但Moho界面起伏不大(图 7c),此结果与相关区域的远震接收函数研究结果一致(张洪双等, 2015; 王兴臣等, 2017),人工地震剖面的结果同样显示从松潘—甘孜地块横过秦岭造山带有着平均51 km的Moho深度,没有显著的变化(王海燕等, 2014).与同为青藏高原东北缘的北祁连造山带约60 km地壳厚度相比,秦岭造山带的地壳厚度明显偏小,张洪双等(2015)的研究表明在此区域下方下地壳厚度仅有15~20 km,这可能说明了秦岭造山带在青藏高原隆起后经历了强烈的伸展减薄作用(王海燕等, 2014).
4.2 壳内低速层的分布地壳流模型认为青藏高原存在地质时间尺度上可以塑形流动的中下地壳,高原相对软弱的地壳物质在向东逃逸过程中受刚性四川盆地的阻挡分成东南和东北两个方向沿青藏高原的东南缘和东北缘挤出(Royden et al., 1997; Clark and Royden, 2000; Shen et al., 2001).近年来的多种地球物理观测结果表明,在青藏高原东南缘部分区域存在明显的地球物理性质异常,如高电导率(Bai et al., 2010)、低S波速度(Bao et al., 2015b; 郑晨等, 2016)、低Q值(Zhao et al., 2013)、高泊松比(Sun et al., 2014)、高大地热流值(Hu et al., 2000),这些研究结果为青藏高原东南缘的地壳流提供了证据.然而关于青藏高原东北缘是否存在地壳流还存在一定的争议.
本文的研究结果表明,在北祁连造山带(图 7a)、松潘—甘孜块体和秦岭造山带西部区域(图 7c)下方中下地壳深度范围内确实观测到了S波低速异常的分布,该分布特征同样可见于此前的许多面波成像结果(Yang et al., 2012; Bao et al., 2015a; Li et al., 2017a)及人工地震剖面(Zhang et al., 2013).然而,如果具体分析可以发现北祁连造山带与松潘—甘孜块体下方的低速体有着几点不同.首先,从S波速度的绝对值来看,位于松潘—甘孜块体下方的低速体其速度值明显小于北祁连造山带下方的低速体.Yang等(2012)将30 km深度S波速度值小于3.4 km·s-1作为判断部分熔融的标准,发现松潘—甘孜块体及北祁连造山带中下地壳符合该标准.从本文得到的速度模型来看,在松潘—甘孜块体下方30 km深度的S波速度明显小于3.4 km·s-1,部分区域S波速度达到3.2 km·s-1左右,但是北祁连造山带下方的低速体并没有小于此速度阈值,这可能与我们采用了更高分辨率的频散资料及加入接收函数的约束信息有关.Xie等(2013)新的研究结果同样认为青藏高原只在松潘—甘孜块体北部、川滇块体北部以及羌塘块体的部分区域较可能存在部分熔融,北祁连造山带存在部分熔融的可能性较低.其次,松潘—甘孜块体下方的低速体主要集中在20~40 km深度,与此前Deng等(2015)的研究结果相吻合,而北祁连造山带下方低速体分布的深度大致在30~45 km左右,比松潘—甘孜块体下方低速体的位置更深.对于低速体分布的深部范围,Hacker等(2014)的研究认为青藏高原中下地壳从20~30 km深度开始发生部分熔融并堆积在熔融区的顶部.据此推断,松潘—甘孜块体下方的低速体更有可能对应于部分熔融的地壳.此外,两个低速体对应地块的地壳厚度也存在不同,松潘—甘孜块体的地壳厚度在50 km左右,接近于周边秦岭造山带及祁连造山带东部的地壳厚度,而北祁连造山带的地壳厚度更厚,60 km左右的地壳比周边块体显著增厚.接收函数的研究结果也表明,与松潘—甘孜块体较高的泊松比(~0.28)不同,北祁连造山带有着较低的泊松比( < 0.23)(王兴臣等, 2017).因此我们认为在松潘—甘孜块体中下地壳可能存在一定程度的部分熔融,而北祁连造山带下方中下地壳的低速体更可能与地壳的增厚及韧脆性转换带有关(Li et al., 2014a, 2017a; 潘佳铁等, 2017).
4.3 研究区上地幔速度结构联合反演获得的地幔部分速度结构表明,在松潘—甘孜块体、北祁连造山带及秦岭造山带西部有着较为明显的低速异常(图 7a,7c).其中松潘—甘孜块体及北祁连造山带地幔低速异常一直延伸到120 km,而秦岭造山带地幔部分速度结构较为复杂,秦岭造山带西部低速异常范围较小,只存在于小部分区域(图 6f),秦岭造山带东部更多地表现为弱高速异常(图 7b).研究区内最显著的高速异常出现在鄂尔多斯盆地下方,成像结果表明鄂尔多斯地幔内存在一个大范围的高速异常并一直延伸到120 km以下(图 7b).此结果与最新的远震P波成像较为一致,其结果显示到250 km左右祁连造山带及松潘—甘孜块体一直表现为P波低速异常,而鄂尔多斯盆地下方的高速异常可以延伸到300 km左右(郭慧丽等, 2017).与鄂尔多斯盆地整体呈现高速异常不同,河套盆地只在80 km以上的地幔部分有着高速异常的分布,而在80 km以下表现为低速异常.Chen等(2009)的S波接收函数研究显示在鄂尔多斯盆地及其周边区域岩石圈厚度存在明显的差异,从鄂尔多斯盆地下方的约200 km迅速减薄至河套盆地的约80 km.Huang等(2009)的面波成像也显示出类似的特征,在鄂尔多斯盆地下方岩石圈厚度约160 km,而河套盆地下方的岩石圈厚度只有80 km.杨嵩等(2013)对华北地区上地幔温度及岩石圈厚度的研究同样发现在环鄂尔多斯盆地的周边区域尤其是河套盆地及阴山地区上地幔温度明显高于其他区域,在100 km深度上已经超过了地幔绝热线温度,推测河套盆地下方的岩石圈厚度仅为约90 km.而体波成像结果表明河套盆地从100 km深度开始显示明显低速异常并向下延伸至地幔过渡带深度(He and Santosh, 2017; 郭慧丽等, 2017).这些结果与本文反演获得的速度模型显示河套盆地80 km以下表现为低速异常相一致,此深度可能代表了河套盆地下方岩石圈的厚度,与鄂尔多斯盆地下方的岩石圈厚度相比,河套盆地的岩石圈厚度明显偏薄.这可能与河套盆地所对应的古元古代构造带其强度在形成时就较鄂尔多斯盆地克拉通弱,在后期的构造事件过程中由于岩石圈的不均匀加热及应变集中易于发生改造(Chen et al., 2009; 朱日祥等, 2011).此外结合人工地震剖面、Pn波速度、重力及岩石圈电性等相关研究,我们推测河套盆地80 km深度以下的低速体可能代表了深部上涌的地幔物质及岩石圈的减薄(滕吉文等, 2010; 李志伟等, 2011; 张永谦等, 2013; 李晨晶等, 2017).与壳内速度分布特征类似,阿拉善块体下方地幔部分的速度同样显示出高、低速异常共存的分布特征.图 7a显示来自北祁连造山带的地幔低速异常向东延伸至阿拉善块体的西部,而在阿拉善块体的东部岩石圈地幔则表现为高速异常为主的分布特征(图 7a,7c).这可能表明在青藏高原东北缘的挤压作用下,阿拉善块体西部的岩石圈地幔发生了改造.
5 结论本文利用“中国地震科学台阵探测”项目二期在南北地震带北段区域所布设的676个流动数字地震台站记录到的波形数据,联合反演接收函数及面波频散资料,获得了南北地震带北段区域地壳及上地幔高分辨率的S波速度结构成像结果.
本文的研究结果显示,研究区域内地壳厚度从青藏高原东北缘向外延伸总体呈现变薄的趋势,最厚的地壳厚度出现在北祁连块体下方,厚度超过60 km.与北祁连块体相比,同为青藏高原东北缘的秦岭造山带地壳厚度明显偏小,表明该区域可能经历了强烈的伸展减薄作用.研究区域内的沉积层厚度与盆地的分布情况较为一致,在鄂尔多斯盆地、河套盆地等区域有着非常厚的沉积层分布,而阿拉善块体内部沿阿拉善经武威、张掖至酒泉一带也呈条带状分布有若干较厚的沉积层.
S波的速度结构模型显示研究区域不同块体下方的速度结构与地表构造之间存在一定的相关性.在松潘—甘孜块体、北祁连造山带及秦岭造山带西部等青藏高原东北缘区域总体表现为S波低速异常,而鄂尔多斯盆地在中下地壳以及上地幔部分有着较为显著的S波高速异常分布,表明青藏高原东北缘有着较低的力学强度.阿拉善块体在地壳和上地幔部分表现出高低速共存的分布特征,暗示阿拉善块体西部岩石圈可能受到祁连造山带等青藏高原东北缘块体的挤压作用发生了破坏和改造.
在中下地壳范围内,松潘—甘孜块体、秦岭造山带西部及北祁连造山带下方观测到S波低速异常的分布.与北祁连造山带下方的低速体相比,松潘—甘孜块体中下地壳低速体的S波速度值更小、分布深度更浅,结合相关研究我们认为松潘—甘孜块体下方低速体更有可能对应于部分熔融的地壳,而北祁连造山带的低速体可能与地壳增厚及韧脆性转换带有关.
在地幔部分,松潘—甘孜块体及北祁连造山带下方的低速异常一直延伸到120 km以下,而秦岭造山带速度结构较为复杂.鄂尔多斯盆地地幔内分布有大范围的高速异常并延伸超过120 km,而鄂尔多斯盆地北部的河套盆地地幔只在80 km以上部分有着高速异常的分布,结合此前的研究我们认为此深度对应了河套盆地岩石圈的厚度,来自深部地幔过渡带的热物质上涌造成了河套盆地岩石圈的减薄.
致谢感谢中国地震局地球物理研究所李永华研究员与潘佳铁副研究员为本研究提供了Rayleigh波频散数据.感谢两位审稿专家对本文提出的宝贵修改意见.中国地震局地球物理研究所“中国地震科学探测台阵数据中心”为本研究提供了地震波形数据(喜马拉雅地震科学台阵,2011).
Ammon C J, Randall G E, Zandt G.
1990. On the nonuniqueness of receiver function inversions. Journal of Geophysical Research:Solid Earth, 95(B10): 15303-15318.
DOI:10.1029/JB095iB10p15303 |
|
Bai D H, Unsworth M J, Meju M A, et al.
2010. Crustal deformation of the eastern Tibetan plateau revealed by magnetotelluric imaging. Nature Geoscience, 3(5): 358-362.
DOI:10.1038/ngeo830 |
|
Bao X W, Song X D, Li J T.
2015a. High-resolution lithospheric structure beneath Mainland China from ambient noise and earthquake surface-wave tomography. Earth and Planetary Science Letters, 417: 132-141.
DOI:10.1016/j.epsl.2015.02.024 |
|
Bao X W, Sun X X, Xu M J, et al.
2015b. Two crustal low-velocity channels beneath SE Tibet revealed by joint inversion of Rayleigh wave dispersion and receiver functions. Earth and Planetary Science Letters, 415: 16-24.
DOI:10.1016/j.epsl.2015.01.020 |
|
Chang L J, Ding Z F, Wang C Y.
2016. Upper mantle anisotropy beneath the northern segment of the north-south tectonic belt in China. Chinese Journal of Geophysics, 59(11): 4035-4047.
DOI:10.6038/cjg20161109 |
|
Chang L J, Ding Z F, Wang C Y, et al.
2017. Vertical coherence of deformation in lithosphere in the NE margin of the Tibetan plateau using GPS and shear-wave splitting data. Tectonophysics, 699: 93-101.
DOI:10.1016/j.tecto.2017.01.025 |
|
Chen L, Cheng C, Wei Z G.
2009. Seismic evidence for significant lateral variations in lithospheric thickness beneath the central and western North China Craton. Earth and Planetary Science Letters, 286(1-2): 171-183.
DOI:10.1016/j.epsl.2009.06.022 |
|
ChinArray-Himalaya.
2011. China Seismic Array waveform data of Himalaya Project. Institute of Geophysics, China Earthquake Administration.
DOI:10.12001/ChinArray.Data.Himalaya |
|
Clark M K, Royden L H.
2000. Topographic ooze:Building the eastern margin of Tibet by lower crustal flow. Geology, 28(8): 703-706.
DOI:10.1130/0091-7613(2000)28<703:TOBTEM>2.0.CO;2 |
|
Deng Y F, Shen W S, Xu T, et al.
2015. Crustal layering in northeastern Tibet:A case study based on joint inversion of receiver functions and surface wave dispersion. Geophysical Journal International, 203(1): 692-706.
DOI:10.1093/gji/ggv321 |
|
Guo H L, Ding Z F, Xu X M.
2017. Upper mantle structure beneath the northern South-Nouth Seismic Zone from teleseismic traveltime data. Chinese Journal of Geophysics, 60(1): 86-97.
DOI:10.6038/cjg20170108 |
|
Hacker B R, Ritzwoller M H, Xie J.
2014. Partially melted, mica-bearing crust in Central Tibet. Tectonics, 33(7): 1408-1424.
DOI:10.1002/tect.v33.7 |
|
He C S, Santosh M, Chen X H, et al.
2014. Continental dynamics in a multi-convergent regime:a receiver function study from the North-South-Trending Tectonic Zone of China. International Geology Review, 56(5): 525-536.
DOI:10.1080/00206814.2013.876901 |
|
He C S, Santosh M.
2017. Intraplate earthquakes and their link with mantle dynamics:Insights from P-wave teleseismic tomography along the northern part of the North-South Tectonic Zone in China. Comptes Rendus Geoscience, 349(3): 96-105.
DOI:10.1016/j.crte.2017.04.002 |
|
Hu S B, He L J, Wang J Y.
2000. Heat flow in the continental area of China:a new data set. Earth and Planetary Science Letters, 179(2): 407-419.
DOI:10.1016/S0012-821X(00)00126-6 |
|
Huang J L, Zhao D P.
2006. High-resolution mantle tomography of China and surrounding regions. Journal of Geophysical Research:Solid Earth, 111(B9): B09305.
DOI:10.1029/2005JB004066 |
|
Huang Z X, Li H Y, Zheng Y J, et al.
2009. The lithosphere of North China Craton from surface wave tomography. Earth and Planetary Science Letters, 288(1-2): 164-173.
DOI:10.1016/j.epsl.2009.09.019 |
|
Huang Z X, Li H Y, Xu Y.
2013. Lithospheric S-wave velocity structure of the North-South Seismic Belt of China from surface wave tomography. Chinese Journal of Geophysics, 56(4): 1121-1131.
DOI:10.6038/cjg20130408 |
|
Jiang C X, Yang Y J, Zheng Y.
2014. Penetration of mid-crustal low velocity zone across the Kunlun Fault in the NE Tibetan Plateau revealed by ambient noise tomography. Earth and Planetary Science Letters, 406: 81-92.
DOI:10.1016/j.epsl.2014.08.040 |
|
Julià J, Ammon C J, Herrmann R B, et al.
2000. Joint inversion of receiver function and surface wave dispersion observations. Geophysical Journal International, 143(1): 99-112.
DOI:10.1046/j.1365-246x.2000.00217.x |
|
Lei J S, Zhao D P.
2016. Teleseismic P-wave tomography and mantle dynamics beneath Eastern Tibet. Geochemistry, Geophysics, Geosystems, 17(5): 1861-1884.
DOI:10.1002/2016GC006262 |
|
Li C J, Bai D H, Xue S, et al.
2017. A magnetotelluric study of the deep electric structure beneath the Ordos Block. Chinese Journal of Geophysics, 60(5): 1788-1799.
DOI:10.6038/cjg20170515 |
|
Li H Y, Shen Y, Huang Z X, et al.
2014a. The distribution of the mid-to-lower crustal low-velocity zone beneath the northeastern Tibetan Plateau revealed from ambient noise tomography. Journal of Geophysical Research:Solid Earth, 119(3): 1954-1970.
DOI:10.1002/2013JB010374 |
|
Li X F, Li H Y, Shen Y, et al.
2014b. Crustal velocity structure of the Northeastern Tibetan Plateau from ambient noise surface-wave tomography and its tectonic implications. Bulletin of the Seismological Society of America, 104(3): 1045-1055.
DOI:10.1785/0120130019 |
|
Li Y H, Pan J T, Wu Q J, et al.
2017a. Lithospheric structure beneath the northeastern Tibetan Plateau and the western Sino-Korea Craton revealed by Rayleigh wave tomography. Geophysical Journal International, 210(2): 570-584.
DOI:10.1093/gji/ggx181 |
|
Li Y H, Wang X C, Zhang R Q, et al.
2017b. Crustal structure across the NE Tibetan Plateau and Ordos Block from the joint inversion of receiver functions and Rayleigh-wave dispersions. Tectonophysics, 705: 33-41.
DOI:10.1016/j.tecto.2017.03.020 |
|
Li Z W, Hao T Y, Xu Y.
2011. Uppermost mantle structure of the North China Craton:Constraints from interstation Pn travel time difference tomography. Chinese Science Bulletin, 56(16): 1691-1699.
DOI:10.1007/s11434-011-4487-y |
|
Liang C T, Song X D.
2006. A low velocity belt beneath northern and eastern Tibetan Plateau from Pn tomography. Geophysical Research Letters, 33(22): L22306.
DOI:10.1029/2006GL027926 |
|
Liang S M, Gan W J, Shen C Z, et al.
2013. Three-dimensional velocity field of present-day crustal motion of the Tibetan Plateau derived from GPS measurements. Journal of Geophysical Research:Solid Earth, 118(10): 5722-5732.
DOI:10.1002/2013JB010503 |
|
Ligorría J P, Ammon C J.
1999. Iterative deconvolution and receiver-function estimation. Bulletin of the Seismological Society of America, 89(5): 1395-1400.
|
|
Liu Q M, Zhao J M, Lu F, et al.
2014. Crustal structure of northeastern margin of the Tibetan Plateau by receiver function inversion. Science China Earth Sciences, 57(4): 741-750.
DOI:10.1007/s11430-013-4772-5 |
|
Nafe J E, Drake C L. 1963. Physical properties of marine sediments.//Hill M N ed. The Sea. New York:Interscience, 3:794-813.
|
|
Pan J T, Li Y H, Wu Q J, et al.
2017. Phase velocity maps of Rayleigh wave based on a dense coverage and portable seismic array in NE Tibetan plateau and its adjacent regions. Chinese Journal of Geophysics, 60(6): 2291-2303.
DOI:10.6038/cjg20170621 |
|
Qian Q W, Wu J, Liu G, et al.
2017. Anisotropy of middle-upper crust derived from shear-wave splitting in the northeastern Tibetan plateau and tectonic implications. Chinese Journal of Geophysics, 60(6): 2338-2349.
DOI:10.6038/cjg20170625 |
|
Royden L H, Burchfiel B C, King R W, et al.
1997. Surface deformation and lower crustal flow in eastern Tibet. Science, 276(5313): 788-790.
DOI:10.1126/science.276.5313.788 |
|
Sambridge M.
1999. Geophysical inversion with a neighbourhood algorithm-Ⅰ. Searching a parameter space. Geophysical Journal International, 138(2): 479-494.
DOI:10.1046/j.1365-246X.1999.00876.x |
|
Shen F, Royden L H, Burchfiel B C.
2001. Large-scale crustal deformation of the Tibetan Plateau. Journal of Geophysical Research:Solid Earth, 106(B4): 6793-6816.
DOI:10.1029/2000JB900389 |
|
Sun X X, Bao X W, Xu M J, et al.
2014. Crustal structure beneath SE Tibet from joint analysis of receiver functions and Rayleigh wave dispersion. Geophysical Research Letters, 41(5): 1479-1484.
DOI:10.1002/2014GL059269 |
|
Teng J W, Wang F Y, Zhao W Z, et al.
2010. Velocity structure of layered block and deep dynamic process in the lithosphere beneath the Yinshan orogenic belt and Ordos Basin. Chinese Journal of Geophysics, 53(1): 67-85.
DOI:10.3969/j.issn.0001-5733.2010.01.008 |
|
Wang C Y, Chang L J, Lü Z Y, et al.
2007. Seismic anisotropy of upper mantle in eastern Tibetan Plateau and related crust-mantle coupling pattern. Science in China Series D:Earth Sciences, 50(8): 1150-1160.
DOI:10.1007/s11430-007-0053-5 |
|
Wang C Y, Yang W C, Wu J P, et al.
2015. Study on the lithospheric structure and earthquakes in North-South Tectonic Belt. Chinese Journal of Geophysics, 58(11): 3867-3901.
DOI:10.6038/cjg20151101 |
|
Wang H Y, Gao R, Li Q S, et al.
2014. Deep seismic reflection profiling in the Songpan-west Qinling-Linxia basin of the Qinghai-Tibet plateau:data acquisition, data processing and preliminary interpretations. Chinese Journal of Geophysics, 57(5): 1451-1461.
DOI:10.6038/cjg20140510 |
|
Wang H Y, Gao R, Zeng L S, et al.
2014. Crustal structure and Moho geometry of the northeastern Tibetan plateau as revealed by SinoProbe-02 deep seismic-reflection profiling. Tectonophysics, 636: 32-39.
DOI:10.1016/j.tecto.2014.08.010 |
|
Wang W L, Wu J P, Fang L H, et al.
2017. Sedimentary and crustal thicknesses and Poisson's ratios for the NE Tibetan Plateau and its adjacent regions based on dense seismic arrays. Earth and Planetary Science Letters, 462: 76-85.
DOI:10.1016/j.epsl.2016.12.040 |
|
Wang X C, Ding Z F, Wu Y, et al.
2017. Crustal thicknesses and Poisson's ratios beneath the northern section of the north-south seismic belt and surrounding areas in China. Chinese Journal of Geophysics, 60(6): 2080-2090.
DOI:10.6038/cjg20170605 |
|
Wu Q J, Zheng X F, Pan J T, et al.
2009. Measurement of interstation phase velocity by wavelet transformation. Earthquake Science, 22(4): 425-429.
DOI:10.1007/s11589-009-0425-3 |
|
Xie J Y, Ritzwoller M H, Shen W S, et al.
2013. Crustal radial anisotropy across Eastern Tibet and the Western Yangtze Craton. Journal of Geophysical Research:Solid Earth, 118(8): 4226-4252.
DOI:10.1002/jgrb.50296 |
|
Xie Z X, Wu Q J, Zhang R Q.
2017. Crustal anisotropy beneath northeastern margin of the Tibetan Plateau and its dynamic implications. Chinese Journal of Geophysics, 60(6): 2315-2325.
DOI:10.6038/cjg20170623 |
|
Xu Z J, Song X D, Zhu L P.
2013. Crustal and uppermost mantle S velocity structure under Hi-CLIMB seismic array in central Tibetan Plateau from joint inversion of surface wave dispersion and receiver function data. Tectonophysics, 584: 209-220.
DOI:10.1016/j.tecto.2012.08.024 |
|
Yang S, Xiong X, Zheng Y, et al.
2013. Upper-mantle temperature and lithospheric thickness of North China. Chinese Journal of Geophysics, 56(11): 3855-3867.
DOI:10.6038/cjg20131127 |
|
Yang Y J, Ritzwoller M H, Zheng Y, et al.
2012. A synoptic view of the distribution and connectivity of the mid-crustal low velocity zone beneath Tibet. Journal of Geophysical Research:Solid Earth, 117(B4): B04303.
DOI:10.1029/2011JB008810 |
|
Yao Z X, Wang C Y, Zeng R S, et al.
2014. Crustal structure in western Qinling tectonic belt and its adjacent regions deduced from receiver functions. Acta Seismologica Sinica, 36(1): 1-19.
DOI:10.3969/j.issn.0253-3782.2014.01.001 |
|
Yu D X, Li Y H, Wu Q J, et al.
2014. S-wave velocity structure of the northeastern Tibetan Plateau from joint inversion of Rayleigh wave phase and group velocities. Chinese Journal of Geophysics, 57(3): 800-811.
DOI:10.6038/cjg20140310 |
|
Yuan X H, Ni J, Kind R, et al.
1997. Lithospheric and upper mantle structure of southern Tibet from a seismological passive source experiment. Journal of Geophysical Research:Solid Earth, 102(B12): 27491-27500.
DOI:10.1029/97JB02379 |
|
Zhang H S, Gao R, Tian X B, et al.
2015. Crustal Swave velocity beneath the northeastern Tibetan plateau inferred from teleseismic Pwave receiver functions. Chinese Journal of Geophysics, 58(11): 3982-3992.
DOI:10.6038/cjg20151108 |
|
Zhang Y, Gao Y.
2017. The characteristics of crustal shear-wave splitting in North-South seismic zone revealed by near field recordings of two observation periods of ChinArray. Chinese Journal of Geophysics, 60(6): 2181-2199.
DOI:10.6038/cjg20170613 |
|
Zhang Y Q, Teng J W, Wang Q S, et al.
2013. Crustal structure and the geodynamic process beneath the Hetao basin and adjacent area. Progress in Geophysics, 28(5): 2264-2272.
DOI:10.6038/pg20130508 |
|
Zhang Z J, Bai Z M, Klemperer S L, et al.
2013. Crustal structure across northeastern Tibet from wide-angle seismic profiling:constraints on the Caledonian Qilian orogeny and its reactivation. Tectonophysics, 606: 140-159.
DOI:10.1016/j.tecto.2013.02.040 |
|
Zhao L F, Xie X B, He J K, et al.
2013. Crustal flow pattern beneath the Tibetan Plateau constrained by regional Lg-wave Q tomography. Earth and Planetary Science Letters, 383: 113-122.
DOI:10.1016/j.epsl.2013.09.038 |
|
Zheng C, Ding Z F, Song X D.
2016. Joint inversion of surface wave dispersion and receiver functions for crustal and uppermost mantle structure in Southeast Tibetan Plateau. Chinese Journal of Geophysics, 59(9): 3223-3236.
DOI:10.6038/cjg20160908 |
|
Zheng D, Li H Y, Shen Y, et al.
2016. Crustal and upper mantle structure beneath the northeastern Tibetan Plateau from joint analysis of receiver functions and Rayleigh wave dispersions. Geophysical Journal International, 204(1): 583-590.
DOI:10.1093/gji/ggv469 |
|
Zhu L P, Kanamori H.
2000. Moho depth variation in southern California from teleseismic receiver functions. Journal of Geophysical Research:Solid Earth, 105(B2): 2969-2980.
DOI:10.1029/1999JB900322 |
|
Zhu R X, Chen L, Wu F X, et al.
2011. Timing, scale and mechanism of the destruction of the North China Craton. Science China Earth Sciences, 54(6): 789-797.
DOI:10.1007/s11430-011-4203-4 |
|
Zong S J, Wu J P, Fang L H, et al.
2017. Surface wave eikonal tomography in and around the northeastern margin of the Tibetan plateau. Chinese Journal of Geophysics, 60(6): 2304-2314.
DOI:10.6038/cjg20170622 |
|
常利军, 丁志峰, 王椿镛.
2016. 南北构造带北段上地幔各向异性特征. 地球物理学报, 59(11): 4035–4047.
DOI:10.6038/cjg20161109 |
|
郭慧丽, 丁志峰, 徐小明.
2017. 南北地震带北段的远震P波层析成像研究. 地球物理学报, 60(1): 86–97.
DOI:10.6038/cjg20170108 |
|
黄忠贤, 李红谊, 胥颐.
2013. 南北地震带岩石圈S波速度结构面波层析成像. 地球物理学报, 56(4): 1121–1131.
DOI:10.6038/cjg20130408 |
|
李晨晶, 白登海, 薛帅, 等.
2017. 鄂尔多斯地块深部岩石圈电性结构研究. 地球物理学报, 60(5): 1788–1799.
DOI:10.6038/cjg20170515 |
|
李志伟, 郝天珧, 徐亚.
2011. 华北克拉通上地幔顶部构造特征:来自台站间Pn波到时差成像的约束. 科学通报, 56(12): 962–974.
|
|
刘启民, 赵俊猛, 卢芳, 等.
2014. 用接收函数方法反演青藏高原东北缘地壳结构. 中国科学:地球科学, 44(4): 668–679.
|
|
潘佳铁, 李永华, 吴庆举, 等.
2017. 基于密集流动地震台阵的青藏高原东北缘及邻区Rayleigh波相速度层析成像. 地球物理学报, 60(6): 2291–2303.
DOI:10.6038/cjg20170621 |
|
钱旗伟, 吴晶, 刘庚, 等.
2017. 青藏高原东北缘中上地壳介质各向异性及其构造意义. 地球物理学报, 60(6): 2338–2349.
DOI:10.6038/cjg20170625 |
|
滕吉文, 王夫运, 赵文智, 等.
2010. 阴山造山带-鄂尔多斯盆地岩石圈层、块速度结构与深层动力过程. 地球物理学报, 53(1): 67–85.
DOI:10.3969/j.issn.0001-5733.2010.01.008 |
|
王椿镛, 常利军, 吕智勇, 等.
2007. 青藏高原东部上地幔各向异性及相关的壳幔耦合型式. 中国科学:地球科学, 37(4): 495–503.
|
|
王椿镛, 杨文采, 吴建平, 等.
2015. 南北构造带岩石圈结构与地震的研究. 地球物理学报, 58(11): 3867–3901.
DOI:10.6038/cjg20151101 |
|
王海燕, 高锐, 李秋生, 等.
2014. 青藏高原松潘-西秦岭-临夏盆地深地震反射剖面——采集、处理与初步解释. 地球物理学报, 57(5): 1451–1461.
DOI:10.6038/cjg20140510 |
|
王兴臣, 丁志峰, 武岩, 等.
2017. 中国南北地震带北段及其周缘地壳厚度与泊松比研究. 地球物理学报, 60(6): 2080–2090.
DOI:10.6038/cjg20170605 |
|
喜马拉雅地震科学台阵.
2011. 中国地震科学探测台阵波形数据——喜马拉雅计划. 中国地震局地球物理研究所.
DOI:10.12001/ChinArray.Data.Himalaya |
|
谢振新, 吴庆举, 张瑞青.
2017. 青藏高原东北缘地壳各向异性及其动力学意义. 地球物理学报, 60(6): 2315–2325.
DOI:10.6038/cjg20170623 |
|
杨嵩, 熊熊, 郑勇, 等.
2013. 华北地区上地幔温度及岩石圈厚度分布研究. 地球物理学报, 56(11): 3855–3867.
DOI:10.6038/cjg20131127 |
|
姚志祥, 王椿镛, 曾融生, 等.
2014. 利用接收函数方法研究西秦岭构造带及其邻区地壳结构. 地震学报, 36(1): 1–19.
DOI:10.3969/j.issn.0253-3782.2014.01.001 |
|
余大新, 李永华, 吴庆举, 等.
2014. 利用Rayleigh波相速度和群速度联合反演青藏高原东北缘S波速度结构. 地球物理学报, 57(3): 800–811.
DOI:10.6038/cjg20140310 |
|
张洪双, 高锐, 田小波, 等.
2015. 青藏高原东北缘地壳S波速度结构及其动力学含义——远震接收函数提供的证据. 地球物理学报, 58(11): 3982–3992.
DOI:10.6038/cjg20151108 |
|
张艺, 高原.
2017. 中国地震科学台阵两期观测资料近场记录揭示的南北地震带地壳剪切波分裂特征. 地球物理学报, 60(6): 2181–2199.
DOI:10.6038/cjg20170613 |
|
张永谦, 滕吉文, 王谦身, 等.
2013. 河套盆地及其邻近地域的地壳结构与深层动力学过程. 地球物理学进展, 28(5): 2264–2272.
DOI:10.6038/pg20130508 |
|
郑晨, 丁志峰, 宋晓东.
2016. 利用面波频散与接收函数联合反演青藏高原东南缘地壳上地幔速度结构. 地球物理学报, 59(9): 3223–3236.
DOI:10.6038/cjg20160908 |
|
钟世军, 吴建平, 房立华, 等.
2017. 青藏高原东北缘及周边地区基于程函方程的面波层析成像. 地球物理学报, 60(6): 2304–2314.
DOI:10.6038/cjg20170622 |
|
朱日祥, 陈凌, 吴福元, 等.
2011. 华北克拉通破坏的时间、范围与机制. 中国科学:地球科学, 41(5): 583–592.
|
|