 2018, Vol. 61


2. 中国科学院地球科学研究院, 北京 100029;
3. 中国科学院大学, 北京 100049
2. Institutions of Earth Science, Chinese Academy of Sciences, Beijing 100029, China;
3. University of Chinese Academy of Sciences, Beijing 100049, China
水压致裂是页岩气等非常规油气资源开采过程中的关键环节,微地震监测是对水力压裂效果定量评估的重要手段(Maxwell and Urbancic, 2001).微震监测研究主要包含两部分:震源定位和发震机制,其中定位能够提供裂缝的位置和分布信息(Batchelor et al., 1983; Warpinski et al., 1997, 1998),而对震源机制的研究,则能帮助我们获得压裂区域的发育特点、破裂尺度和储层地应力分布状态等参数(Dahm et al., 1999; Nolen-Hoeksema and Ruff, 2001; Baig and Urbancic, 2010),为计算有效压裂体积和油藏的开发建模提供可靠依据(Maxwell et al., 2010).
以往研究认为,微地震信号主要由剪切位错产生(Warpinski, 1997; Philips et al., 1998),因此可参考天然地震,通过P波初至极性、纵横波振幅比和波形相关系数等约束来求解微震震源机制(Hardebeck, 2002; Rutledge and Philips, 2003; Li et al., 2011; Tibi et al., 2013; 杨心超等, 2015; Zhang and Zhang, 2016; Kuang et al., 2016).近年来越来越多的研究证实了水压致裂时有非剪切破裂的存在(Šílený et al., 2009; Warpinski and Du, 2010; Baig and Urbancic, 2010; Song and Toksöz, 2011; Song et al., 2014; Zhao et al., 2014),为了最大程度地与实际发震机制相吻合,矩张量模型开始被广泛使用.Song和Toksöz(2011)发展了一种利用全波形信息求解微震矩张量震源机制的方法,并对井中观测方位角局限问题进行了讨论.在此基础上,Song等(2014)着重考虑张裂错动的影响,研究了Barnnet Shale的微震震源机制并将其与矿藏地质特点联系在一起.朱海波等(2014)通过奇异值分解方法,求解了我国西南地区微地震数据的矩张量形式震源机制.翟鸿宇等(2016)在反演微震震源矩张量时着重考虑了地层的吸收衰减作用,并对其影响进行分析讨论.
由正演模型反演发震机制时,传统方法多在时间域进行.Cesca等(2006, 2010, 2011)发展了一种频率域利用振幅谱信息快速反演矩张量的方法.相比于时间域,频率域处理高频信号更加稳定,对震相信息依赖较弱,针对震级较小、能量较弱的地震事件效果较好(Dahm et al., 2000; Ji et al., 2002; Cseca et al., 2006; Šílený and Milev, 2008; 郝金来和姚振兴, 2012a).Julià等(2009)利用均匀模型,在频率域对高频波形记录求解了震源机制.Sen等(2013)利用Cesca的方法研究了德国某煤矿诱发微地震事件群(ML-1.7~2.0)的矩张量震源机制.
矩张量模型无需对震源做任何假设,符合微震实际发震机制,反演求解时使用全波形信息对结果进行约束,是一种有效手段.然而,该方法并不能直观地给出发震区各方向的破裂尺度信息,为了能够直接、定量得到破裂区的错动信息,本文在前人研究的基础上,使用“剪切+张裂”一般位错模型来描述微震触发机制,并由此发展了一种频率域求解微震震源机制的方法.该方法借鉴天然地震研究的全波形匹配思想(Dreger and Helmberger, 1991; Zhao and Helmberger, 1994),利用理论地震图和实际观测记录在波形振幅谱、P波初至极性的最佳拟合来进行约束,反演过程在频率域进行并使用模拟退火方法.使用本方法分别对地面、井中两种观测方式的理论合成数据和实际观测记录进行了处理试算,并对结果进行分析和讨论.
1 方法原理 1.1 正演理论“剪切+张裂”一般位错模型除沿断层面的剪切滑动外,还考虑了垂直于断层面的张裂错动(压缩或拉张),如图 1所示.

|
图 1 “剪切+张裂”一般位错模型图示 图中θs、δ和λ分别为断层的走向、倾角和滑动角,Δu为沿断层平面的剪切错距,Δu3为垂直于断层平面的张裂错距. Fig. 1 "Shear & Tensile" general dislocation model θs, δ and λ are fault′s strike, dip and rake angles respectively. Δu is shear dislocation and Δu3 is tensile dislocation. |
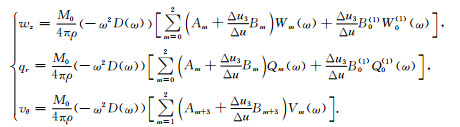
合成理论图采用广义反射透射系数矩阵方法(Yao and Harkider, 1983),根据先前研究成果(Yao and Harkider, 1983; 谢小碧和姚振兴, 1989; He et al., 2003; 郝金来和姚振兴, 2012b),剪切和张裂位错模型在计算理论地震图时可部分合并,最终三分量位移(垂向wz,径向qr,切向vθ)的频率域表达式为
|
(1) |
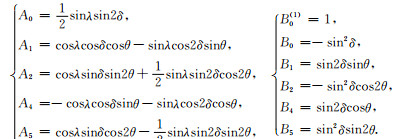
其中ρ为震源处介质密度,M0=μΣΔu为标量地震矩,μ为剪切模量,Σ为断层面积,Δu为剪切错距,Δu3为张裂错距(拉张为正,压缩为负),D(ω)为震源时间函数谱(本文采用雷克子波).Am和Bm、B0(1)分别为剪切和张裂位错的方向性因子:
|
(2) |
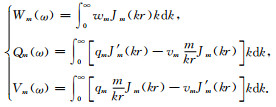
此处θ=Az-θs为台站方位Az相对于断层走向θs的角度,δ、λ分别为断层的倾角、滑动角.Wm(ω)、Qm(ω)和Vm(ω)为剪切、张裂位错模型共用的垂向、径向和切向格林函数,分别对应m=0,45°倾滑(45°DS);m=1,倾滑(DS);m=2,走滑(SS)等三个基本断层的贡献,具体为
|
(3) |
而W0(1)(ω)和Q0(1)(ω)则为张裂位错引入的额外格林函数,计算方法同Wm(ω)、Qm(ω),但需替换为张裂位错的震源系数P0(1)和SV0(1),(3)中qm、wm和vm为面谐矢量坐标系下的位移分量,接收点位于地表(地面观测)和地下(井中观测)时表达式不同(He et al., 2003; 郝金来和姚振兴, 2012b).
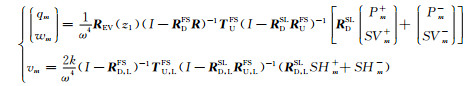
对于图 2所示水平层状模型,接收点位于地表时,有
|
(4) |

|
图 2 水平层状模型 五角星表示震源位置(zS层),zL+和zL-表示zL层之下和之上. Fig. 2 Layered model geometry The star indicates the source, zL+ and zL- are the points below and above interface zL. |
式中REV(z1)和R为P-SV波在自由表面的接收函数矩阵和反射系数矩阵,RDFS和TUFS为(z1+, zS+)间向下传播的广义反射系数矩阵和向上传播的广义透射系数矩阵,RD, LFS、TU, LFS则对应SH波情形(下同),RUFS和RDSL为(z1, zS-)间向上传播和(zS+, zL+)间向下传播的广义反射系数矩阵.
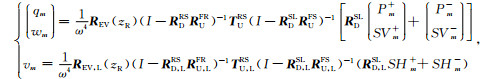
接收点位于地下时,分在震源之上、之下两种情形:接收点位于震源之上(zR < zS)时,有
|
(5) |
其中REV(zR)为此时的P-SV波接收函数矩阵,REV, L(zR)为相应SH波接收函数,RDRS和TURS为(zR+, zS+)间向下传播的广义反射系数矩阵和向上传播的广义透射系数矩阵,RUFR为(z1, zR-)间向上传播的广义反射系数矩阵.
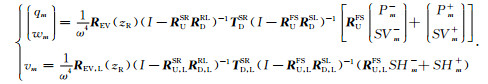
接收点位于震源之下(zR>zS)时,有
|
(6) |
其中REV(zR)为此时的P-SV波接收函数矩阵,REV, L(zR)为相应SH波接收函数,RUSR和TDSR为(zS+, zR+)间向上传播的广义反射系数矩阵和向下传播的广义透射系数矩阵,RDRL为(zR+, zL+)间向下传播的广义反射系数矩阵.
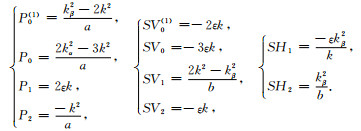
(4)、(5)和(6)式中震源系数均一致,具体为
|
(7) |
此处Pm、SVm和SHm分别对应Pm+、Pm-、SVm+、SVm-和SHm+、SHm-,角标为“+”时ε为1,为“-”时ε为-1,kα、kβ和a、b分别为P、S波的波数和垂直波数.
(1)-(7)式建立了“剪切+张裂”一般位错模型的正演理论,描述震源的参数为:标量地震矩M0、断层走向θs、倾角δ、滑动角λ、张裂错距与剪切错距之比Δu3/Δu(简称“错距比”)和雷克子波主频F(简称“主频”)等6个.
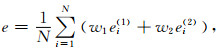
1.2 反演方法考虑到微震信号往往频率较高,滤波时若频带范围选取不当,反而会破坏有效信号,故本方法在处理时不对数据进行滤波.参考天然地震中利用波形数据的反演方法(姚振兴等, 1991)及频率域求解震源机制的相应处理(Cesca et al., 2006),采用如下形式目标函数:
|
(8) |
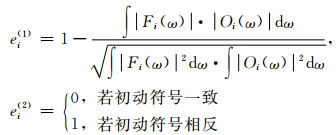
式中N为台站个数,w1、w2为权重,ei(1)、ei(2)为第i个台站某分量的误差函数:
|
(9) |
其中Oi(ω)和Fi(ω)分别为第i个地震台站观测数据和理论合成记录的频谱,ei(1)为用振幅谱相关系数表示的误差函数,强调形状拟合,而对绝对大小不敏感,ei(2)表示P波初至极性约束.频率域振幅谱相关系数和时间域波形相关系数相比,对震相的时间信息不敏感,减少了对初至拾取的依赖,处理低信噪比事件时较为有利.通过(8)、(9)式建立的目标函数同时适用于单分量和多分量数据,且不含绝对振幅信息,这样反演震源机制时可先不求解标量地震矩,从而减少待反演参数至5个(断层走向θs、倾角δ、滑动角λ、错距比Δu3/Δu和主频F).
具体求解采用模拟退火反演方法.模拟退火法(Kirkpatrick et al., 1983; Szu and Hantly, 1987; 张霖斌等, 1997; 姚振兴和纪晨, 1997)是一种全局搜索反演方法,通过模拟热力学系统随温度降低而落入能量最低这一过程求得最优解,该方法对目标函数的搜索虽然随机,但要求每次迭代时目标函数落在解空间的位置满足一定概率分布,从而使得搜索效率显著提高,因此被广泛应用于地球物理问题的求解之中,并取得了较好效果(姚振兴和纪晨, 1997; Wang et al., 2004; 郝金来和姚振兴, 2012a).
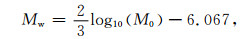
1.3 确定破裂参数得出微震震源机制后可进一步确定破裂参数:标量地震矩M0用每个台站观测资料的最大振幅与理论地震图最大振幅之比的平均值来确定(姚振兴等, 1991),由M0可求出矩震级Mw(Kanamori, 1977):
|
(10) |
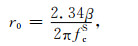
考虑微震震级较小,采用圆盘震源模型(Brune, 1970, 1971),计算震源半径r0时,若实际记录的S波能量显著,则(Brune, 1970, 1971):
|
(11) |
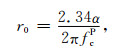
其中fcS为S波振幅谱的拐角频率(由实际资料得到),β为震源处的S波速度;若信号只含P波或P波能量显著,则(Hanks and Wyss, 1972):
|
(12) |
式中fcP为P波振幅谱的拐角频率(由实际资料得到),α为震源处的P波速度.将M0和r0代入M0=μπr02Δu可求出剪切错距Δu,再由错距比Δu3/Δu得到张裂错距Δu3,应力降Δσ表示断层面应力水平变化的平均值,由下式给出(Madariaga, 1976):
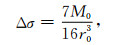
|
(13) |
微震释放的能量可用下式计算(Udías et al., 2014):
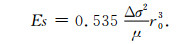
|
(14) |
实际微地震监测通常采用地面和井中两种观测方式.地表观测时方位覆盖好、监测范围大,但数据信噪比低;井中观测能获得质量较好信号,并记录到大量震级较小事件,但易受监测井数目限制(通常为单井)导致对事件方位和震源机制的约束较差(Hardebeck and Shearer, 2003; Vavryčuk, 2007).
为适应实际监测需要,对两种观测方式都进行数值检验,具体为:对各个观测台站,正演得到理论波形,然后加入最大振幅10%的高斯白噪声来模拟“实际记录”,再进行反演求解.地面观测时,采用图 3a的速度模型,设定了8个震中距0.2~0.9 km、方位角0°~360°均匀分布的观测台站,震源位于地下3200 m.井中测试时,采用图 3b的速度模型,设定单一监测井,下放11级检波器,间隔10 m,深度1665~1765 m,震源位置则有两种:位于台阵序列的一侧(深度1800 m)和中间(深度1700 m),单井震中距40 m,方位角0°.

|
图 3 (a) 地面观测数值测试和实际数据处理所用速度模型;(b)井中观测数值测试和实际数据处理所用速度模型,虚线为S波速度,实线为P波速度 Fig. 3 (a) Velocity model used for surface synthetic test and real data processing; (b) Velocity model used for borehole synthetic test and real data processing, the dash line is S wave and the solid line is P wave |
震源机制反演时,同一台阵对不同断层滑动角的分辨能力不同,因此在数值测试时,设定断层走向47°、倾角63°、错距比0.5和子波主频(地面观测50 Hz,井中观测300 Hz)不变,滑动角则在-180°~180°之间均匀变化(间隔约45°,共9组取值).使用本方法对加入10%噪音的地面、井中理论数据分别进行了处理,反演结果中,子波主频偏差不超过8 Hz,角度、错距比相对于理论值的偏差情况具体详见图 4.从图 4可看出,无论滑动角取何值,反演所得震源机制解与理论值均较为一致(角度偏差不超过9°,错距比偏差0.1以内).数值测试结果表明,对于不同的观测系统(地面、井中)和不同类型震源,本方法均可得到较准确的反演结果,从而验证了方法的有效性和可行性.

|
图 4 (a)-(c)为数值测试的角度误差曲线,(a)地面观测;(b)井中观测震源位于台阵一侧(单侧)情形;(c)井中观测震源位于台阵之间(中间)情形,横轴对应滑动角不同的9组震源机制(其余震源参数均相同),纵轴为反演角度与理论角度之差,红色为滑动角,黑色为断层走向,蓝色为倾角.(d)为三种情形的错距比误差曲线,横轴同上,纵轴为反演错距比与理论错距比之差,红色为地面观测;黑色为井中单侧情形,蓝色为井中中间情形 Fig. 4 (a)-(c) are the degree-error curves, the horizontal axis indicates nine focal mechanisms whose rake angles are different, the vertical axis indicates the difference between test result and real value, the red, black and blue lines are rake, strike and dip angles respectively. (a) surface test; (b) and (c) are two cases when the sources are located on one side of and among the array in borehole network. (d) is the ratio-error curves, the vertical axis is the difference between test result and real value, the red, black and blue lines indicate cases when the sources are on the surface, on one side of and among the stations array in borehole network |
选取我国某地区地面微震数据进行应用试算,目的层埋深约4000 m,上部为页岩,下部为灰岩,地面观测系统共12条测线,1771道数据,道间距20 m,最小偏移距143 m,最大偏移距4593 m,数据包含三个较大微震事件,均为只含P波震相的垂向记录,具体观测系统分布和事件位置如图 5所示,所用速度模型由声波测井数据得到,同图 3a.

|
图 5 实际地面观测系统及三次微震事件位置分布.图中数字序号1-12为台阵序列,小图给出了三次微震事件的具体位置 Fig. 5 Map of the surface network and three microseismic events, numbers from 1 to 12 are the stations, the epicenters are clearly plotted in the figure aside |
使用本文方法求得了三次微震事件的震源机制(详见表 1),这里示例给出事件3各台站频率域振幅谱、时间域波形的拟合结果(图 6).不难看出,理论波形和实际记录相似度较高,仅个别台站受噪音影响稍有不同,初动方向也基本一致,表明结果的准确性.对于微震事件,Fisher和Warpinski(2012)根据大量实际观测资料,得出了压裂裂缝倾角与地层埋深的统计关系,认为当埋深超过1 km时,由于上覆地层压力影响,基本表现为高角度裂缝.从反演结果可看出,三次事件倾角均在80°以上,与上述研究结论一致,相应断层节面走向(37°/307°、38°/308°、39°/129°)大致相同,且均为走滑断层(滑动角0°、-5°、-7°),总体结果体现了三次破裂所在断层的空间一致性.

|
图 6 地面观测No.3微震事件垂向P波的频率域振幅谱(左)、时间域波形(右)拟合结果及震源机制解.其中灰色和黑色为实际观测资料的振幅谱和时间域波形,红色为理论合成记录,左侧的台站序号与图 5中测线序号相对应,左上方和左下方分别为所选台站的震中距和方位角 Fig. 6 Amplitude spectra(left), waveform(right) fitting results and focal mechanism solution of No.3 event from surface network, the red lines are the synthetic seismogram, the grey area and black lines are the amplitude spectra and waveform of observed record, respectively, the numbers are the same as shown in Fig.5, the epicentral distance and azimuth are also plotted |
|
|
表 1 地面观测三次微震事件震源机制解 Table 1 Focal mechanism solutions of three microseismic events from surface network |
利用震源机制解进一步求得了各事件的震源参数(详见表 2),三次微震的标量地震矩在3.65~3.97×10¹⁰N·m之间,矩震级均为1级左右,圆盘模型震源半径由(12)式求得,范围12.9~14.0 m,剪切错距3.57~4.33 mm,张裂错距1.09~1.46 mm,应力降5.82~7.72 MPa,释放能量2.2~3.0×10⁶J,同样说明三次微震事件的破裂情况相近.
|
|
表 2 地面观测三次微震事件震源破裂参数 Table 2 Source parameters of three events from surface network |
实际测试选用了我国某地区井中微震观测数据,速度模型由测井曲线得到,详见图 3b,本次为单井观测,下放12级三分量检波器,经过射孔校正,各检波器具体坐标均已知,深度间隔30 m左右,检波器序列上下EW(东西)方向差别45 m,NS(南北)方向差别87 m,而监测井和压裂段距离约300 m,故监测井的倾斜为定位和震源机制反演提供了一定的方位角约束,各台站水平指向已经过校正,EW、NS、Z三分量记录真实、准确.
采用本文方法进行了求解,选取结果中一组信噪比高、时空分布连续的微震事件群(15个)进行分析,事件1三分量P、S波振幅谱和波形拟合结果详见图 7.从波形拟合结果看到,大部分台站记录的初至和波形都高度相似,仅个别未十分吻合,证明结果准确可靠.分析15个微震事件的位置分布和震源机制结果(图 8)及破裂参数(表 3)可知,该微震震群大部分事件(11个)均由走滑型断层激发,标量地震矩7.9×10⁴~3.8×10⁶N·m,矩震级-2.8~-1.6,圆盘模型震源半径由(11)式求得,普遍在2 m左右,剪切错距(Δu)和张裂错距(Δu3)在微米量级,且张裂相较于剪切并不微弱,拉张(Δu3为正)和压缩(Δu3为负)的情形都存在,应力降2.4~84 kPa,释放能量0.01~12.0J.与地表数据结果比较发现,井中观测记录的微震事件信噪比更高、数量更多,且由于距离近、衰减弱,高频成分显著(井中177 Hz,地面30 Hz).比较井中各微震事件的破裂参数可看出,剪切、张裂错距和应力降、释放能量之间并不严格相关,而应力降和能量是常规微震震源分析技术(矩张量反演方法)评估压裂效果的重要参数,说明剪切、张裂错距可作为独立的、新的物理量来辅助描述破裂情况,且更加直观,实际评估水压致裂效果时,应综合考虑尽可能多的参数,确保得到准确、可靠结果.
|
|
表 3 井中微震事件震源参数 Table 3 Source parameters of borehole events |

|
图 7 井中观测事件No.1的频率域振幅谱、时间域波形拟合结果和震源机制解 (a)频率域振幅谱拟合结果,灰色表示实际记录的振幅谱,红色表示理论波形的振幅谱,从左到右依次为Z、NS、EW三分量,左侧为井中检波器序号,台站1-12的深度由浅至深,具体位置见图 8;(b)变换到时间域的波形拟合结果,黑色为实际记录,红色为理论波形. Fig. 7 Amplitude spectra, waveform fitting results and focal mechanism solution of Event No.1 from borehole network (a) Amplitude spectra fitting, the grey areas are the amplitude spectra of real data, the red lines are the amplitude spectra of synthetic seismogram, from left to right are the Vertical, NS, and EW components respectively. Borehole receiver index is listed on the left and locations are shown in Fig.8; (b) Waveform fitting, the black lines indicate real data and the red lines indicate synthetic seismogram. |

|
图 8 井中观测15个微震事件发震位置、震源机制分布情况 (a)东西-南北水平剖面; (b)东西-深度垂直切片,其中三角表示检波器,从上至下对应图 7中1-12. Fig. 8 Locations and focal mechanisms of the 15 microseismic events from borehole network (a) EW-NS view; (b) Side view of EW-Depth. The triangles from up to down are the borehole stations from 1 to 12 in Fig.7. |
本文使用“剪切+张裂”一般位错点源模型来描述微震震源,与剪切位错模型相比,额外考虑了垂直于断层面的张裂错动,更符合实际发震机制;与矩张量模型相比,能够定量得到破裂断层各方向的错动尺度.反演求解时利用全波形信息并在频率域进行,以确保结果准确、可靠.理论数值测试证明方法稳定、可行,实际数据处理结果则表明:在未进行滤波降噪处理的情况下,针对地面和井中两种观测方式,本方法均能得到较吻合波形拟合结果,对比求得的剪切、张裂错距和应力降、释放能量的数值发现,二者并不严格相关,说明错动距离可作为独立的新参数辅助了解压裂区域的破裂情况,从而更深入、准确地评估水压致裂效果,因此本文方法在实际微地震监测中具有良好的应用前景.
致谢谨此祝贺姚振兴先生从事地球物理教学科研工作60周年.感谢中国石油东方地球物理公司、中国石油长庆油田公司提供了本次数据处理所用的微地震实际观测资料,感谢常旭研究员、张金海研究员、郝金来副研究员和赵旭博士后与作者的有益讨论和建议,感谢审稿专家提出的宝贵意见.
Baig A, Urbancic T.
2010. Microseismic moment tensors:A path to understanding frac growth. The Leading Edge, 29(3): 320-324.
DOI:10.1190/1.3353729 |
|
Batchelor A S, Baria R, Hearn K. 1983. Monitoring the effects of hydraulic stimulation by microseismic event location: a case study. //53th Ann. Internat Mtg., Soc. Expi. Geophys. . Expanded Abstracts.
|
|
Brune J N.
1970. Tectonic stress and spectra of shear waves from earthquakes. Journal of Geophysical Research:Atmospheres, 75(26): 4997-5009.
DOI:10.1029/JB075i026p04997 |
|
Brune J N.
1971. Correction. Journal of Geophysical Research Atmospheres, 76(20): 5002.
DOI:10.1029/JB076i020p05002 |
|
Cesca S, Buforn E, Dahm T.
2006. Amplitude spectra moment tensor inversion of shallow earthquakes in Spain. Geophysical Journal International, 166(2): 839-854.
DOI:10.1111/gji.2006.166.issue-2 |
|
Cesca S, Heimann S, Stammler K, et al.
2010. Automated procedure for point and kinematic source inversion at regional distances. Journal of Geophysical Research:Solid Earth, 115(B6): B06304.
DOI:10.1029/2009JB006450 |
|
Cesca S, Heimann S, Dahm T.
2011. Rapid directivity detection by azimuthal amplitude spectra inversion. Journal of Seismology, 15(1): 147-164.
DOI:10.1007/s10950-010-9217-4 |
|
Dahm T, Manthei G, Eisenblätter J.
1999. Automated moment tensor inversion to estimate source mechanisms of hydraulically induced micro-seismicity in salt rock. Tectonophysics, 306(1): 1-17.
DOI:10.1016/S0040-1951(99)00041-4 |
|
Dahm T, Horálek J, Šílený J.
2000. Comparison of absolute and relative moment tensor solutions for the January 1997 West Bohemia earthquake swarm. Studia Geophysica et Geodaetica, 44(2): 233-250.
DOI:10.1023/A:1022166926987 |
|
Dreger D, Helmberger D.
1991. Source parameters of the Sierra Madre Earthquake from regional and local body waves. Geophysical Research Letters, 18(11): 2015-2018.
DOI:10.1029/91GL02366 |
|
Fisher M K, Warpinski N R.
2012. Hydraulic fracture height growth:real data. Spe Production & Operations, 27(1): 8-19.
|
|
Hanks T C, Wyss M.
1972. The use of body-wave spectra in the determination of seismic-source parameters. Bulletin of the Seismological Society of America, 62(2): 561-589.
|
|
Hao J L, Yao Z X.
2012a. Determination of regional earthquake source parameters in wavelet domain. Science China Earth Sciences, 55(2): 296-305.
DOI:10.1007/s11430-011-4341-8 |
|
Hao J L, Yao Z X.
2012b. The coseismic displacement, strain and stress in the layered elastic model. Chinese J. Geophys. (in Chinese), 55(5): 1682-1694.
DOI:10.6038/j.issn.0001-5733.2012.05.025 |
|
Hardebeck J L.
2002. A new method for determining first-motion focal mechanisms. Bulletin of the Seismological Society of America, 92(6): 2264-2276.
DOI:10.1785/0120010200 |
|
Hardebeck J L, Shearer P M.
2003. Using S/P amplitude ratios to constrain the focal mechanisms of small earthquakes. Bulletin of the Seismological Society of America, 93(6): 2434-2444.
DOI:10.1785/0120020236 |
|
He Y M, Wang W M, Yao Z X. 2003. Static deformation due to shear and tensile faults in a layered half-space. Bulletin of the Seismological Society of America, 93(5): 2253-2263.
https://www.researchgate.net/publication/282781956_Static_deformation_due_to_shear_and_tensile_faults_in_a_layered_half-space |
|
Ji C, Wald D J, Helmberger D V.
2002. Source description of the 1999 Hector Mine, California, Earthquake, Part Ⅰ:wavelet domain inversion Theory and Resolution Analysis. Bulletin of the Seismological Society of America, 92(4): 1192-1207.
DOI:10.1785/0120000916 |
|
Julià J, Nyblade A A, Durrheim R, et al.
2009. Source mechanisms of mine-related seismicity, Savuka mine, South Africa. Bulletin of the Seismological Society of America, 99(5): 2801-2814.
DOI:10.1785/0120080334 |
|
Kanamori H.
1977. The energy release in great earthquakes. Journal of Geophysical Research, 82(20): 2981-2987.
DOI:10.1029/JB082i020p02981 |
|
Kirkpatrick S, Gelatt C D Jr, Vecchi M P. 1983. Optimization by simulated annealing. Science, 220(4598): 671-680.
http://science.sciencemag.org/content/220/4598/671 |
|
Kuang W H, Zoback M, Zhang J.
2016. Estimating geomechanical parameters from microseismic plane focal mechanisms recorded during multistage hydraulic fracturing. Geophysics, 82(1): KS1-KS11.
|
|
Li J L, Zhang H J, Kuleli H S, et al.
2011. Focal mechanism determination using high frequency waveform matching and its application to small magnitude induced earthquakes. Geophysical Journal International, 184(3): 1261-1274.
DOI:10.1111/gji.2011.184.issue-3 |
|
Madariaga R.
1976. Dynamics of an expanding circular fault. Bulletin of the Seismological Society of America, 66(3): 639-666.
|
|
Maxwell S C, Urbancic T I.
2001. The role of passive microseismic monitoring in the instrumented oil field. The Leading Edge, 20(6): 636-639.
DOI:10.1190/1.1439012 |
|
Maxwell S C, Rutledge J, Jones R, et al.
2010. Petroleum reservoir characterization using downhole microseismic monitoring. Geophysics, 75(5): 75A129-75A137.
DOI:10.1190/1.3477966 |
|
Nolen-Hoeksema R C, Ruff L J.
2001. Moment tensor inversion of microseisms from the B-sand propped hydrofracture, M-site, Colorado. Tectonophysics, 336(1-4): 163-181.
DOI:10.1016/S0040-1951(01)00100-7 |
|
Phillips W S, Fairbanks T D, Rutledge J T, et al.
1998. Induced microearthquake patterns and oil-producing fracture systems in the Austin chalk. Tectonophysics, 289(1-3): 153-169.
DOI:10.1016/S0040-1951(97)00313-2 |
|
Rutledge J T, Phillips W S.
2003. Hydraulic stimulation of natural fractures as revealed by induced microearthquakes, Carthage Cotton Valley gas field, east Texas. Geophysics, 68(2): 441-452.
DOI:10.1190/1.1567214 |
|
Šílený J, Milev A.
2008. Source mechanism of mining induced seismic events-resolution of double couple and non double couple models. Tectonophysics, 456(1): 3-15.
|
|
ŠílenýJ, HillD P, EisnerL, 等.
2009. Non double couple mechanisms of microearthquakes induced by hydraulic fracturing. Journal of Geophysical Research:Solid Earth, 114(B8): B08307.
DOI:10.1029/2008JB005987 |
|
Sen A T, Cesca S, Bischoff M, et al.
2013. Automated full moment tensor inversion of coal mining-induced seismicity. Geophysical Journal International, 195(2): 1267-1281.
DOI:10.1093/gji/ggt300 |
|
Song F, Toksöz M N.
2011. Full-waveform based complete moment tensor inversion and source parameter estimation from downhole microseismic data for hydrofracture monitoring. Geophysics, 76(6): WC103-WC116.
DOI:10.1190/geo2011-0027.1 |
|
Song F X, Warpinski N R, Toksöz M N.
2014. Full-waveform based microseismic source mechanism studies in the Barnett Shale:linking microseismicity to reservoir geomechanics. Geophysics, 79(2): KS109-KS126.
DOI:10.1190/geo2013-0259.1 |
|
Szu H, Hartley R.
1987. Fast simulated annealing. Physics Letters A, 122(3-4): 157-162.
DOI:10.1016/0375-9601(87)90796-1 |
|
Tibi R, Vermilye J, Lacazette A, et al. 2013. Assessment of hydraulic fracture complexity and stress field variability in an unconventional reservoir from composite moment tensor of double-Couple microseismic events. //73th Ann. Internat Mtg., Soc. Expi. Geophys. . Expanded Abstracts.
|
|
Udías A, Madariaga R, Buforn E. 2014.
Source Mechanisms of Earthquakes:Theory and Practice. Cambridge: Cambridge University Press: 203-204.
|
|
Vavryčuk V.
2007. On the retrieval of moment tensors from borehole data. Geophysical Prospecting, 55(3): 381-391.
DOI:10.1111/gpr.2007.55.issue-3 |
|
Wang W M, He Y M, Yao Z X.
2004. Complexity of the coseismic rupture for 1999 Chi-Chi Earthquake (Taiwan) from inversion of GPS observations. Tectonophysics, 382(3-4): 151-172.
DOI:10.1016/j.tecto.2004.01.005 |
|
Warpinski N R, Branagan P T, Peterson R E, et al. 1997. Microseismic and deformation imaging of hydraulic fracture growth and geometry in the C sand interval, GRI/DOE M-Site project. //67th Ann. Internat Mtg., Soc. Expi. Geophys. . Expanded Abstracts.
|
|
Warpinski N R, Branagan P T, Peterson R E, et al. 1998. Mapping hydraulic fracture growth and geometry using microseismic events detected by a wireline retrievable accelerometer array. //68th Ann. Internat Mtg., Soc. Expi. Geophys. . Expanded Abstracts.
|
|
Warpinski N R, Du J. 2010. Source-mechanism studies on microseismicity induced by hydraulic fracturing. //90th Ann. Internat Mtg., Soc. Expi. Geophys. . Expanded Abstracts.
|
|
Xie X B, Yao Z X.
1989. A generalized reflection-transmition coefficient matrix method to calculate static displacement field of a stratified half-space by dislocation source. Acta Geophysica Sinica, 32(3): 270-280.
|
|
Yang X C, Zhu H B, Cui S G, et al.
2015. Application of P-wave first-motion focal mechanism solutions in microseismic monitoring for hydraulic fracturing. Geophysical Prospecting for Petroleum, 54(1): 43-50.
|
|
Yao Z X, Harkrider D G.
1983. A generalized reflection-transmission coefficient matrix and discrete wavenumber method for synthetic seismograms. Bulletin of the Seismological Society of America, 73(6A): 1685-1699.
|
|
Yao Z X, Zheng T Y, Cao B R, et al.
1991. The method of determining middle and strong earthquake's process using P waveform data. Progress in Geophysics, 6(4): 6-36.
|
|
Yao Z X, Ji C.
1997. The inverse problem of finite fault study in time domain. Acta Geophysica Sinica, 40(5): 691-701.
|
|
Zhai H Y, Chang X, Wang Y B, et al.
2016. Inversion for microseismic focal mechanisms in attenuated strata and its resolution. Chinese Journal of Geophysics, 59(8): 3025-3036.
DOI:10.6038/cjg20160825 |
|
Zhang L B, Yao Z X, Ji C, et al.
1997. Fast simulated annealing algorithm and its application. Oil Geophysical Prospecting, 32(5): 654-660.
|
|
Zhang X, Zhang J.
2016. Microseismic search engine for real-time estimation of source location and focal mechanism. Geophysics, 81(5): KS169-KS182.
DOI:10.1190/geo2015-0695.1 |
|
Zhao L S, Helmberger D V.
1994. Source estimation from broadband regional seismograms. Bulletin of the Seismological Society of America, 84(1): 91-104.
|
|
Zhao P, Kühn D, Oye V, et al.
2014. Evidence for tensile faulting deduced from full waveform moment tensor inversion during the stimulation of the Basel enhanced geothermal system. Geothermics, 52: 74-83.
DOI:10.1016/j.geothermics.2014.01.003 |
|
Zhu H B, Yang X C, Wang Y, et al.
2014. The application of microseismic source mechanism inversion in hydraulic fracturing monitoring. Geophysical Prospecting for Petroleum, 53(5): 556-561.
|
|
郝金来, 姚振兴.
2012a. 小波域反演确定区域地震震源机制. 中国科学:地球科学, 42(2): 191–201.
|
|
郝金来, 姚振兴.
2012b. 均匀弹性分层介质模型中的同震位移、应变以及应力. 地球物理学报, 55(5): 1682–1694.
DOI:10.6038/j.issn.0001-5733.2012.05.025 |
|
谢小碧, 姚振兴.
1989. 计算分层介质中位错点源静态位移场的广义反射、透射系数矩阵和离散波数方法. 地球物理学报, 32(03): 270–280.
DOI:10.3321/j.issn:0001-5733.1989.03.004 |
|
杨心超, 朱海波, 崔树果, 等.
2015. P波初动震源机制解在水力压裂微地震监测中的应用. 石油物探, 54(1): 43–50.
|
|
姚振兴, 郑天愉, 曹柏如, 等.
1991. 用P波波形资料测定中强地震震源过程的方法. 地球物理学进展, 6(4): 6–36.
|
|
姚振兴, 纪晨.
1997. 时间域内有限地震断层的反演问题. 地球物理学报, 40(5): 691–701.
|
|
翟鸿宇, 常旭, 王一博, 等.
2016. 含衰减地层微地震震源机制反演及其反演分辨率. 地球物理学报, 59(8): 3025–3036.
DOI:10.6038/cjg20160825 |
|
张霖斌, 姚振兴, 纪晨, 等.
1997. 快速模拟退火算法及应用. 石油地球物理勘探, 32(5): 654–660.
|
|
朱海波, 杨心超, 王瑜, 等.
2014. 水力压裂微地震监测的震源机制反演方法应用研究. 石油物探, 53(5): 556–561.
|
|