 2018, Vol. 61


2. 中国科学院地球科学研究院, 北京 100029;
3. 青岛海洋科学与技术国家实验室, 海洋矿产资源评价与探测技术功能实验室, 山东青岛 266061;
4. 中国科学院大学, 北京 100049;
5. 日本东北大学地球物理系, 仙台 980-8578
2. Institutions of Earth Science, Chinese Academy of Sciences, Beijing 100029, China;
3. Laboratory for Marine Mineral Resources, Qingdao National Laboratory of Marine Science and Technology, Shandong Qingdao 266061, China;
4. University of Chinese Academy of Sciences, Beijing 100049, China;
5. Department of Geophysics, Tohoku University, Sendai 980-8578, Japan
板块构造理论是现代地球科学最重要的理论之一,它是在大陆漂移学说和海底扩张学说的基础上发展起来的.根据板块构造理论,大洋板块在洋中脊形成并发生扩张,最终通过俯冲作用消亡.因此俯冲带是地球内部物质循环的重要组成部分,研究俯冲带对了解地球内部运行机制具有重要的科学意义.太平洋板块是年龄最老的板块之一,约为130 Ma, 在东北日本以平均约9 cm·a-1的速度从东向西俯冲到Okhotsk板块下方,直接导致该地区成为地震和火山活动多发地区(图 1).如今,日本地区的地震台站分布覆盖了整个日本列岛,台站间的距离达到了20~30 km左右,是世界上地震台站分布最密集的地区.如此多的地震和台站,使得该地区成为研究俯冲带结构的最佳天然场所.

|
图 1 成像区域及构造背景 黑色虚线框为本文研究区域,红虚线标示出俯冲太平洋板块上界面的深度位置分布.红蓝三角分别表示活火山和第四纪火山. Fig. 1 Map showing the major tectonic features of the study region The black dashed box shows the present study area, and red dashed lines denote the depth contours of the upper boundary of the subducting Pacific slab. Red and blue triangles denote the active and Quaternary volcanoes, respectively. |
俯冲过程中的水迁移改变了地球内部介质的物理化学性质,与地震和火山作用密切相关(Green et al., 2010; Hacker et al., 2003; Zheng et al., 2016).水在地球内部的存在形式主要是流体中的水分子、含水矿物中的结构羟基和名义无水矿物中氢的点缺陷(Unsworth and Rondenay, 2013; Zheng et al., 2016).水的存在改变了地球内部岩石的地震波速、泊松比及波速衰减等,因此通过地震层析成像方法得到速度结构是研究地球内部现今流体分布的重要手段之一(Hasegawa et al., 2013; Kamiya and Kobayashi, 2000; Liu and Zhao, 2016; Zhao et al., 2015).同时,水的存在也显著地改变了地球内部介质的各向异性结构(Karato et al., 2008; Mainprice and Ildefonse, 2009),因此地震各向异性也可以用来探测地球内部构造变形及水循环(Wang et al., 2017a).尽管众多学者利用剪切波分裂研究了日本俯冲带的各向异性结构(如, Huang et al., 2011; Long and Van Der Hilst, 2005; Nakajima and Hasegawa, 2004),然而,由于受其数据分布和方法的限制,其得到的各向异性结构的垂向分辨率存在不足,很难分辨出地球内部各圈层的各向异性结构的明确信息(Savage, 1999).
近年来,随着地震学方法的改进以及大量地震数据的积累,P波各向异性层析成像方法得到了较大发展(Eberhart-Phillips and Henderson, 2004; Ishise and Oda, 2008; Koulakov et al., 2009; Liu and Zhao, 2016; Wang and Zhao, 2008, 2013; Zhao et al., 2016), 它能够同时探测地球内部的速度和各向异性的三维结构.在本文中,我们将利用区域地震到时数据,使用地震层析成像方法,得到东北日本俯冲带上地幔(深至约150 km)的P波速度(VP)、S波速度(VS)、VP/VS和P波各向异性结构,将它们联合起来约束并探讨俯冲带中水的存在形式及其对地球物理观测的影响.
1 数据和方法本研究采用了研究区域内381个台站(图 2a)记录的7, 642个近震事件(图 2b)的268, 702个P波和217, 630个S波初至到时数据.该数据来自日本东北大学、Hi-net数字台网和日本气象厅(JMA).这些地震选择时遵循了以下原则:(1)所选地震发生在台网内,震源定位的深度误差小于5 km;(2)每个地震至少被10个台站观测到;(3)将研究区域划分为众多0.1°×0.1°×2 km的小格子,在每个小格子中选择具有最多条到时数据的地震事件,使得所选地震尽量分布在研究区内.

|
图 2 层析成像中所用的台站(a)和地震(b)分布 黑三角表示本研究中所用的台阵,彩圈表示地震分布,彩圈色标表示地震深度分布区间. Fig. 2 Distributions of the seismic stations (a) and local earthquakes (b) used in this study The black triangles denote the seismic stations, and the color circles denote the local earthquakes. The focal depths are shown in colors whose scale is shown in (b). |
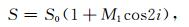
对于各向同性速度反演,本研究采用层析成像方法TOMOG3D(Zhao et al., 1992);对于各向异性结构研究则采用了在TOMOG3D基础上发展的P波方位及径向各向异性层析成像方法(Wang and Zhao, 2008, 2013).如图 3,假设地球内部物质是六角对称介质(transverse isotropy, TI), 当假设其对称轴水平分布时(horizontal transverse isotropy, HTI,图 3a),其主要反映的是方位各向异性特征,能提供地球内部介质在水平面上的变形或流动方向;当假设其对称轴垂直分布时(vertical transverse isotropy, VTI,图 3b), 其主要反映的是径向各向异性,能提供地球介质是以水平运动或以垂向运动为主的重要信息.对TI弱各向异性介质,P波慢度可以表示为(Barclay et al., 1998):

|
图 3 射线路径与(a)方位各向异性和(b)径向各向异性介质模型对称轴分布示意图 虚箭头表示射线,ϕ和i分别是射线方位角和入射角,粗实线表示介质对称轴,其方位角是φ,θ为射线传播方向与介质对称轴的夹角. Fig. 3 The coordinate system specifying a ray path and the symmetry axis for azimuthal anisotropy (a) and radial anisotropy (b) V is the propagation vector of a ray with incident angle i and azimuthal angle ϕ.θ is the angle between the propagation vector and the symmetry axis. The thick solid line denotes the hexagonal symmetry axis for azimuthal anisotropy with azimuthal angle φ (a) and radial anisotropy (b). |
|
(1) |
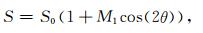
式中S是总慢度,S0是平均慢度(即各向同性部分),M1是各向异性参数,θ为射线传播方向与介质对称轴的夹角.对于反演介质的方位各向异性,假设对称轴水平分布(图 3a),我们可以得到(Eberhart-Phillips and Henderson, 2004):

|
(2) |
式中的ϕ和i分别是射线方位角和入射角.因此将式(2)代入,式(1)可写成

|
(3) |
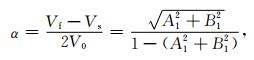
式中的A1和B1则是表示方位各向异性的两个参数.对式(3)的ϕ求极值ψ得到最小慢度(即最大速度),快速方向方位角ψ和方位各向异性幅度α则表示为(Eberhart-Phillips and Henderson, 2004; Wang and Zhao, 2013):

|
|
(4) |
式中V0是各向同性速度,Vf和Vs分别是快速和慢速.
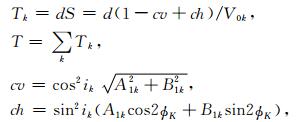
由式(3),我们可以得到长度为d的第k段射线的走时Tk,
|
(5) |
式中T是该射线总的走时,V0k是第k条射线段中点处的各向同性速度,A1k和B1k是第k条射线段中点处的方位各向异性参数,ik和ϕk则分别是第k条射线段的入射角和方位角.因此,我们可以得到走时对各向同性速度及各向异性参数的偏导:

|
(6) |
式中的参数V0k, A1k和B1k都是球坐标(φ, λ, h)的函数f(φ, λ, h),其值可以用其周围的8个格点值线性插值得到:

|
(7) |
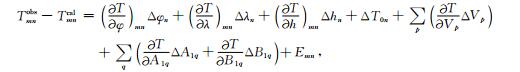
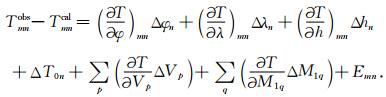
式中的φi, λj和hk表示在点(φ, λ, h)周围8个格点的坐标.因此,在第m个台站观测到的第n个近震事件的走时方程可以表示为:
|
(8) |
式中的Tmnobs和Tmncal分别是观测和计算的走时,φn, λn, hn和T0n分别是第n个地震事件的余纬、经度、深度和发生时刻,Δ表示参数的扰动; 反演中可设立两套三维网格分别对应各向同性速度和各向异性参数,这两套网格可相同也可不同; Vp表示第一套网格第p格点上的各向同性速度,A1q和B1q表示第二套网格第q格点上的各向异性参数,Emn表示扰动的高阶项和数据的误差.式(8)中右边前4项代表了震源参数的贡献.对震源参数的偏导可以表示为(Engdahl and Lee, 1976):

|
(9) |
式中Ve是震源处的速度,ϕ和i分别是射线方位角和入射角,φ, λ, h分别是地震事件的余纬、经度和深度,R0是地球半径.
对于反演介质的径向各向异性,假设对称轴垂向分布(图 3b),式(1)可写成:
|
(10) |
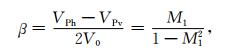
式中M1为径向各向异性参数.径向各向异性幅度β表示为
|
(11) |
式中VPh和VPv分别为P波在水平面及径向的速度,V0为各向同性速度.因此,β>0(即正径向各向异性)表示P波水平速度大于垂向速度;β < 0(即负径向各向异性)表示P波垂向速度大于水平速度.
由式(10),我们可以得到长度为d的第k段射线的走时Tk,

|
(12) |
式中T是该射线总的走时,V0k是第k条射线段中点处的各向同性速度,M1k是第k条射线段中点处的径向各向异性参数,ik是第k条射线段的入射角.因此,我们可以得到走时对各向同性速度及径向各向异性参数的偏导:

|
(13) |
类似于上述方位各向异性层析成像方法,我们可以得到在第m个台站观测到的第n个近震事件的走时方程:
|
(14) |
我们用LSQR方法(Paige and Saunders, 1982)来求解方程(8)和(14),可分别得到研究区域内的三维方位和径向各向异性结构.
类似于先前东北日本俯冲带的成像研究(Nakajima et al., 2001; Wang and Zhao, 2005, 2008; Zhao et al., 1992, 2015),我们在计算中考虑了该地区的Conrad、Moho和太平洋俯冲板块上边界的起伏(Hasegawa et al., 1978; Horiuchi et al., 1982a, 1982b; Zhao et al., 1992, 1997),这些界面的位置在反演中是固定的,且在计算中俯冲的太平洋板块厚度假设为85 km.我们采用JB模型作为反演的初始一维速度模型,如图 4所示给出了某点(五星标示)下方的初始速度,其中Hc、Hm、Hsu和Hsl分别是该点下方Conrad、Moho、太平洋俯冲板块上边界和下边界的深度,虚线表示在俯冲板块内部加了4%的高速异常.在本工作中,我们选定网格点水平间隔为0.25°,网格点深度为2, 10, 25, 40, 60, 80, 100, 120,150, 200和400 km.因为在反演中不可避免地存在着地震射线交叉密集和稀疏区域,所以在速度反演中,我们选择穿过的射线数超过10的网格节点参与反演.然而,求解各向异性参数与地震射线的方位角和入射角的分布有着密切关系,因此我们通过考虑参数MRAGA(射线方位角之间的最大夹角,图 5)(Wang et al., 2017a; Wang and Zhao, 2013)对各向异性结构反演加以约束.在本研究中,MRAGA值取为45°.

|
图 4 反演计算中的某点一维初始速度模型 黑色实线为某点(图b的五星标识处)一维速度模型,虚线表示在俯冲板块内加了4%的高速异常.大小三角分别表示活火山和第四纪火山. Fig. 4 (a) 1-D velocity model under the area shown with a star symbol in the map (b) Solid lines denote the 1-D VP and VS models, and dashed lines denote a 4% high-velocity anomaly added in the subducting Pacific slab. The big solid and small open triangles denote the active and Quaternary volcanoes, respectively. |

|
图 5 参数MRAGA卡通示意图 ∂为射线方位夹角,其最大值为MRAGA.在计算中,当穿过某网格节点的射线方位角分布类似于(a)而不是(b),该节点反演各向异性参数.在本研究中,MRAGA值取为45°. Fig. 5 The definition of the maximum ray-azimuth gap angle (MRAGA) ∂ denotes the angle between two adjacent rays; its maximum value is MRAGA. In anisotropic tomography, anisotropy can be determined reliably at a grid node when the rays pass through the node in all azimuthal directions with a pattern shown in (a) rather than that in (b). In this study, the MRAGA is set to be 45°. |
为了检测层析成像程序的正确性和分辨率,我们做了检测板测试(Wang and Zhao, 2008, 2013; Zhao et al., 1992),其计算思路是:首先给出特定的检测板三维速度模型;然后在这种模型下利用记录到的真实的震源和台站位置计算每一条射线的理论走时.为了模拟真实数据中的读取误差,对于每一条理论走时都加上均方差为0.15 s的随机误差,得到新的理论走时,并将该走时作为反演数据;最后利用理论数据和一维初始速度模型进行反演,将反演结果与给定的三维检测板模型进行比较,便可评价反演结果的好与差.本研究中,我们给定相邻格点上的各向同性速度扰动值分别为+4%和-4%(俯冲板块内初始已存在+4%的高速异常);对于方位各向异性,每个格点上A1和B1值相等,且相邻格点的值分别为0.03和-0.03;对于径向各向异性,相邻格点上的M1值分别为0.03和-0.03.
图 6和图 7给出了P波各向同性速度、S波各向同性速度、P波方位和径向各向异性反演在8个深度剖面上的检测板测试结果.结果表明,速度和各向异性结构都在地壳和上地幔(约120 km深度)得到了很好的恢复.然而随着深度的增加,俯冲太平洋板块内部结构的分辨率较差,这可能是因为该处射线交叉的程度不高所引起的.尽管反演中由于各向同性速度扰动和各向异性参数之间存在的耦合效应(Huang et al., 2015; Pratt and Chapman, 1992),导致在部分研究区域检测结果的各向同性速度扰动大小和各向异性幅度没得到很好的恢复,但是我们结果表明,各向同性速度扰动的正负分布和各向异性的快轴方向都得到了较好的恢复.

|
图 6 P波(a)和S波(b)各向同性速度反演检测板分辨率测试结果 空心和实心圆分别表示低速和高速异常,虚线表示俯冲的太平洋板块上界面在该深度的位置. Fig. 6 Results of checkerboard tests for P-wave (a) and S-wave (b) isotropic tomography Open and solid circles denote low and high velocity perturbations, respectively. The dashed lines show the upper boundary of the subducting Pacific slab at each depth. |

|
图 7 P波方位(a)和径向(b)各向异性反演检测板分辨率测试结果 空心和实心圆分别表示低速和高速异常. (a)小线段方位角表示快速方向,长度表示各向异性的幅度;(b)水平和垂直线段分别表示正、负径向各向异性,长度表示各向异性的幅度. Fig. 7 Results of checkerboard tests for P-wave azimuthal (a) and radial (b) anisotropic tomography Open and solid circles denote low and high velocity perturbations, respectively. (a) The azimuths of bars represent the fast velocity directions. (b) The horizontal and vertical bars denote positive and negative radial anisotropies, respectively. The length of bars denotes amplitude of anisotropy. |
图 8给出了三个剖面上的P波速度扰动、S波速度扰动、VP/VS异常

|
图 8 三个东西向剖面上的成像结果 (a) P波速度扰动; (b) S波速度扰动; (c) VP/VS比变化; (d)方位各向异性; (e)径向各向异性.对(a)和(b)红和蓝色分别表示低速和高速异常,对(c)红和蓝色分别表示高和低VP/VS比异常,对(d)红色表示快波方向东西向,而蓝色表示快速方向南北向,对(e)红和蓝色分布表示负和正径向各向异性;(d)中的线段表示方位各向异性,水平表示快速方向为东西向而垂直表示南北向,线段长度为方位各向异性幅度.两条黑长线分别表示Moho界面和俯冲太平洋板块上界面位置, 红蓝三角分别表示距离剖面约10 km以内的活火山和第四纪火山,白圈表示距离剖面约10 km以内2002—2007年之间的地震,红圈表示距离剖面约10 km以内的低频地震. Fig. 8 Inversion results at three east-west vertical cross-sections (a) P-wave velocity perturbations; (b) S-wave velocity perturbations; (c) VP/VS ratio anomalies; (d) azimuthal anisotropy and (e) radial anisotropy. In (a) and (b), red and blue colors denote low and high velocity perturbations, respectively; In (c), red and blue colors denote high and low VP/VS ratio anomalies, respectively; In (d), the colors denote the azimuths of fast velocity directions; thus the blue and red colors denote trench-parallel and trench-normal azimuthal anisotropies, respectively. The azimuth and length of the black bars represent the fast velocity direction and amplitude of the azimuthal anisotropy, respectively; In (e), red and blue colors denote negative and positive radial anisotropies, respectively. Black curves denote the Moho discontinuity and the upper boundary of the subducting Pacific slab at each cross-section, respectively. Red and blue triangles denote the active and Quaternary volcanoes, respectively, within a 10 km width of each cross-section. The white dots denote the seismicity during a period of 2002—2007 that occurred within a 10 km width of each cross-section. The red dots denote the low-frequency microearthquakes that occurred within a 10 km width of each cross-section. |

|
图 9 东北日本俯冲带水迁移卡通示意图 Fig. 9 Schematic vertical cross-section depicting water migration in the Tohoku subduction zone |
太平洋板块在开始俯冲时由于弯曲应力的影响,会在海沟外缘隆起形成正断层,水能沿着断层进入到海洋板块岩石圈地幔(Peacock, 2001; Ranero et al., 2003).因此,俯冲的太平洋板块将水从地表输送到地球内部,其输送形式主要是以下两种:沉积物和洋壳中的自由水;洋壳和岩石圈地幔中的含水矿物(Hacker, 2003; Unsworth and Rondenay, 2013).自由水在约10~20 km的浅部由于压力的增大和孔隙的垮塌被排出,而俯冲板块的含水矿物和名义上无水矿物则可能将水带到地幔深部(Hacker, 2003; Zheng et al., 2016).日本学者(Hasegawa et al., 1978; Umino and Hasegawa, 1975)首次发现了俯冲太平洋板块内的双重地震带,目前主流观点认为是含水矿物发生相变释放出的水导致了俯冲板块内双重地震带的发生(Green and Houston, 1995; Kirby, 1995).
我们反演的结果揭示俯冲太平洋板块为高速异常且在俯冲板块上层地震带表现为高VP/VS(见图 8c中40.0°和39.0°纬度的剖面)和低VP/VS(见图 8c中38.5°纬度的剖面),但在俯冲板块内部及下层地震带主要表现为低VP/VS.Tsuji等(2008)利用双差分层析成像也揭示了类似的特征:东北日本俯冲太平洋板块顶部存在约10 km厚的高VP/VS层,他们认为这是含水丰富的俯冲洋壳,并且到70~90 km深度处脱水反应强烈.Green等(2010)归纳他们的俯冲带模型时认为俯冲板块的双重地震带都应该表现为高VP/VS.然而,本研究和其他成像结果(Tsuji et al., 2008; Wang and Zhao, 2005)都没有在俯冲板块内揭示统一的高VP/VS双重地震带.这可能与成像反演中的数据分布、网格设定、分辨率有关系,也可能与俯冲板块内含水矿物量的多少密切相关.尽管高温高压矿物实验和热动力学模拟等能够推测俯冲板块里的含水矿物类型及其含水能力(Abers et al., 2017; Hacker, 2008; Hirschmann, 2006),但含水矿物量的多少目前仍无定论.
Abers等(2017)利用热力学模型模拟表明在冷俯冲带由于温度低,俯冲板块中的含水矿物能稳定到一定的深度才会大量脱水变质,导致弧前地幔楔含水量少.含水矿物(如绿泥石、蛇纹石、角闪石等)表现出强烈的各向异性,其各向异性幅度比橄榄石的大得多(Mainprice and Ildefonse, 2009).然而,区域中深地震剪切波分裂观测得到的东北日本俯冲带S波快慢偏振延迟时间仅为0.1~0.2 s(Huang et al., 2011; Nakajima and Hasegawa, 2004),该结果表明东北日本下方太平洋俯冲板块双重地震带区域及地幔楔里的含水矿物量有可能非常少,其各向异性主要还是由于橄榄石的晶格优势排列所引起的.因为太平洋俯冲板块双重地震带区域是含水矿物脱水及往地幔楔输送水的通道,所以其内部的名义无水矿物橄榄石含水可能丰富且处于低温和高压状态,使得橄榄石晶格发生了从A型到B型的变化,导致俯冲板块内形成了与海沟平行的方位快速方向(图 8d)和正的径向各向异性结构(图 8e)(Liu and Zhao, 2016; Wang et al., 2017a; Wang and Zhao, 2013).
水从俯冲板块进入地幔楔中,在俯冲板块上覆的地幔楔薄层温度相对较低且富水,因此有些学者认为该薄层的地幔橄榄岩会蚀变形成蛇纹石(Hyndman and Peacock, 2003; Katayama et al., 2009).然而,如上文所述的剪切波分裂观测(S波快慢偏振延迟时间小)不支持在东北日本俯冲带地幔楔内存在着蛇纹石的薄层.因此,我们认为俯冲太平洋板块上覆地幔楔薄层内与海沟平行的方位快速方向(图 8d)和正的径向各向异性结构(图 8e)也可能是由于B型橄榄石的晶格优势排列所引起的,该结论符合高温高压实验(Jung and Karato, 2001; Karato et al., 2008)和数值模拟结果(Kneller et al., 2005).自由水继续上行,带动地幔物质上涌,使得地幔楔内表现为负的径向各向异性(P波水平速度 < 垂向速度),在地幔楔的热对流部分,水通过降低熔点触发地幔橄榄岩的部分熔融,在火山链下方的上地幔顶部(约50 km深度)及下地壳形成岩浆房(低速和高VP/VS).低频地震(图 8中的红圈)主要分布在岩浆房区域的内部和周边,其和岩浆活动有关(Hasegawa and Yamamoto, 1994),可能是由于少量自由水从部分熔融区域往外迁移所引起,该自由水向上迁移进入到火山下方上地壳的裂隙和孔隙储层里,从而降低了波速.VP/VS值会随着含水裂隙和孔隙的纵横比变化,因此它在火山下方上地壳中可能增大也可能减小(Hyndman and Klemperer, 1989; Hyndman and Shearer, 1989).
利用大地电磁探测研究俯冲带的电阻率或电导率结构,也是研究俯冲带流体分布的有效手段之一(Ichiki et al., 2009; McGary et al., 2014; Ogawa et al., 2014),但现有研究对含水矿物导电机制的理解仍不清楚(Guo, 2016).高电导率出现在火山下方的地壳、弧下及弧后地幔楔内,而俯冲板块则整体表现为低电导率(Ichiki et al., 2009; McGary et al., 2014).Hu等(2017)结合实验岩石学和俯冲带热力学模型,推测在俯冲带地幔楔深部70~120 km处的高导异常可能主要是由俯冲板块含水矿物脱水所释放的流体(或水)而不是由部分熔融所引起的.俯冲带的流体分布也会加强地震波的衰减,东北日本俯冲带的衰减成像也揭示了火山下方地壳和地幔楔的高衰减及俯冲太平洋板块的低衰减结构(Liu et al., 2014; Tsumura et al., 2000; Wang et al., 2017b).本研究得到的日本俯冲带地壳及地幔楔中的速度异常和VP/VS分布和前人得到的电导率和地震波衰减结构存在一致性,清晰地揭示俯冲带中地幔楔和地壳中水分布的现今图像.
4 结论水的存在强烈影响着地球内部的动力学过程.本研究利用区域地震走时数据对东北日本俯冲带进行了VP、VS、VP/VS和P波各向异性结构成像,将它们联合在一起探讨水在俯冲带中的存在形式和迁移过程,结论及推论总结如下:
(1) 俯冲的太平洋板块双重地震带区域内主要表现为与海沟平行的方位快速方向和正的径向各向异性(P波水平速度>垂向速度),并结合剪切波分裂得到的小的S波快慢偏振延迟时间(0.1~0.2 s),我们推测该双重地震带中的水是富集在名义无水矿物(橄榄石)中和少量含水矿物中;
(2) 太平洋板块俯冲到一定深度(约70 km)后含水矿物大量脱水,水进入地幔楔中,由于低温的俯冲板块影响,俯冲板块上覆的薄层地幔楔会形成富水的B型橄榄石,使得该处表现为与海沟平行的方位快速方向和正的径向各向异性(P波水平速度>垂向速度);
(3) 自由水在地幔楔里向上迁移,在地幔楔的热对流部分,降低了地幔橄榄岩的熔点,在地幔楔顶部及中下地壳形成岩浆房,其主要表现为低速、高VP/VS和负的径向各向异性;
(4) 少量自由水会从部分熔融区往外迁移,并诱发了低频地震,该自由水储存在火山下方中上地壳的裂隙和孔隙里,形成低速和高或低VP/VS.
地震波速度成像、地震波衰减成像和大地电磁探测对俯冲带的地幔楔及地壳中的现今水分布提供了清晰的地球物理图像.然而,鉴于现有数据不足及方法的局限性,现有地球物理观测还不能够清晰地识别俯冲板块中的含水矿物分布及其量的多少.在今后的工作中,增加数据、改进地球物理方法并结合高温高压矿物实验,提高俯冲板块内部地球物理观测分辨率,能够进一步促进人们对俯冲带水迁移的认识.
致谢谨此祝贺姚振兴先生从事地球物理教学科研工作60周年.感谢日本东北大学、Hi-net和日本气象厅(JMA)提供的高质量地震走时数据,感谢主编和审稿专家提出的宝贵修改意见.文中大部分图用GMT 4.5.3 (Wessel and Smith, 1998)生成.
Barclay A H, Toomey D R, Solomon S C.
1998. Seismic structure and crustal magmatism at the Mid-Atlantic Ridge, 35 degrees N. Journal of Geophysical Research:Solid Earth, 103(B8): 17827-17844.
DOI:10.1029/98JB01275 |
|
Eberhart-Phillips D, Henderson C M.
2004. Including anisotropy in 3-D velocity inversion and application to Marlborough, New Zealand. Geophysical Journal International, 156(2): 237-254.
DOI:10.1111/gji.2004.156.issue-2 |
|
Engdahl E R, Lee W H K.
1976. Relocation of local earthquakes by seismic ray tracing. Journal of Geophysical Research, 81: 4400-4406.
DOI:10.1029/JB081i023p04400 |
|
Green H W, Houston H.
1995. The mechanics of deep earthquakes. Annual Review of Earth and Planetary Sciences, 23(1): 169-213.
DOI:10.1146/annurev.ea.23.050195.001125 |
|
Green H W, Chen W P, Brudzinski M R.
2010. Seismic evidence of negligible water carried below 400-km depth in subducting lithosphere. Nature, 467(7317): 828-831.
DOI:10.1038/nature09401 |
|
Guo X Z.
2016. Experimental study of the electrical conductivity of the hydrous minerals in the crust and the mantle under high pressure and high temperature. Science China Earth Sciences, 59(4): 696-706.
DOI:10.1007/s11430-015-5249-5 |
|
Hacker B R, Peacock S M, Abers G A, et al.
2003. ubduction factory 2. Are intermediate-depth earthquakes in subducting slabs linked to metamorphic dehydration reactions?. Journal of Geophysical Research:Solid Earth, 108(B1): 2030.
DOI:10.1029/2001JB001129 |
|
Hacker B R, Abers G A, Peacock S M.
2003. Subduction factory 1. Theoretical mineralogy, densities, seismic wave speeds, and H 2 O content. Journal of Geophysical Research:Solid Earth, 108(B1): 2029.
DOI:10.1029/2001JB001127 |
|
Hacker B R.
2008. H2O subduction beyond arcs. Geochemistry, Geophysics, Geosystems, 9(3): Q03001.
DOI:10.1029/2007GC001707 |
|
Hasegawa A, Umino N, Takagi A.
1978. Double-planed deep seismic zone and upper-mantle structure in northeastern Japan arc. Geophysical Journal of the Royal Astronomical Society, 54(2): 281-296.
DOI:10.1111/j.1365-246X.1978.tb04260.x |
|
Hasegawa A, Yamamoto A.
1994. Deep, low-frequency microearthquakes in or around seismic low-velocity zones beneath active volcanoes in northeastern Japan. Tectonophysics, 233(3-4): 233-252.
DOI:10.1016/0040-1951(94)90243-7 |
|
Hasegawa A, Nakajima J, Yanada T, et al.
2013. Complex slab structure and arc magmatism beneath the Japanese Islands. Journal of Asian Earth Sciences, 78: 277-290.
DOI:10.1016/j.jseaes.2012.12.031 |
|
Hirschmann M M.
2006. Water, melting, and the deep earth H2O cycle. Annual Review of Earth and Planetary Sciences, 34(1): 629-653.
DOI:10.1146/annurev.earth.34.031405.125211 |
|
Horiuchi S, Ishii H, Takagi A.
1982a. Two-dimensional depth structure of the crust beneath the Tohoku district, the northeastern Japan arc. I. Method and Conrad-discontinuity. Journal of Physics of the Earth, 30: 47-69.
DOI:10.4294/jpe1952.30.47 |
|
Horiuchi S, Yamamoto A, Ueki S, et al.
1982b. Two-dimensional depth structure of the crust beneath the Tohoku district, the northeastern Japan arc. 2. Moho discontinuity and P-wave velocity.. Journal of Physics of the Earth, 30: 71-86.
DOI:10.4294/jpe1952.30.71 |
|
Hu H Y, Dai L D, Li H P, et al.
2017. Influence of dehydration on the electrical conductivity of epidote and implications for high-conductivity anomalies in subduction zones. Journal of Geophysical Research:Solid Earth, 122(4): 2751-2762.
DOI:10.1002/2016JB013767 |
|
Huang Z C, Zhao D P, Wang L S.
2011. Shear wave anisotropy in the crust, mantle wedge, and subducting Pacific slab under northeast Japan. Geochemistry, Geophysics, Geosystems, 12(1): Q01002.
DOI:10.1029/2010GC003343 |
|
Huang Z C, Zhao D P, Liu X.
2015. On the trade-off between seismic anisotropy and heterogeneity:Numerical simulations and application to Northeast Japan. Journal of Geophysical Research, 120(5): 3255-3277.
|
|
Hyndman R D, Shearer P M.
1989. Water in the lower continental crust:modelling magnetotelluric and seismic reflection results. Geophysical Journal International, 98(2): 343-365.
DOI:10.1111/gji.1989.98.issue-2 |
|
Hyndman R D, Klemperer S L.
1989. Lower-crustal porosity from electrical measurements and inferences about composition from seismic velocities. Geophysical Research Letters, 16(3): 255-258.
DOI:10.1029/GL016i003p00255 |
|
Hyndman R D, Peacock S M.
2003. Serpentinization of the forearc mantle. Earth and Planetary Science Letters, 212(3-4): 417-432.
DOI:10.1016/S0012-821X(03)00263-2 |
|
Ichiki M, Baba K, Toh H, et al.
2009. An overview of electrical conductivity structures of the crust and upper mantle beneath the northwestern Pacific, the Japanese Islands, and continental East Asia. Gondwana Research, 16(3-4): 545-562.
DOI:10.1016/j.gr.2009.04.007 |
|
Ishise M, Oda H.
2005. Three-dimensional structure of P-wave anisotropy beneath the Tohoku district, northeast Japan. Journal of Geophysical Research:Solid Earth, 110(B7): B07304.
DOI:10.1029/2004JB003599 |
|
Ishise M, Oda H.
2008. Subduction of the philippine sea slab in view of P-wave anisotropy. Physics of the Earth and Planetary Interiors, 166(1-2): 83-96.
DOI:10.1016/j.pepi.2007.11.003 |
|
Jung H, Karato S.
2001. Water-induced fabric transitions in olivine. Science, 293(5534): 1460-1463.
DOI:10.1126/science.1062235 |
|
Kamiya S, Kobayashi Y.
2000. Seismological evidence for the existence of serpentinized wedge mantle. Geophysical Research Letters, 27(6): 819-822.
DOI:10.1029/1999GL011080 |
|
Karato S I, Jung H, Katayama I, et al.
2008. Geodynamic significance of seismic anisotropy of the upper mantle:New insights from laboratory studies. Annual Review of Earth and Planetary Sciences, 36(1): 59-95.
DOI:10.1146/annurev.earth.36.031207.124120 |
|
Katayama I, Hirauchi H, Michibayashi K, et al.
2009. Trench-parallel anisotropy produced by serpentine deformation in the hydrated mantle wedge. Nature, 461(7267): 1114-1117.
DOI:10.1038/nature08513 |
|
Kirby S.
1995. Interslab earthquakes and phase-changes in subducting lithosphere. Reviews of Geophysics, 33(S1): 287-297.
|
|
Kneller E A, Van Keken P E, Karato S I, et al.
2005. B-type olivine fabric in the mantle wedge:Insights from high-resolution non-Newtonian subduction zone models. Earth and Planetary Science Letters, 237(3-4): 781-797.
DOI:10.1016/j.epsl.2005.06.049 |
|
Koulakov I, Jakovlev A, Luehr B G.
2009. Anisotropic structure beneath central Java from local earthquake tomography. Geochemistry, Geophysics, Geosystems, 10(2): Q02011.
DOI:10.1029/2008GC002109 |
|
Liu X, Zhao D P, Li S Z.
2014. Seismic attenuation tomography of the Northeast Japan arc:Insight into the 2011 Tohoku earthquake (Mw9.0) and subduction dynamics. Journal of Geophysical Research, 119(2): 1094-1118.
|
|
Liu X, Zhao D P.
2016. Seismic velocity azimuthal anisotropy of the Japan subduction zone:Constraints from P and S wave traveltimes. Journal of Geophysical Research:Solid Earth, 121(7): 5086-5115.
DOI:10.1002/2016JB013116 |
|
Long M D, Van Der Hilst R D.
2005. Upper mantle anisotropy beneath Japan from shear wave splitting. Physics of the Earth and Planetary Interiors, 151(3-4): 206-222.
DOI:10.1016/j.pepi.2005.03.003 |
|
Mainprice D, Ildefonse B. 2009. Seismic anisotropy of subduction zone minerals-contribution of hydrous phases. //Lallemand S, Funiciello F, eds. Subduction Zone Geodynamics. Berlin: Springer-Verlag, 63-84.
|
|
McGary R S, Evans R L, Wannamaker P E, et al.
2014. Pathway from subducting slab to surface for melt and fluids beneath Mount Rainier. Nature, 511(7509): 338-340.
DOI:10.1038/nature13493 |
|
Nakajima J, Matsuzawa T, Hasegawa A, et al.
2001. Seismic imaging of arc magma and fluids under the central part of northeastern Japan. Tectonophysics, 341(3-4): 1-17.
|
|
Nakajima J, Hasegawa A.
2004. Shear-wave polarization anisotropy and subduction-induced flow in the mantle wedge of northeastern Japan. Earth and Planetary Science Letters, 225(3-4): 365-377.
DOI:10.1016/j.epsl.2004.06.011 |
|
Ogawa Y, Ichiki M, Kanda W, et al.
2014. Three-dimensional magnetotelluric imaging of crustal fluids and seismicity around Naruko volcano, NE Japan. Earth Planets Space, 66: 158.
DOI:10.1186/s40623-014-0158-y |
|
Paige C C, Saunders M A.
1982. Lsqr:an algorithm for sparse linear-equations and sparse least-squares. Acm Transactions on Mathematical Software, 8(1): 43-71.
DOI:10.1145/355984.355989 |
|
Peacock S M.
2001. Are the lower planes of double seismic zones caused by serpentine dehydration in subducting oceanic mantle?. Geology, 29(4): 299-302.
DOI:10.1130/0091-7613(2001)029<0299:ATLPOD>2.0.CO;2 |
|
Pratt R G, Chapman C H.
1992. Traveltime tomography in anisotropic media-Ⅱ. Application. Geophysical Journal International, 109(1): 20-37.
DOI:10.1111/gji.1992.109.issue-1 |
|
Ranero C R, Morgan J P, McIntosh K, et al.
2003. Bending-related faulting and mantle serpentinization at the Middle America trench. Nature, 425(6956): 367-373.
DOI:10.1038/nature01961 |
|
Savage M K.
1999. Seismic anisotropy and mantle deformation:What have we learned from shear wave splitting?. Reviews of Geophysics, 37(1): 65-106.
DOI:10.1029/98RG02075 |
|
Tsuji Y, Nakajima J, Hasegawa A.
2008. Tomographic evidence for hydrated oceanic crust of the Pacific slab beneath northeastern Japan:Implications for water transportation in subduction zones. Geophysical Research Letters, 35(14): L14308.
DOI:10.1029/2008GL034461 |
|
Tsumura N, Matsumoto S, Horiuchi S, et al.
2000. Three-dimensional attenuation structure beneath the northeastern Japan arc estimated from spectra of small earthquakes. Tectonophysics, 319(9): 241-260.
|
|
Umino N, Hasegawa A.
1975. On the two-layered structure of deep seismic plane in northeastern Japan arc. Journal of the Seismological Society of Japan, 27(2): 125-139.
DOI:10.4294/zisin1948.28.2_125 |
|
Unsworth M, Rondenay S. 2013. Mapping the distribution of fluids in the crust and lithospheric mantle utilizing geophysical methods. //Harlov D E, Austrheim H eds. Metasomatism and the Chemical Transformation of Rock: The Role of Fluids in Terrestrial and Extraterrestrial Processes. Berlin: Springer-Verlag, 535-598.
|
|
Wang J, Zhao D P, Yao Z X.
2017a. Seismic anisotropy evidence for dehydration embrittlement triggering intermediate-depth earthquakes. Scientific Reports, 7: 2613.
DOI:10.1038/s41598-017-02563-w |
|
Wang J, Zhao D P.
2008. P-wave anisotropic tomography beneath Northeast Japan. Physics of the Earth and Planetary Interiors, 170(1-2): 115-133.
DOI:10.1016/j.pepi.2008.07.042 |
|
Wang J, Zhao D P.
2013. P-wave tomography for 3-D radial and azimuthal anisotropy of Tohoku and Kyushu subduction zones. Geophysical Journal International, 193(3): 1166-1181.
DOI:10.1093/gji/ggt086 |
|
Wang Z, Zhao D P.
2005. Seismic imaging of the entire arc of Tohoku and Hokkaido in Japan using P-wave, S-wave and sP depth-phase data. Physics of the Earth and Planetary Interiors, 152(3): 144-162.
DOI:10.1016/j.pepi.2005.06.010 |
|
Wang Z W, Zhao D P, Liu X, et al.
2017b. P and S wave attenuation tomography of the Japan subduction zone. Geochemistry, Geophysics, Geosystems, 18(4): 1688-1710.
DOI:10.1002/2017GC006800 |
|
Wessel P, Smith W H F.
1998. New, improved version of generic mapping tools released. EOS, 79(47): 579.
DOI:10.1029/98EO00426 |
|
Zhao D P, Hasegawa A, Horiuchi S.
1992. Tomographic imaging of P and S wave velocity structure beneath northeastern Japan. Journal of Geophysical Research:Solid Earth, 97(B13): 19909-19928.
DOI:10.1029/92JB00603 |
|
Zhao D P, Matsuzawa T, Hasegawa A.
1997. Morphology of the subducting slab boundary in the northeastern Japan arc. Physics of the Earth and Planetary Interiors, 102(1-2): 89-104.
DOI:10.1016/S0031-9201(96)03258-X |
|
Zhao D P, Kitagawa H, Toyokuni G.
2015. A water wall in the Tohoku forearc causing large crustal earthquakes. Geophysical Journal International, 200(1): 149-172.
DOI:10.1093/gji/ggu381 |
|
Zhao D P, Yu S, Liu X.
2016. Seismic anisotropy tomography:New insight into subduction dynamics. Gondwana Research, 33: 24-43.
DOI:10.1016/j.gr.2015.05.008 |
|
Zheng Y F, Chen R X, Xu Z, et al.
2016. The transport of water in subduction zones. Science China Earth Sciences, 59(4): 651-682.
DOI:10.1007/s11430-015-5258-4 |
|