2. 中国科学院大学地球科学学院, 北京 100049;
3. 青藏高原地球科学卓越中心, 北京 100101
2. College of Earth Science, University of Chinese Academy of Sciences, Beijing 100049, China;
3. CAS Center for Excellence in Tibetan Plateau Earth Sciences, Beijing 100101, China
研究以410-km和660-km两个全球尺度间断面(简称‘410’和‘660’)为边界的地幔转换带有助于认识地球内部尤其是上地幔温度及成分等性质.‘410’与橄榄石到瓦兹利石的相变有关,这一放热过程具有正的克拉伯龙斜率;而‘660’与林伍德石(尖晶橄榄石)到布里奇曼石和铁方镁石的相变有关(亦称后尖晶石相变),具有负的克拉伯龙斜率(Ringwood, 1975; Jackson, 1983; Ito and Takahashi, 1989).因此,当转换带温度低于周围环境时,将导致‘410’的相对抬升与‘660’的相对下沉,即地幔转换带的增厚;反之,温度增高会使地幔转换带减薄.间断面结构尤其是转换带厚度对于上地幔的温度格局具有很好的指示作用.另外,‘660’较‘410’往往在低温环境中表现得更为复杂,同时对温度也更为敏感(Vacher et al., 1998; Akaogi et al., 2002; Andrews and Deuss, 2008).接收函数(Langston, 1979)是远震体波在台站下方的介质响应,能够有效识别速度间断面,因而在研究地幔转换带结构中得到广泛的应用(Duekerand Sheehan, 1997; Kind et al., 2002; Tonegawa et al., 2005).Ai和Zheng(2003)利用接收函数的CCP叠加方法发现了中国东部下方‘660’的局部下沉与双层形态;Chen和Ai(2009)利用P波和S波接收函数揭示了华北克拉通下方地幔转换带的异常增厚与太平洋板片的俯冲紧密相关;Mulibo和Nyblade(2013)通过转换带厚度的减薄证明非洲东部存在超级地幔柱;Liu等(2015)通过接收函数研究地幔转换带结构后认为中国东北的长白山火山与太平洋俯冲滞留板片的脱水作用无关.
印度与欧亚板块在距今约50 Ma的陆陆碰撞过程造就了平均海拔超过5 km的“世界第三极”—青藏高原(Royden et al., 2008; Chatterjee et al., 2013).近年来,众多地球物理学者利用不同手段针对青藏东南缘壳幔结构开展了大量研究(Bai et al., 2010; 张乐天等, 2012;Liang et al., 2013;王夫运等,2014;吴建平等,2013;Huang et al., 2015a; Chen et al., 2010; 潘佳铁等,2015;Wu et al., 2016; Fu et al., 2017; Yao et al., 2008; Yang et al., 2012; 范莉苹等,2015;Zheng et al., 2017; Xu et al., 2008; 徐强等,2009;李永华等,2009;Sun et al., 2012; Yang et al., 2017; Liu et al., 2014; Bao et al., 2015; 郑晨等,2016;Xie et al., 2013, 2017; Li et al., 2017),但仍有不少问题存在争议.全球及区域层析成像结果在青藏东南缘上地幔和地幔转换带中发现了东倾的高速异常体,认为这与印度板块向欧亚板块下方俯冲有关(Huang and Zhao, 2006; Li et al., 2008; Lei et al., 2009, 2013; Wang et al., 2010; Koulakov et al., 2011; Wei et al., 2012; Lei and Zhao, 2016).但受限于数据和分辨率,层析成像结果很难就这一高速体的空间展布达成一致.也有接收函数的结果支持地幔对流(Zhang et al., 2010; Hu et al., 2013)或岩石圈拆沉(Singh and Kumar, 2009)造成了该区域地幔转换带结构异常,而非俯冲作用.Shen等(2008)利用接收函数方法对中国大陆的转换带结构进行了研究,表明滇西地区地幔转换带异常增厚,但由于研究尺度与数据的限制,无法反映区域内的精细结构.Zhang等(2017)利用P波接收函数对青藏东南缘进行CCP叠加成像,认为板片俯冲与岩石圈拆沉可能都对该处转换带结构异常做出了贡献.坐落在研究区内的腾冲火山是中国大陆最年轻的火山群之一,其最后一次喷发的时间是1609年(Zhu et al., 1983; 皇甫岗, 1997).腾冲下方反映出的低波速、低电阻率、低Q值、高热流等异常十分显著(Wang and Huangfu, 2004; Huang and Zhao, 2006; 胡家富等, 2008; Bai et al., 2001, 2010; 秦嘉政等,1998;姜光政等,2016; Shangguan et al., 2000).不同研究结果得到的腾冲火山起源深度从地壳(Wang et al., 2007)、上地幔(Huang and Zhao, 2006; Wei et al., 2012)、地幔转换带(Lei et al., 2009, 2013; Huang et al., 2015a)到下地幔(Huang et al., 2002)不等,至今没有明确定论.可见青藏高原东南缘的深部结构,尤其是转换带结构仍有待进一步的精细研究.
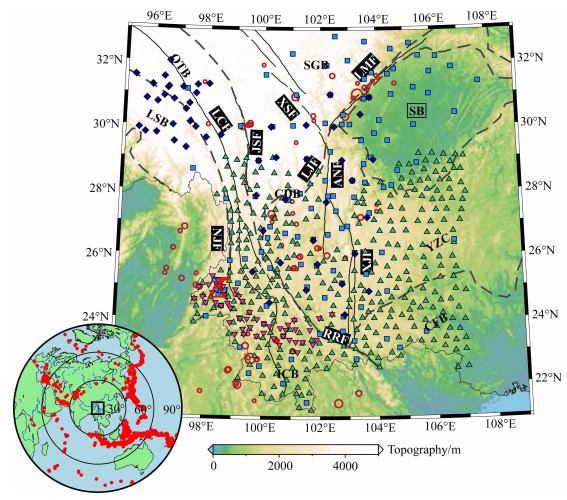
本研究区位于青藏高原东南缘,南北地震带南部,毗邻喜马拉雅东构造结(图 1).区域内地质构造复杂,地震活动频发.主要的构造单元包括中部的川滇菱形块体,以及西北的拉萨和羌塘块体、北部的松潘—甘孜块体、东部的扬子克拉通和华夏褶皱系、南部的印支块体.金沙江断裂、红河断裂、鲜水河—安宁河—小江断裂与龙门山断裂等将这些块体分隔,川滇菱形块体又进一步被小金河—丽江断裂分为南部的滇中次级块体与北部的川西北次级块体.本研究收集区域内密集分布的宽频带地震台站资料,采用最大熵谱反褶积计算接收函数,并将得到的77853条高质量接收函数进行CCP叠加,获得研究区下方地幔转换带结构,为青藏高原东南缘深部结构提供地震学约束.
|
图 1 研究区域地震台站与远震事件分布 底图表示地形.绿色三角、浅蓝方形、深蓝菱形、粉色倒三角表示的台站分别来源于“中国地震科学台阵探测”Ⅰ期、中国地震台网、IRIS和中国科学院地质与地球物理研究所;红色圆圈为1980年以来该区域5.5级以上地震震中位置;火山图案代表腾冲火山;灰色虚线和黑色实线分别表示构造边界和断裂.LSB:拉萨块体;QTB:羌塘块体;SGB:松潘—甘孜块体;YZC:扬子克拉通;SB:四川盆地;CFB:华夏褶皱系;ICB:印支块体;CDB:川滇块体;LMF:龙门山断裂;XSF:鲜水河断裂;ANF:安宁河断裂;XJF:小江断裂;JSF:金沙江断裂;RRF:红河断裂;LJF:丽江断裂;NJF:怒江断裂.远震事件位置用红点表示在左下角插图中. Fig. 1 Map showing stations and teleseismic events in the study region Background map shows topography of the study region. Green triangles, light-blue squares, dark-blue diamonds and pink inverted triangles denote seismic stations of China Array Phase Ⅰ, China Seismograph Network, Incorporated Research Institutions for Seismology and Institute of Geology and Geophysics, CAS, respectively. Red circles denote epicenters of earthquakes greater than M5.5 since 1980 in this region. Volcano symbol denotes Tengchong Volcano. Grey dashed lines and black solid lines denote main tectonic boundaries and faults, respectively. Abbreviations: LSB, Lhasa Block; QTB, Qiangtang Block; SGB, Songpan-Garzê Block; YZC, Yangtze Craton; SB, Sichuan Basin; CFB, Cathaysia Fold Belt; ICB, Indo-China Block; CDB, Chuan-Dian Block; LMF, Longmenshan Fault; XSF, Xianshuihe Fault; ANF, Anninghe Fault; XJF, Xiaojiang Fault; JSF, Jinsha Fault; RRF, Red River Fault; LJF, Lijiang Fault; NJF, Nujiang Fault. Epicenter distribution of teleseismic events used in this study is shown in the left inset. Red dots and black rectangular denote earthquakes and study area, respectively. |
本研究所使用的地震波形资料主要有四个来源(图 1),包括“中国地震科学台阵探测”(ChinArray)Ⅰ期项目于2011年3月至2013年12月期间在研究区域内密集布设的350个宽频带流动台(中国地震科学台阵,2006;Bao et al., 2015; 郑晨等,2016),中国地震台网(CSN)分布在四川、云南和西藏三地118个固定台站(郑秀芬等,2009)于2010年6月至2012年10月的观测资料,以及中国科学院地质与地球物理研究所于2002年12月至2004年8月在滇西南布设的49个宽频带流动台(胥颐等,2013),同时从IRIS(美国地震学研究联合会)数据中心下载了麻省理工学院联合成都理工大学于2003年10月至2004年9月在川滇地区布设的25个流动台站及NAMCHE BARWA TIBET和ASCENT两项目在西藏地区布设的24个流动台站数据.除了研究区西南的境外部分,566个台站很好地覆盖了整个研究区域.
从所获得的波形资料中选取了震中距在30°~90°范围内,震级大于5.5级且P波初至震相清晰的1627个远震事件用于后续接收函数的研究.如图 1左下方插图所示,多数地震来自于东侧的环太平洋地震带和西南的欧亚地震带,总体具有较好的方位角覆盖.
2 方法本研究采用时间域的最大熵谱反褶积方法计算P波接收函数(Tselentis, 1990; Wu et al., 2007).与频率域反褶积中将时窗外数据设置为零或周期性变化不同,该方法将熵极大作为时窗外数据的外推准则,从而提高了接收函数的分辨率(吴庆举等,2003).截取P波初至前20 s及其后100 s内的波形作为反褶积计算的时窗长度.为了防止反褶积过程中产生虚假信号,采用高斯系数为5(约2.5 Hz)的高斯滤波器处理截取后的波形.为了剔除高频信号的干扰,对计算出的接收函数采用了二阶零相位Butterworth滤波,频带范围在0.03~0.3 Hz.
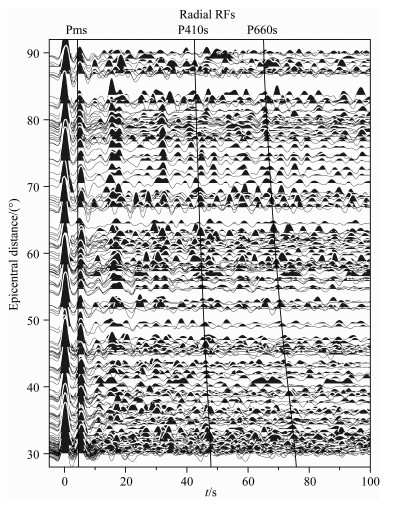
本研究从振幅和波形两方面对接收函数进行了严格地筛选,主要包括自动筛选和人为筛选两个环节.自动筛选首先针对单个接收函数剔除掉振幅极值和幅值异常大,以及P波初至极性反转或波峰严重偏离0时刻的波形;为了进一步确保转换带的成像不受极个别接收函数的影响,本研究限定P波初至后25 s至80 s内的幅值不得超过特定阈值.此外,本研究利用波形互相关约束接收函数形态,通过对某个台站的所有接收函数叠加获取一条平均接收函数,将平均接收函数与该台站的接收函数进行两两互相关,归一化得到互相关系数,对互相关系数小于某一阈值的接收函数进行剔除.自动筛选能够一定程度上减少工作量,提高效率,但筛选时的参数设置还需要人为把关,且自动筛选对转换震相一致性的判断以及部分异常波形(如:没有任何界面信息的尖脉冲)的筛查能力较弱.人为筛选前可将经过自动筛选后的接收函数按震中距或方位角排列,对于某一台站的接收函数剔除掉Moho面Ps转换震相不清晰或与震相一致性较差的波形.最终获得可靠的接收函数共计77853条.图 2所示为四川安县台筛选出的接收函数时间序列,本研究主要利用的是‘410’和‘660’处Ps转换震相.
|
图 2 四川安县台(SCAXI)筛选出的接收函数时间序列按震中距排列 三条黑色曲线为Pds震相理论走时,其中d代指间断面. Fig. 2 Receiver function time series of station SCAXI arranged by epicentral distances Three black curves represent theoretical arrival time of Pds phases, where d denotes 'discontinuity'. |
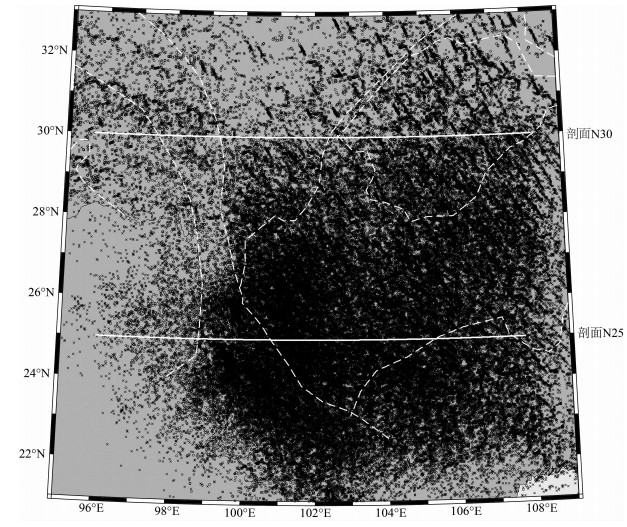
对于单条接收函数,来自地幔转换带间断面处的Ps转换震相常会被噪声压制,但通过适当的叠加或偏移手段能够大幅提高间断面Ps转换震相.Zhu(2000)对共中心点(CMP)叠加方法(Dueker and Sheehan, 1997)加以改进发展了共转换点(Common Conversion Point, CCP)叠加.该方法将地下空间进行网格剖分,并假定各网格点均产生Ps转换震相;随后根据射线参数、台站-事件坐标对并利用速度结构进行时间-深度转换,将单条接收函数反投影到射线路径所经过的各网格点;再将同一网格点,即共转换点上的接收函数振幅叠加平均,达到成像目的.本研究沿经纬线以1°的间距截取剖面,并在300~750 km的深度范围内进行成像.成像过程中,垂向和横向分辨率分别取决于地震波波长和菲涅尔带半径的大小,本研究以垂向0.5 km、径向(即剖面方向)4 km、切向(即剖面垂向)5 km设置网格大小.考虑到远震分布和数据频带对成像分辨率的影响,本研究对叠加结果在水平方向进行了平滑.对于波长为λ的地震波,其菲涅尔带半径随深度z按照(λz)1/2变化(Zhu and Kanamori, 2000),据此并结合穿透点分布(图 3)疏密程度将平滑半宽设置在120~160 km.接收函数的反投影就是时深转换的过程,因此需要确定研究区域的速度模型.考虑到青藏东南缘地壳、上地幔中存在强烈的横向结构非均匀性,仅以地壳厚度为例,不同台站最多可相差近30 km.为了准确定位转换震相的穿透点位置,本应利用三维速度模型进行接收函数时深转换.但为了简化问题并兼顾计算时长,本研究对于每个台站的接收函数,采用该台站经过壳幔校正后的一维速度结构进行射线反投影.对于单个台站,首先利用H-κ叠加(待发表)获得的地壳厚度与壳内泊松比校正其下方的壳内结构,对于未得到可靠H-κ叠加结果的台站,则采用该地区平均值.随后利用Lei等(2009)在该区域获得的三维P速度模型校正该台站下方上地幔及转换带内的P波速度结构,波速比则由IASP91模型确定.图 4—6对比展示了标准一维IASP91模型得到的CCP叠加图像与经壳幔结构校正的结果.
|
图 3 射线穿透点位置分布 圆圈和叉号分别表示410 km和660 km处的穿透点位置,白色实线表示下文中剖面N25与N30的位置. Fig. 3 Distribution of piercing points of rays Circle and cross denote piercing points at 410 km and 660 km depth, respectively. White solid lines represent profiles N25 and N30 in the following text. |
|
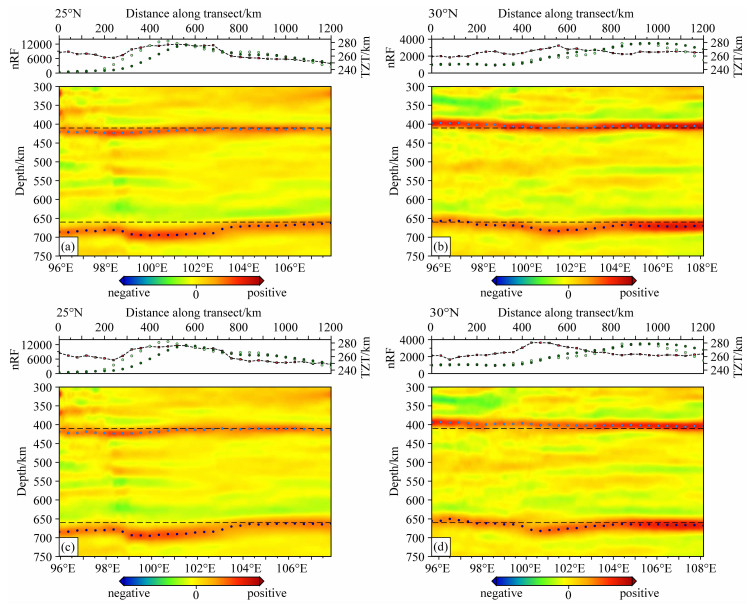
图 4 CCP叠加剖面 利用一维IASP91模型(a,b)和经壳幔结构校正的速度模型(c,d)获得的剖面N25和剖面N30.各剖面中的黑色虚线指示410 km和660 km深度,浅蓝和深蓝色圆点分别代表观测到的‘410’和‘660’界面.各剖面上方给出转换带厚度(红色点划线)以及410 km(浅绿散点)和660 km(深绿散点)处参与叠加的接收函数条数. Fig. 4 CCP stacking profiles Profiles N25 and N30 are obtained by using 1D IASP91 model (a, b) and velocity model corrected for crustal and mantle structure (c, d), respectively. In each profile, black dashed lines represent 410 km and 660 km, and light-blue and dark-blue dots denote observed '410' and '660', respectively. Diagram on top of each profile shows transition zone thickness (red dot-dash line) as well as numbers of receiver functions participating in CCP stacking at 410 km (light-green dots) and 660 km (dark-green dots) depth. |

|
图 5 ‘410’和‘660’界面深度分布 利用IASP91模型(a,b)和校正速度模型(c,d)得到的‘410’和‘660’深度变化.黑色三角代表台站,更多信息见图 1. Fig. 5 Depth distribution of '410' and '660' '410' and '660' are obtained by using IASP91 model (a, b) and corrected velocity model (c, d), respectively. Black triangles represent seismic station. See Fig. 1 for further information. |

|
图 6 速度模型校正前(a)、后(b)的转换带厚度分布,更多信息见图 1和图 4 Fig. 6 Map of mantle transition zone thickness before (a) and after (b) velocity model correction. See Figs. 1 and 4 for more information |
图 4展示了沿北纬25°和30°剖面(简称N25和N30)得到的CCP叠加结果,410 km和660 km附近两个连续的正波峰分别代表‘410’和‘660’间断面,通过拾取正波峰周围一定深度范围内振幅的最大值确定间断面的深度.使用一维IASP91模型(图 4a,4b)与校正速度模型(图 4c,4d)获得的CCP叠加剖面具有相似的间断面变化特征,结果中主要的差异在于间断面的绝对深度值.速度校正后,两间断面的绝对深度变化范围相对更贴近全球平均.对于剖面N25(图 4a,4c),‘410’变化相对平坦,利用两速度模型得到的间断面深度均是从东经96.5°的约421 km向东下沉到东经98.5°的约423 km,随后逐渐上升到东经103°的约412 km并在东经103°以东保持在411 km左右,平均深度约416 km;速度模型校正前后的‘660’普遍大于全球平均深度,并均展现出间断面下沉图像.图 4a中‘660’从东经96°—98.5°的平均683 km左右向东下沉到东经99°—103°的平均692 km,之后上升至东经104°的约667 km并向东缓慢升至东经107.5°的663 km左右,平均深度约680 km;图 4c中‘660’从东经96°的约680 km向东升至东经98.5°的678 km,随后降到东经99°的694 km,之后缓慢上升,并从东经102.5°的684 km抬升至东经104°的665 km,继而向东稳定在663 km左右,平均深度约677 km.对于剖面N30(图 4b,4d),两速度结构得到的‘410’深度普遍小于全球平均.图 4b中‘410’表现为东西浅中间深,变化范围在397~410 km,平均深度约404 km;‘660’表现为东西浅中间深,变化范围在657~684 km,平均深度约670 km.图 4d中‘410’表现出西浅东深,变化范围396~405 km,平均约400 km;‘660’变化范围655~682 km,平均约666 km.其中东经100°至102°存在下沉,并伴随有间断面变宽,振幅略有减弱.
为确保结果可靠,只对各剖面410 km和660 km深度处参与叠加接收函数条数均大于500的叠加结果进行分析,绘制了‘410’和‘660’间断面深度的空间分布(图 5),结果显示青藏东南缘下方两间断面结构存在显著变化.图 5a和5c所示为‘410’界面深度分布图,利用两种速度模型得到的间断面深度总体上均表现出由西南向东北逐渐变浅的特点,界面最深处位于印支块体,澜沧江断裂以东,红河断裂以南;最浅处位于研究区羌塘块体周围.其中IASP91模型获得的‘410’起伏范围在390~426 km,平均约410 km(图 5a);校正速度模型后‘410’在384~427 km之间变化,均值约为409 km(图 5c).速度模型校正后的‘410’绝对深度变化范围大于速度模型校正前的结果,但间断面起伏变化的整体趋势没有很大差别.
另一方面,研究区域内的‘660’普遍大于全球平均值.川滇菱形块体丽江断裂以南的滇中次级块体以及印支块体表现出明显的下沉.其中IASP91模型获得的‘660’起伏变化范围在653~696 km,平均深度约674 km(图 5b);校正速度模型后‘660’在649~698 km之间变化,均值约为671 km(图 5d).
将两间断面绝对深度值相减得到转换带厚度分布(图 6),其中最显著的特征是东经100°—104°的“弧形”增厚区,并且能够进一步分为南北两部分.北部异常出现在龙门山断裂以西,松潘—甘孜块体及丽江断层以北的川西北次级块体区域内(简称“川西异常”).该异常东西宽约220 km,从北纬29.5°附近一直向北延伸至本研究使用的资料覆盖区最北端.速度模型校正前后,川西异常的幅度略有不同,校正前最大厚度约274 km(图 6a),校正后异常更为明显且稍微靠南,最大厚度能够达到280 km(图 6b).异常西侧的羌塘和拉萨块体同样存在不同程度的增厚.南部异常区域则主要位于滇中次级块体及印支块体北部区域(简称“滇中—印支异常”).异常沿北东—南西向延伸约450 km,北西—南东向宽约300 km,转换带厚度的最大值不论速度校正与否,均可超过280 km.滇中—印支异常在北东向似乎并未延伸进入四川盆地下方,而在西南方向延伸到了怒江断裂附近.怒江断裂以西,转换带厚度仍大于全球平均,幅度略微减小.值得一提的是,研究区西南部的腾冲火山下方转换带仍相对增厚,厚度约263 km.此外,研究区东部龙门山、安宁河、小江断裂以东地区不存在明显的转换带厚度异常,图 6a中扬子克拉通及华夏褶皱系的转换带平均厚度分别为256 km和252 km左右,图 6b则约为257 km和253 km.
4 讨论 4.1 可靠性分析CCP叠加结果的可信度主要取决于数据质量和时深转换时采用的速度结构.为了确保数据质量,本研究对接收函数进行逐条筛选,剔除低信噪比的数据,只讨论穿透点覆盖(图 3)充分区域的转换带空间分布图像.由于上地幔具有很强的横向非均匀性,‘410’和‘660’的绝对深度依赖于时深转换中选用的速度模型结构.为了判断速度模型的影响,本研究将速度模型校正前后得到的CCP叠加结果进行比较(图 4—6),可以看出差异主要体现在间断面的绝对深度,而间断面的起伏趋势及转换带薄厚特征没有本质上的改变.
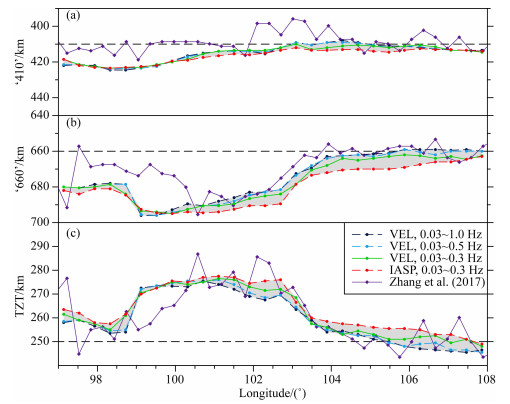
通过比较不同速度模型和/或不同频段滤波(0.03~0.3 Hz,0.03~0.5 Hz,0.03~1 Hz)的接收函数CCP叠加成像结果,进一步评估结果可靠性.以剖面N25为例(图 7),不同测试结果得到的‘410’深度差异最大约为5 km,‘660’差异相对明显,最大可达到10 km左右.此外,测试结果中均可观测到东经99°—104°附近转换带厚度的增加,不同结果厚度值的最大差异同样在10 km左右.我们将结果与Zhang等(2017)在北纬25.5°获得的CCP叠加剖面进行对比,发现间断面绝对深度值虽存在差异,但间断面起伏形态与转换带厚度特征基本一致.
|
图 7 剖面N25地幔转换带结构CCP叠加成像分析 阴影部分表示采用不同速度模型和/或不同频段滤波的接收函数CCP叠加得到的‘410’(a)和‘660’(b)绝对深度及转换带厚度(c)变化区间;紫色实线为Zhang等(2017)沿北纬25.5°得到的观测值(原文图 6b);黑色虚线为间断面深度及转换带厚度理论平均值.IASP和VEL分别代指IASP91模型和校正速度模型. Fig. 7 Analysis of mantle transition zone structure of profile N25 Shaded areas represent the differences of '410'(a), '660' (b) depth as well as mantle transition zone thickness (c) by applying different velocity models and/or frequency contributions of receiver functions, respectively. In each diagram, purple line represents the observation along 25.5°N in Fig. 6b of Zhang et al.(2017) while black dashed line denotes the theoretical average. IASP and VEL represent IASP91 model and corrected velocity model, respectively. |
由于上地幔速度的非均匀性主要影响间断面绝对深度而非变化趋势,且转换带内部横向非均匀性相对较小,两个间断面的深度差更能反映地幔转换带结构与动力学信息.因此,我们着重关注地幔转换带厚度的变化特征,并佐以间断面的起伏变化进行讨论,而不讨论两间断面的绝对深度.
4.2 地幔转换带的异常增厚本文的观测结果表明,青藏高原东南缘下方地幔转换带结构存在明显的空间变化,最显著的特点为研究区域中部的“弧形”异常增厚区.由转换带厚度空间分布(图 6)可以直观看出该增厚区南北两部分存有间隔.而间隔所处位置的穿透点分布(图 3)足够密集,穿透点间距小于相应深度处的菲涅尔带半径,能够确保接收函数CCP叠加成像结果真实可靠.其次,南北两个增厚区间断面起伏特征不同.北部表现为‘410’抬升和‘660’下沉;南部表现为‘410’稍有下沉,而‘660’显著下沉,且两间断面下沉位置在水平方向上不重合.故该地幔转换带增厚区可进一步细分为南北两部分.
Zhang等(2017)利用“中国地震科学台阵探测”在青藏东缘的两期流动地震台阵资料同样在该地区观测到南北两处转换带增厚.本研究与Zhang等(2017)数据集不完全相同,对接收函数的处理方式也存在差别,因此最终得到的CCP叠加图像存在不同.例如,Zhang等(2017)的图像中,腾冲火山下方地幔转换带厚度处于全球平均水平;本研究的成像结果却在腾冲火山下方观测到转换带增厚,这或许是本研究在滇西南地区的观测资料更为密集所致(图 1).
4.3 转换带异常增厚机制的探讨目前普遍认为,地幔转换带增厚主要与温度有关.发生在‘410’和‘660’两间断面处的物理相变过程具有相反的克拉伯龙斜率,当存在局部低温条件时,‘410’会相对抬升而‘660’则相对下沉,即造成地幔转换带的增厚.板块俯冲或岩石圈底部拆沉进入地幔转换带都有可能造成转换带的异常增厚.
由于转换带异常增厚几乎全部发生在龙门山、安宁河、小江断裂带以西,且扬子克拉通及华夏褶皱系下方不存在明显的间断面起伏变化,因而东侧的深部活动(Li et al., 2008; Li and Van De Hilst, 2010; Wang et al., 2010; Li et al., 2017)不太可能导致研究区域下方的地幔转换带增厚.
本研究所获得的地幔转换带结构图像表明滇中—印支异常存在约30 km的转换带增厚.若只考虑温度对转换带厚度的影响,每100 K的温度异常会带来10 km左右的厚度变化(Helffrich, 2000; Kind, 2002),那么滇中—印支异常相当于转换带内部约300 K的局部温度下降.考虑到温度敏感度大约在-0.43%/100 K(Cammarano et al., 2003),-300 K的温度变化对应于+1.3%的P波速度异常,这与前人在该区域得到的体波层析成像结果基本一致(Huang and Zhao, 2006; Wei et al., 2012; Huang et al., 2015a).层析成像结果表明,缅甸弧至印支块体下方的线状东倾高速异常体可能是俯冲的印度岩石圈板块(Huang and Zhao, 2006; Li et al., 2008; Lei et al., 2009; Wang et al., 2010; Replumaz et al., 2010; Koulakov, 2011; Wei et al., 2012; Yang et al., 2014; Huang et al., 2015a, 2015b).若冷的印度岩石圈板块直接俯冲进入转换带内,会造成局部温度降低,使得‘410’抬升及‘660’下沉,然而我们获得的间断面起伏形态是‘410’和‘660’均在该处下沉,且‘660’相比于‘410’的下沉幅度大,下沉位置偏东.我们推断东向俯冲的印度岩石圈与之前牵引其下沉的新特提斯洋板片发生了断离,其中大部分海洋岩石圈穿透‘660’进入下地幔(Van Der Voo et al., 1999; Replumaz et al., 2004; Hafkenscheid et al., 2006),但仍有部分物质水平停滞于‘660’之上,造成了‘660’在该处的大幅下沉.Pesicek等(2010)认为板块断离可以解释体波层析成像在缅甸弧下方观测到的高速体间断现象.速度结构和震源机制分析同样认为印度俯冲板块极有可能在东经97°附近发生了断离(胡家富等,2008).另一方面,板片断离形成的板片窗可能会触发软流圈物质部分熔融上涌(侯增谦和李振清,2004;Guo et al., 2015; Zhang et al., 2017).这一过程可能造成转换带上方局部升温,进而导致‘410’相变面小幅下沉.Yu等(2017)用类似的模型解释了研究区南部印支半岛下方的转换带结构.而腾冲火山下方地幔转换带仍存在增厚,即该处地幔转换带整体处在相对低温的环境,暗示着腾冲火山的起源与下地幔热柱无关,而可能与俯冲板块断离触发的熔融物质上涌有关.至于板片断离原因及空间位置有待进一步的研究.
由于间断面起伏变化趋势等差异,北部川西异常与滇中—印支异常的起源可能不同.考虑到川西高原附近海拔高、热流值高、Pn波速低、流变强度低等特点(徐明等,2011; Li et al., 2012; Chen et al., 2014),本研究认为川西异常可能与岩石圈底部发生的拆沉作用有关.由于转换带内密度和黏度的显著增大(Fukao et al., 1992),冷的拆沉物质进入地幔转换带引起局部低温,造成CCP叠加结果中的‘410’抬升和‘660’下沉,最终反映为转换带局部增厚(图 6).前人的接收函数研究同样将青藏高原东缘观测到的地幔转换带增厚归因于岩石圈底部拆沉作用(Singh and Kumar, 2009; Zhang et al., 2017).由于数据的差异,上述结果中的地幔转换带增厚位置处在成像区域边缘,而本研究观测到的转换带增厚位于研究区中部,这在一定程度上减小了区域边缘数据不充分对成像可信度的影响.数值模拟研究同样支持岩石圈拆沉的观点(Chen et al., 2014).此外,前人的接收函数研究结果在龙门山两侧观测到岩石圈厚度差异,即四川盆地下方岩石圈厚度明显大于川西地区,可能也反映了这一拆沉过程(Zhang et al., 2010; Hu et al., 2011).
5 结论利用密集的固定台网与流动台阵资料,本文对青藏高原东南缘的地幔转换带结构展开研究,所得到的P波接收函数CCP叠加结果显示:
(1) 研究区域下方地幔转换带结构有着强烈的横向变化,尤其以川滇菱形块体为主的中部地区下方地幔转换带显著增厚,最大厚度能够超过280 km,增厚区域可进一步划分为南部的滇中—印支异常和北部的川西异常.
(2) 滇中—印支异常可能与印度俯冲板块和新特提斯洋板片断离,冷的海洋板片部分滞留在转换带底部有关,30 km左右的增厚幅度将会带来约300 K的局部降温.腾冲火山的起源可能与板片断离引起的软流圈部分熔融物质上涌有关.
(3) 川西异常可能是上方岩石圈底部拆沉进入地幔转换带所致.
致谢感谢中国地震局地壳应力研究所雷建设研究员为本研究提供P波速度结构模型,中国地震局地球物理研究所“中国地震科学探测台阵数据中心”、中国地震局地球物理研究所国家数字测震台网数据备份中心(doi:10.7914/SN/CB)、IRIS数据中心、中国科学院地质与地球物理研究所地震台阵实验室为本文提供了地震波形数据.感谢两位审稿人以及中国科学院地质与地球物理研究所郑天愉研究员的建设性意见.数据处理与绘图使用到SAC(Seismic Analysis Code)和GMT4(Wessel and Smith, 1998)软件包.
Ai Y S, Zheng T Y.
2003. The upper mantle discontinuity structure beneath eastern China. Geophysical Research Letters, 30(21): 267-283.
DOI:10.1029/2003GL017678 |
|
Akaogi M, Tanaka A, Ito E.
2002. Garnet-ilmenite-perovskite transitions in the system Mg4Si4O12-Mg3Al2Si3O12 at high pressures and high temperatures:Phase equilibria, calorimetry and implications for mantle structure. Physics of the Earth and Planetary Interiors, 132(4): 303-324.
DOI:10.1016/S0031-9201(02)00075-4 |
|
Andrews J, Deuss A.
2008. Detailed nature of the 660 km region of the mantle from global receiver function data. Journal of Geophysical Research:Solid Earth, 113(B6): B06304.
DOI:10.1029/2007JB005111 |
|
Bai D H, Meju M A, Liao Z J.
2001. Magnetotelluric images of deep crustal structure of the Rehai geothermal field near Tengchong, southern China. Geophysical Journal International, 147(3): 677-687.
DOI:10.1046/j.0956-540x.2001.01568.x |
|
Bai D H, Unsworth M J, Meju M A, et al.
2010. Crustal deformation of the eastern Tibetan plateau revealed by magnetotelluric imaging. Nature Geoscience, 3(5): 358-362.
DOI:10.1038/ngeo830 |
|
Bao X W, Sun X X, Xu M J, et al.
2015. Two crustal low-velocity channels beneath SE Tibet revealed by joint inversion of Rayleigh wave dispersion and receiver functions. Earth and Planetary Science Letters, 415: 16-24.
DOI:10.1016/j.epsl.2015.01.020 |
|
Cammarano F, Goes S, Vacher P, et al.
2003. Inferring upper-mantle temperatures from seismic velocities. Physics of the Earth and Planetary Interiors, 138(3-4): 197-222.
DOI:10.1016/S0031-9201(03)00156-0 |
|
Chatterjee S, Goswami A, Scotese C R.
2013. The longest voyage:Tectonic, magmatic, and paleoclimatic evolution of the Indian plate during its northward flight from Gondwana to Asia. Gondwana Research, 23(1): 238-267.
DOI:10.1016/j.gr.2012.07.001 |
|
Chen L, Ai Y S.
2009. Discontinuity structure of the mantle transition zone beneath the North China Craton from receiver function migration. Journal of Geophysical Research:Solid Earth, 114(B6): B06307.
DOI:10.1029/2008JB006221 |
|
Chen L, Berntsson F, Zhang Z, et al.
2014. Seismically constrained thermo-rheological structure of the eastern Tibetan margin:Implication for lithospheric delamination. Tectonophysics, 627: 122-134.
DOI:10.1016/j.tecto.2013.11.005 |
|
Chen Y, Badal J, Hu J F.
2010. Love and Rayleigh wave tomography of the Qinghai-Tibet plateau and surrounding areas. Pure and Applied Geophysics, 167(10): 1171-1203.
DOI:10.1007/s00024-009-0040-1 |
|
ChinArray.
2006. China seismic array waveform data. China Earthquake Administration.
DOI:10.12001/ChinArray.Data |
|
Dueker K G, Sheehan A F.
1997. Mantle discontinuity structure from midpoint stacks of converted P to S waves across the Yellowstone hotspot track. Journal of Geophysical Research:Solid Earth, 102(B4): 8313-8327.
DOI:10.1029/96JB03857 |
|
Fan L P, Wu J P, Fang L H, et al.
2015. The characteristic of Rayleigh wave group velocities in the southeastern margin of the Tibetan Plateau and its tectonic implications. Chinese Journal of Geophysics (in Chinese), 58(5): 1555-1567.
DOI:10.6038/cjg20150509 |
|
Fu Y Y, Gao Y, Li A B, et al.
2017. Lithospheric structure of the southeastern margin of the Tibetan Plateau from Rayleigh wave tomography. Journal of Geophysical Research:Solid Earth, 122(6): 4631-4644.
DOI:10.1002/jgrb.v122.6 |
|
Fukao Y, Obayashi M, Inoue H, et al.
1992. Subducting slabs stagnant in the mantle transition zone. Journal of Geophysical Research, 97(B4): 4809-4822.
DOI:10.1029/91JB02749 |
|
Guo Z F, Cheng Z H, Zhang M L, et al.
2015. Post-collisional high-K calc-alkaline volcanism in Tengchong volcanic field, SE Tibet:Constraints on Indian eastward subduction and slab detachment. Journal of the Geological Society, 172(5): 50-54.
DOI:10.1144/jgs2014-078 |
|
Hafkenscheid E, Wortel M J R, Spakman W.
2006. Subduction history of the Tethyan region derived from seismic tomography and tectonic reconstructions. Journal of Geophysical Research:Solid Earth, 111(B8): B08401.
DOI:10.1029/2005JB003791 |
|
Helffrich G.
2000. Topography of the transition zone seismic discontinuities. Reviews of Geophysics, 38(1): 141-158.
DOI:10.1029/1999RG000060 |
|
Hou Z Q, Li Z Q.
2004. Possible location for underthrusting front of the Indus continent:constraints from Helium isotope of the geothermal gas in southern Tibet and eastern Tibet. Acta Geologica Sinica (in Chinese), 78(4): 482-493.
|
|
Hu J F, Hu Y L, Xia J Y, et al.
2008. Crust-mantle velocity structure of S wave and dynamic process beneath Burma Arc and its adjacent regions. Chinese Journal of Geophysics (in Chinese), 51(1): 140-148.
|
|
Hu J F, Xu X Q, Yang H Y, et al.
2011. S receiver function analysis of the crustal and lithospheric structures beneath eastern Tibet. Earth and Planetary Science Letters, 306(1-2): 77-85.
DOI:10.1016/j.epsl.2011.03.034 |
|
Hu J F, Yang H Y, Li G Q, et al.
2013. Seismic signature of the mantle transition zone beneath eastern Tibet and Sichuan Basin. Journal of Asian Earth Sciences, 62: 606-615.
DOI:10.1016/j.jseaes.2012.11.009 |
|
Huang J L, Zhao D P, Zheng S H.
2002. Lithospheric structure and its relationship to seismic and volcanic activity in southwest China. Journal of Geophysical Research:Solid Earth, 107(B10): ESE 13-1-ESE 13-14.
DOI:10.1029/2000JB000137 |
|
Huang J L, Zhao D P.
2006. High-resolution mantle tomography of China and surrounding regions. Journal of Geophysical Research:Solid Earth, 111(B9): B09305.
DOI:10.1029/2005JB004066 |
|
Huang Z C, Wang P, Xu M J, et al.
2015a. Mantle structure and dynamics beneath SE Tibet revealed by new seismic images. Earth and Planetary Science Letters, 411: 100-111.
DOI:10.1016/j.epsl.2014.11.040 |
|
Huang Z C, Zhao D P, Wang L S.
2015b. P wave tomography and anisotropy beneath Southeast Asia:Insight into mantle dynamics. Journal of Geophysical Research:Solid Earth, 120(7): 5154-5174.
DOI:10.1002/2015JB012098 |
|
Huangfu G.
1997. Review of studies on Tengchong volcanos. Journal of Seismological Research (in Chinese), 20(4): 431-437.
|
|
Ito E, Takahashi E.
1989. Postspinel transformations in the system Mg2SiO4-Fe2SiO4 and some geophysical implications. Journal of Geophysical Research:Solid Earth, 94(B8): 10637-10646.
DOI:10.1029/JB094iB08p10637 |
|
Jackson I.
1983. Some geophysical constraints on the chemical composition of the Earth's lower mantle. Earth and Planetary Science Letters, 62(1): 91-103.
DOI:10.1016/0012-821X(83)90073-0 |
|
Jiang G Z, Gao P, Rao S, et al.
2016. Compilation of heat flow data in the continental area of China (4th edition). Chinese Journal of Geophysics (in Chinese), 59(8): 2892-2910.
DOI:10.6038/cjg20160815 |
|
Kind R, Yuan X, Saul J, et al.
2002. Seismic images of crust and upper mantle beneath Tibet:Evidence for Eurasian plate subduction. Science, 298(5596): 1219-1221.
DOI:10.1126/science.1078115 |
|
Koulakov I.
2011. High-frequency P and S velocity anomalies in the upper mantle beneath Asia from inversion of worldwide traveltime data. Journal of Geophysical Research:Solid Earth, 116(B4): B04301.
DOI:10.1029/2010JB007938 |
|
Langston C A.
1979. Structure under Mount Rainer, Washington, inferred from teleseismic body wave. Journal of Geophysical Research:Solid Earth, 84(B9): 4749-4762.
DOI:10.1029/JB084iB09p04749 |
|
Lei J S, Zhao D P, Su Y J.
2009. Insight into the origin of the Tengchong intraplate volcano in southwest China from local and teleseismic data. Journal of Geophysical Research:Solid Earth, 114(B5): B05302.
DOI:10.1029/2008JB005881 |
|
Lei J S, Xie F R, Fan Q C, et al.
2013. Seismic imaging of the deep structure under the Chinese volcanoes:An overview. Physics of the Earth and Planetary Interiors, 224: 104-123.
DOI:10.1016/j.pepi.2013.08.008 |
|
Lei J S, Zhao D P.
2016. Teleseismic P-wave tomography and mantle dynamics beneath Eastern Tibet. Geochemistry, Geophysics, Geosystems, 17(5): 1861-1884.
DOI:10.1002/2016GC006262 |
|
Li C, Van Der Hilst R D, Meltzer A S, et al.
2008. Subduction of the Indian lithosphere beneath the Tibetan Plateau and Burma. Earth and Planetary Science Letters, 274(1-2): 157-168.
DOI:10.1016/j.epsl.2008.07.016 |
|
Li C, Van Der Hilst R D.
2010. Structure of the upper mantle and transition zone beneath Southeast Asia from traveltime tomography. Journal of Geophysical Research:Solid Earth, 115(B7): B07308.
DOI:10.1029/2009JB006882 |
|
Li G H, Bai L, Zhou Y Z, et al.
2017. Velocity structure of the mantle transition zone beneath the southeastern margin of the Tibetan Plateau. Tectonophysics, 712: 349-360.
DOI:10.1016/j.tecto.2017.08.009 |
|
Li Y H, Wu Q J, Tian X B, et al.
2009. Crustal structure in the Yunnan region determined by modeling receiver functions. Chinese Journal of Geophysics (in Chinese), 52(1): 67-80.
|
|
Li Z W, Ni S D, Hao T Y, et al.
2012. Uppermost mantle structure of the eastern margin of the Tibetan Plateau from interstation Pn traveltime difference tomography. Earth and Planetary Science Letters, 335-336: 195-205.
DOI:10.1016/j.epsl.2012.05.005 |
|
Liang S M, Gan W J, Shen C Z, et al.
2013. Three-dimensional velocity field of present-day crustal motion of the Tibetan Plateau derived from GPS measurements. Journal of Geophysical Research:Solid Earth, 118(10): 5722-5732.
DOI:10.1002/2013JB010503 |
|
Liu Q Y, Van Der Hilst R D, Li Y, et al.
2014. Eastward expansion of the Tibetan Plateau by crustal flow and strain partitioning across faults. Nature Geoscience, 7(5): 361-365.
DOI:10.1038/NGEO2130 |
|
Liu Z, Niu F L, Chen Y J, et al.
2015. Receiver function images of the mantle transition zone beneath NE China:New constraints on intraplate volcanism, deep subduction and their potential link. Earth and Planetary Science Letters, 412: 101-111.
DOI:10.1016/j.epsl.2014.12.019 |
|
Mulibo G D, Nyblade A A.
2013. Mantle transition zone thinning beneath eastern Africa:Evidence for a whole-mantle superplume structure. Geophysical Research Letters, 40(14): 3562-3566.
DOI:10.1002/grl.50694 |
|
Pan J T, Li Y H, Wu Q J, et al.
2015. Phase velocity maps of Rayleigh waves in the southeast Tibetan plateau. Chinese Journal of Geophysics (in Chinese), 58(11): 3993-4006.
DOI:10.6038/cjg20151109 |
|
Pesicek J D, Thurber C H, Widiyantoro S, et al.
2010. Sharpening the tomographic image of the subducting slab below Sumatra, the Andaman Islands and Burma. Geophysical Journal International, 182(1): 433-453.
DOI:10.1111/j.1365-246X.2010.04630.x |
|
Qin J Z, Huangfu G, Zhang J W.
1998. Characteristics of Q values around Tengchong volcano and adjacent areas. Journal of Seismological Research (in Chinese), 21(4): 358-361.
|
|
Replumaz A, Negredo A M, Guillot S, et al.
2010. Multiple episodes of continental subduction during India/Asia convergence:Insight from seismic tomography and tectonic reconstruction. Tectonophysics, 483(1-2): 125-134.
DOI:10.1016/j.tecto.2009.10.007 |
|
Replumaz A, Kárason H, Van Der Hilst R D, et al.
2004. 4-D evolution of SE Asia's mantle from geological reconstructions and seismic tomography. Earth and Planetary Science Letters, 221(1-4): 103-115.
DOI:10.1016/S0012-821X(04)00070-6 |
|
Ringwood A E.
1975. Composition and Petrology of the Earth's Mantle. New York:McGraw-Hill, 618.
|
|
Royden L H, Burchfiel B C, Van Der Hilst R D.
2008. The geological evolution of the Tibetan plateau. Science, 321(5892): 1054-1058.
DOI:10.1126/science.1155371 |
|
Shangguan Z G, Bai C H, Song M L.
2000. Mantle-derived magmatic gas releasing features at Rehai area, Tengchong county, Yunnan province, China. Science in China Series D:Earth Sciences, 43(2): 132-140.
DOI:10.1007/BF02878142 |
|
Shen X Z, Zhou H L, Kawakatsu H.
2008. Mapping the upper mantle discontinuities beneath China with teleseismic receiver functions. Earth, Planets and Space, 60(7): 713-719.
DOI:10.1186/BF03352819 |
|
Singh A, Kumar M R.
2009. Seismic signatures of detached lithospheric fragments in the mantle beneath eastern Himalaya and southern Tibet. Earth and Planetary Science Letters, 288(1-2): 279-290.
DOI:10.1016/j.epsl.2009.09.031 |
|
Sun Y, Niu F L, Liu H F, et al.
2012. Crustal structure and deformation of the SE Tibetan plateau revealed by receiver function data. Earth and Planetary Science Letters, 349-350: 186-197.
DOI:10.1016/j.epsl.2012.07.007 |
|
Tonegawa T, Hirahara K, Shibutani T.
2005. Detailed structure of the upper mantle discontinuities around the Japan subduction zone imaged by receiver function analyses. Earth, Planets and Space, 57(1): 5-14.
DOI:10.1186/BF03351801 |
|
Tselentis G A.
1990. Interstation surface wave attenuation by autoregressive deconvolution. Pure and Applied Geophysics, 133(3): 429-446.
DOI:10.1007/BF00877999 |
|
Vacher P, Mocquet A, Sotin C.
1998. Computation of seismic profiles from mineral physics:The importance of the non-olivine components for explaining the 660-km depth discontinuity. Physics of the Earth and Planetary Interiors, 106(3-4): 275-298.
DOI:10.1016/S0031-9201(98)00076-4 |
|
Van Der Voo R, Spakman W, Bijwaard H.
1999. Tethyan subducted slabs under India. Earth and Planetary Science Letters, 171(1): 7-20.
DOI:10.1016/S0012-821X(99)00131-4 |
|
Wang C Y, Huangfu G.
2004. Crustal structure in Tengchong volcano-geothermal area, western Yunnan, China. Tectonophysics, 380(1-2): 69-87.
DOI:10.1016/j.tecto.2003.12.001 |
|
Wang F Y, Pan S Z, Liu L, et al.
2014. Wide angle seismic exploration of Yuxi-Lincang profile-The research of crustal structure of the red river fault zone and southern Yunnan. Chinese Journal of Geophysics (in Chinese), 57(10): 3247-3258.
DOI:10.6038/cjg20141013 |
|
Wang Y, Zhang X M, Jiang C S, et al.
2007. Tectonic controls on the late Miocene-Holocene volcanic eruptions of the Tengchong volcanic field along the southeastern margin of the Tibetan plateau. Journal of Asian Earth Sciences, 30(2): 375-389.
DOI:10.1016/j.jseaes.2006.11.005 |
|
Wang Z, Zhao D P, Wang J.
2010. Deep structure and seismogenesis of the north-south seismic zone in southwest China. Journal of Geophysical Research:Solid Earth, 115(B12): B12334.
DOI:10.1029/2010JB007797 |
|
Wei W, Xu J D, Zhao D P, et al.
2012. East Asia mantle tomography:New insight into plate subduction and intraplate volcanism. Journal of Asian Earth Sciences, 60: 88-103.
DOI:10.1016/j.jseaes.2012.08.001 |
|
Wessel P, Smith W H F.
1998. New, improved version of generic mapping tools released. EOS, 79(47): 579.
DOI:10.1029/98EO00426 |
|
Wu J P, Yang T, Wang W L, et al.
2013. Three dimensional P-wave velocity structure around Xiaojiang fault system and its tectonic implications. Chinese Journal of Geophysics (in Chinese), 56(7): 2257-2267.
DOI:10.6038/cjg20130713 |
|
Wu Q J, Tian X B, Zhang N L, et al.
2003. Receiver function estimated by maximum entropy deconvolution. Acta Seismologica Sinica (in Chinese), 25(4): 382-389.
|
|
Wu Q J, Li Y H, Zhang R Q, et al.
2007. Receiver functions from autoregressive deconvolution. Pure and Applied Geophysics, 164(11): 2175-2192.
DOI:10.1007/s00024-007-0269-5 |
|
Wu T F, Zhang S X, Li M K, et al.
2016. Two crustal flowing channels and volcanic magma migration underneath the SE margin of the Tibetan Plateau as revealed by surface wave tomography. Journal of Asian Earth Sciences, 132: 25-39.
DOI:10.1016/j.jseaes.2016.09.017 |
|
Xie J Y, Ritzwoller M H, Shen W S, et al.
2013. Crustal radial anisotropy across eastern Tibet and the western Yangtze craton. Journal of Geophysical Research:Solid Earth, 118(8): 4226-4252.
DOI:10.1002/jgrb.50296 |
|
Xie J Y, Ritzwoller M H, Shen W S, et al.
2017. Crustal anisotropy across eastern Tibet and surroundings modeled as a depth-dependent tilted hexagonally symmetric medium. Geophysical Journal International, 209(1): 466-491.
|
|
Xu L L, Rondenay S, Van Der Hilst R D.
2008. Structure of the crust beneath the southeastern Tibetan Plateau from teleseismic receiver functions. Physics of the Earth and Planetary Interiors, 165(3-4): 176-193.
|
|
Xu M, Zhu C Q, Rao S, et al.
2011. Difference of thermal structure between eastern edge of Tibet Plateau and western Sichuan Basin. Scientia Geologica Sinica (in Chinese), 46(1): 203-212.
|
|
Xu Q, Zhao J M, Cui Z X, et al.
2009. Structure of the crust and upper mantle beneath the southeastern Tibetan Plateau by P and S receiver functions. Chinese Journal of Geophysics (in Chinese), 52(12): 3001-3008.
DOI:10.3969/j.issn.0001-5733.2009.12.009 |
|
Xu Y, Yang X T, Liu J H.
2013. Tomographic study of crustal velocity structures in the Yunnan region southwest China. Chinese Journal of Geophysics (in Chinese), 56(6): 1904-1914.
DOI:10.6038/cjg20130613 |
|
Yang H Y, Peng H C, Hu J F.
2017. The lithospheric structure beneath southeast Tibet revealed by P and S receiver functions. Journal of Asian Earth Sciences, 138: 62-71.
DOI:10.1016/j.jseaes.2017.02.001 |
|
Yang T, Wu J P, Fang L H, et al.
2014. Complex structure beneath the southeastern Tibetan plateau from teleseismic P-wave tomography. Bulletin of the Seismological Society of America, 104(3): 1056-1069.
DOI:10.1785/0120130029 |
|
Yang Y J, Ritzwoller M H, Zheng Y, et al.
2012. A synoptic view of the distribution and connectivity of the mid-crustal low velocity zone beneath Tibet. Journal of Geophysical Research:Solid Earth, 117(4): B04303.
DOI:10.1029/2011JB008810 |
|
Yao H J, Beghein C, Van Der Hilst R D.
2008. Surface wave array tomography in SE Tibet from ambient seismic noise and two-station analysis-Ⅱ. Crustal and upper-mantle structure. Geophysical Journal International, 173(1): 205-219.
DOI:10.1111/j.1365-246X.2007.03696.x |
|
Yu Y Q, Gao S S, Liu K H, et al.
2017. Mantle transition zone discontinuities beneath the Indochina Peninsula:Implications for slab subduction and mantle upwelling. Geophysical Research Letters, 44(14): 7159-7167.
DOI:10.1002/2017GL073528 |
|
Zhang L T, Jin S, Wei W B, et al.
2012. Electrical structure of crust and upper mantle beneath the eastern margin of the Tibetan plateau and the Sichuan basin. Chinese Journal of Geophysics (in Chinese), 55(12): 4126-4137.
DOI:10.6038/j.issn.0001-5733.2012.12.025 |
|
Zhang R Q, Wu Y, Gao Z Y, et al.
2017. Upper mantle discontinuity structure beneath eastern and southeastern Tibet:New constraints on the Tengchong intraplate volcano and signatures of detached lithosphere under the western Yangtze Craton. Journal of Geophysical Research:Solid Earth, 122(2): 1367-1380.
DOI:10.1002/2016JB013551 |
|
Zhang Z, Yuan X, Yun C, et al.
2010. Seismic signature of the collision between the east Tibetan escape flow and the Sichuan Basin. Earth and Planetary Science Letters, 292(3-4): 254-264.
DOI:10.1016/j.epsl.2010.01.046 |
|
Zheng C, Ding Z F, Song X D.
2016. Joint inversion of surface wave dispersion and receiver functions for crustal and uppermost mantle structure in Southeast Tibetan Plateau. Chinese Journal of Geophysics (in Chinese), 59(9): 3223-3236.
DOI:10.6038/cjg20160908 |
|
Zheng D C, Saygin E, Cummins P, et al.
2017. Transdimensional Bayesian seismic ambient noise tomography across SE Tibet. Journal of Asian Earth Sciences, 134: 86-93.
DOI:10.1016/j.jseaes.2016.11.011 |
|
Zheng X F, Ouyang B, Zhang D N, et al.
2009. Technical system construction of Data Backup Centre for China Seismograph Network and the data support to researches on the Wenchuan earthquake. Chinese Journal of Geophysics (in Chinese), 52(5): 1412-1417.
DOI:10.3969/j.issn.0001-5733.2009.05.031 |
|
Zhu B Q, Mao C X, Lugmair G W, et al.
1983. Isotopic and geochemical evidence for the origin of Plio-Pleistocene volcanic rocks near the Indo-Eurasian collisional margin at Tengchong, China. Earth and Planetary Science Letters, 65(2): 263-275.
DOI:10.1016/0012-821X(83)90165-6 |
|
Zhu L P, Kanamori H.
2000. Moho depth variation in southern California from teleseismic receiver functions. Journal of Geophysical Research, 105(B2): 2969-2980.
DOI:10.1029/1999JB900322 |
|
Zhu L P.
2000. Crustal structure across the San Andreas Fault, Southern California from teleseismic converted waves. Earth and Planetary Science Letters, 179(1): 183-190.
DOI:10.1016/S0012-821X(00)00101-1 |
|
范莉苹, 吴建平, 房立华, 等.
2015. 青藏高原东南缘瑞利波群速度分布特征及其构造意义探讨. 地球物理学报, 58(5): 1555–1567.
DOI:10.6038/cjg20150509 |
|
侯增谦, 李振清.
2004. 印度大陆俯冲前缘的可能位置:来自藏南和藏东活动热泉气体He同位素约束. 地质学报, 78(4): 482–493.
|
|
胡家富, 胡毅力, 夏静瑜, 等.
2008. 缅甸弧及邻区的壳幔S波速度结构与动力学过程. 地球物理学报, 51(1): 140–148.
|
|
皇甫岗.
1997. 腾冲火山研究综述. 地震研究, 10(4): 431–437.
|
|
姜光政, 高堋, 饶松, 等.
2016. 中国大陆地区大地热流数据汇编(第四版). 地球物理学报, 59(8): 2892–2910.
DOI:10.6038/cjg20160815 |
|
李永华, 吴庆举, 田小波, 等.
2009. 用接收函数方法研究云南及其邻区地壳上地幔结构. 地球物理学报, 52(1): 67–80.
|
|
潘佳铁, 李永华, 吴庆举, 等.
2015. 青藏高原东南部地区瑞雷波相速度层析成像. 地球物理学报, 58(11): 3993–4006.
DOI:10.6038/cjg20151109 |
|
秦嘉政, 皇甫岗, 张俊伟.
1998. 腾冲火山及其周围地区的地壳Q值特征. 地震研究, 21(4): 358–361.
|
|
王夫运, 潘素珍, 刘兰, 等.
2014. 玉溪-临沧剖面宽角地震探测—红河断裂带及滇南地壳结构研究. 地球物理学报, 57(10): 3247–3258.
DOI:10.6038/cjg20141013 |
|
吴建平, 杨婷, 王未来, 等.
2013. 小江断裂带周边地区三维P波速度结构及其构造意义. 地球物理学报, 56(7): 2257–2267.
DOI:10.6038/cjg20130713 |
|
吴庆举, 田小波, 张乃铃, 等.
2003. 计算台站接收函数的最大熵谱反褶积方法. 地震学报, 25(4): 382–389.
|
|
徐明, 朱传庆, 绕松, 等.
2011. 阿坝-简阳地学剖面深部温度及热结构. 地质科学, 46(1): 203–212.
|
|
徐强, 赵俊猛, 崔仲雄, 等.
2009. 利用接收函数研究青藏高原东南缘的地壳上地幔结构. 地球物理学报, 2009, 52(12): 3001–3008.
DOI:10.3969/j.issn.0001-5733.2009.12.009 |
|
胥颐, 杨晓涛, 刘建华.
2013. 云南地区地壳速度结构的层析成像研究. 地球物理学报, 56(6): 1904–1914.
DOI:10.6038/cjg20130613 |
|
张乐天, 金胜, 魏文博, 等.
2012. 青藏高原东缘及四川盆地的壳幔导电性结构研究. 地球物理学报, 55(12): 4126–4137.
DOI:10.6038/j.issn.0001-5733.2012.12.025 |
|
郑晨, 丁志峰, 宋晓东.
2016. 利用面波频散与接收函数联合反演青藏高原东南缘地壳上地幔速度结构. 地球物理学报, 59(9): 3223–3236.
DOI:10.6038/cjg20160908 |
|
郑秀芬, 欧阳飚, 张东宁, 等.
2009. "国家数字测震台网数据备份中心"技术系统建设及其对汶川大地震研究的数据支撑. 地球物理学报, 52(5): 1412–1417.
DOI:10.3969/j.issn.0001-5733.2009.05.031 |
|
中国地震科学台阵.
2006. 中国地震科学探测台阵波形数据. 中国地震局.
DOI:10.12001/ChinArray.Data |
|
 2018, Vol. 61


