 2018, Vol. 61


在青藏高原东缘,横跨龙门山褶皱冲断带几十公里范围内,地表高程从大于4 km快速下降为~500 m(图 1a和图 1b),形成了现今青藏高原周边最陡的地形(Burchfiel et al., 1995; Jia et al., 2006;Kirby et al., 2008).前人已对龙门山断裂带的隆升机制进行了大量的研究,主要存在两种观点:1)地壳缩短,认为脆性地壳以若干拆离断层的形式产生大量滑移而缩短增厚(Avouac and Tapponnier, 1993; Tapponnier et al., 2001; Hubbard and Shaw, 2009; Hubbard et al., 2010; Jia et al., 2010; Robert et al., 2010; Fu et al., 2011;Guo et al., 2013);2)中下地壳流,认为青藏高原软弱的中下地壳物质向东移动的过程中,受到坚硬的四川盆地的阻挡,产生部分物质的堆积增厚(Bird, 1991; Burchfiel et al., 1995, 2008; Royden et al., 1997, 2008; Clark and Royden, 2000; Clark et al., 2005; Kirby et al., 2002, 2003; Cook and Royden, 2008).目前,这两种观点仍在争论之中(Fu et al., 2011; Guo et al., 2013; Liu et al., 2015).
地壳缩短造山是地质学家关于青藏造山隆升的基本解释(李吉均等, 1979; Mercier et al., 1987; Harrison et al., 1992; 傅容珊等, 2000).在青藏东部,多发育逆冲断层或具有逆冲滑动的断层(比如龙门山断层带、龙日坝断层带等);而上地壳的缩短可以通过这些断层上的脆性破裂(地震)体现.比如,发生在龙门山断裂带上的2008汶川MW7.9地震以及2013芦山MW6.6地震(徐锡伟等, 2008; 陈运泰等, 2013).震源定位结果显示两次主震均发生在上地壳的底部(14~19 km),绝大部分的余震则发生在上地壳范围(5~25 km)(黄媛等,2008;刘巧霞等,2010;陈九辉等,2009;陈运泰等,2013),但在中下地壳范围内罕见余震的发生.
近年来,越来越多的研究也支持了中下地壳流模型.地球物理探测及岩石试验研究表明,青藏高原中下地壳存在部分熔融或含水物质的黏滞性流体(Brown et al., 1996; Nelson et al., 1996; Yuan et al., 1997; Li et al., 2003; Holbig and Grove, 2008). 朱介寿等(2017)通过反演青藏东部地壳及上地幔的精细速度结构和泊松比认为,川西及滇西北地区普遍存在中地壳低速层;并通过分析认为位于中地壳的黏滞性地壳流从羌塘地体流出,自北西向南东流进青藏东缘.前人许多研究也根据青藏东缘中下地壳的低速、低阻及高泊松比的特点,从而支持中下地壳通道流(赵国泽等, 2008; 王椿镛等, 2008; 朱介寿等, 2017).
中下地壳流的存在不仅需要低的中下地壳黏度,还需要合适的动力学环境(Clark and Royden, 2000;Clark et al., 2005).Yin(2010)对在中下地壳处低速、高导区的存在是否就能推断地壳流的发生提出质疑,并指出地壳流的发生更依赖力学边界条件.张培震(2008)也提出地壳流的存在需要3个必要条件:1)存在能够发生流动的软弱层;2)存在地壳厚度、密度差异,或者地貌高差引起的横向压力梯度,产生Poiseuille流;3)脆性上地壳或刚性上地幔相对于软弱层发生运动,产生Couette流.一些地球物理探测、地热研究及余震定位结果(Hu et al., 2000; 黄媛等, 2008; 刘巧霞等, 2010; 陈九辉等, 2009; Zhang et al., 2010a; Bai et al., 2010; Yang et al., 2012; 陈运泰等, 2013; 朱介寿等, 2017)推断青藏东缘中下地壳存在软弱层,而与其相邻的四川盆地中则不存在类似的软弱层.深部探测研究表明青藏东部与四川盆地地壳厚度差约30 km(刘启元等, 2009; Robert et al., 2010; Wang et al., 2010a),地貌高差达~4 km,此外水准测量显示青藏东部相对四川盆地仍在抬升(张竹琪等, 2010b; Hao et al., 2014).这些研究表明青藏高原东缘相对于四川盆地存在着横向压力梯度,即存在发生Poiseuille流的动力条件.
目前青藏东部有关中下地壳流是否存在的推断,大都基于间接的地球物理观测数据,或者直接的对地观测变形数据(Hu et al., 2000; Zhang et al., 2010a; Bai et al., 2010; Yang et al., 2012; Zhu and Zhang, 2013; 陈运泰等, 2013; Yi et al., 2016; 朱介寿等, 2017).通过间接的地球物理观测数据推断地下的物质的运动状态具有一定的局限性,因为流动的发生不仅取决于物质的性质,还取决于物质所处的力学环境.总之,关于青藏东部中下地壳流是否存在,地壳深部变形机制仍然不清楚,仍然处于争论之中.
近年来地形变测量技术迅速发展,我们获得了大量的地壳短期变形数据.以汶川地震为例,我们能够得到震前十年的地表变形数据、同震变形分布以及震后的变形数据(Zhang et al., 2004; Gan et al., 2007; 王庆良等2008;Liu-Zeng et al., 2009; Zhao et al., 2015).如图 1a、1c、1d显示了汶川地震发生前地表变形数据,反映了青藏高原东缘当今的震间构造变形速度场.观测数据显示川西地区仍处于快速差异性隆升阶段,变形主要发生在龙门山左侧青藏高原东部(图 1c和图 1d),横跨青藏东部的300 km范围内表现出明显的水平缩短(~5 mm·a-1)(图 1c)以及相对四川盆地的垂向抬升(1~4 mm·a-1)(图 1d).

|
图 1 青藏高原东缘断层、高程与地表观测速度场 (a)青藏高原东缘与四川盆地的断层与GPS速度图.蓝色矢量为GPS水平速度场;黑点为大地水准测量(leveling)测点;白线为垂直龙门山走向的剖面,用于获取图 1b的地形;橘色虚框为选取对地观测数据的区域; (b)横跨龙门山断层带的地表高程; (c)垂直龙门山断层带走向的GPS水平速度场,GPS数据来自Gan等(2007); (d)垂直龙门山断层带走向的leveling垂向速度场,数据来自Hao等(2014).(b)、(c)和(d)图中的红色虚线代表龙门山断层带的位置. Fig. 1 Faults, elevation, and present-day GPS and leveling crustal motion in eastern Tibet (a) Regional faults and GPS (Global Positioning System) velocities in eastern Tibet and western Sichuan Basin. Blue vectors show GPS velocities; Black points show stations of leveling data; the white line perpendicular to the strike of Longmen Shan fault zone is the location of topographic profile in (b). Orange dashed box is the region for plotting profiles of GPS and leveling velocities in (c) and (d); (b) Elevation profile across the Longmen Shan fault zone; (c) Horizontal GPS velocity profile perpendicular to the strike of Longmen Shan fault zone. GPS data are from Gan et al. (2007); (d) Vertical leveling velocity profile perpendicular to the strike of Longmen Shan fault zone (Hao et al., 2014). The red dashed line represents the Longmen Shan fault zone. |
那么通过分析对比直接的现今对地观测变形数据能否辨认出中下地壳流的存在?能否确定中下地壳流的流动样式?以及可能的不同的中下地壳流的流动样式会造成怎么不同的地表变形?本文通过建立二维黏弹塑性有限元模型,尝试回答这些问题.文中模拟了中下地壳流存在及不存在的情况下在地震循环过程中短期应变分布及地表变形速度演化,并根据近十年的对地观测数据对模型结果进行约束,探讨和研究青藏东缘中下地壳流的流动状态,及可能的各种不同的中下地壳流动样式与速度会造成的地表变形与运动速度.
1 有限元数值方法及模型建立 1.1 模型设置本文建立的二维黏弹塑性有限元数值模型如图 2所示.模型剖面垂直于龙门山断层带走向并跨过青藏高原东部与四川盆地,模型长度为600 km,深度至100 km.模型西侧(左侧)部分为青藏高原东部,模型东侧(右侧)部分为四川盆地;模型两侧具有不同的地壳厚度:西侧地壳厚度设为60 km,东侧为40 km(王有学等, 2005; Liu et al., 2009b; Wang et al., 2007; Zhang et al., 2009; Chen et al., 2014),从青藏高原至四川盆地在龙门山地区存在Moho面深度的转折(朱介寿, 2007).

|
图 2 二维黏弹塑性有限元模型 UC代表上地壳;LC代表下地壳;UM代表上地幔;MLC代表中下地壳;V0为左侧边界速度;Vmax为地壳流最大速度;L为向内施加差异性边界的长度或中下地壳流的长度. Fig. 2 The two-dimensional viscoelastoplastic finite element model UC represents upper crust; LC represents lower crust; UM represents upper mantle; MLC represents middle-lower crust; V0 represents boundary velocity at the left side; Vmax represents maximum velocity of middle-lower crust flow; L represents range length of middle-lower crust flow. |
模型顶部20 km为脆性上地壳或生震地壳,由弹塑性材料模拟(Luo and Liu, 2010; Liu et al., 2015).断层位于模型顶部中央,贯穿整个上地壳;断层厚度设置为2 km(Luo and Liu, 2009, 2010, 2012),倾角为30°,是对龙门山断层(带)的一阶近似;断层由应变软化的弹塑性单元模拟;相对于周围地壳,断层强度较弱.模型西侧20~60 km深度为中下地壳,60~100 km深度为岩石圈地幔;东侧20~40 km深度为中下地壳,40~100 km深度为岩石圈地幔.模型的中下地壳和岩石圈地幔均由Maxwell黏弹性材料模拟(表 1).
|
|
表 1 参考模型的岩石圈各分层物质参数设置 Table 1 Material parameters for the reference model |
模型涉及的参数为:杨氏模量E、泊松比υ、黏度η、内聚力C、密度ρ以及内摩擦角φ.参考模型的参数设置如表 1所示.
黏度的设定参考石耀霖等(2008)中国大陆岩石圈等效黏度的研究结果.在不同的模型算例中(见表 2),我们也测试了不同的青藏高原中下地壳黏度(~1018-1021Pa·s)的影响.杨氏模量、密度等的取值根据以往研究(柳畅等, 2012, 2014; Zhu and Zhang, 2013)选取其平均值,本文不考虑泊松比差异的影响.内聚力和内摩擦角的设置参考(Chéry et al., 2001; Li et al., 2009; He et al., 2013),因此,上地壳的力学强度从大至小依次为四川盆地、青藏高原、断层;龙门山断层的力学强度显著弱于青藏高原及四川盆地的上地壳(表 1).
|
|
表 2 不同模型的中下地壳的参数设置.模型算例2-7的其他参数与算例1(参考模型)相同(见表 1) Table 2 Parameters setup of middle-lower crust in different cases. Other parameters in cases 2-7 are the same as those in case 1 (reference case) (Table 1) |
在模型右侧边界,水平方向位移固定,垂直方向位移可自由滑动(图 2).模型底边界的垂直方向位移固定,水平方向位移可自由滑动(图 2).模型上表面为自由表面(图 2).在模型左侧边界,无地壳流时施加5 mm·a-1的右向水平速度(图 2)(柳畅等, 2012, 2014; Zhu and Zhang, 2013; Liu et al., 2015; 尹力等, 2018);因此,整个模型的水平缩短速率是5 mm·a-1,与GPS数据得到的横跨龙门山断裂带600 km范围地壳缩短速率是一致的(Zhang et al., 2004; Shen et al., 2005; Gan et al., 2007).假设中下地壳及岩石圈地幔均与上地壳运动速度无差异(Bendick and Flesch, 2007; Wang et al., 2008),这种边界条件被称之为深度一致性边界条件,即BC1(图 2黑色实线).由于这种深度方向一致性的边界不能够反映中下地壳与上地壳及岩石圈地幔的差异性运动,因此,本文中有地壳流时施加不同的边界条件来模拟中下地壳与上地壳及岩石圈地幔的差异运动.通过对模型左侧边界施加一个深度方向非一致性的边界条件(图 2)来模拟中下地壳流,称之为深度非一致性边界条件,即BC2(图 2绿色实线).本文强调:文章中并没有探索和模拟中下地壳流产生的驱动力,而是以探索不同的中下地壳流样式与地壳地表变形样式的联系为目标.BC1和BC2仅在中下地壳部分存在差异.在模拟中下地壳流时(BC2),给定中下地壳流动层或软弱层的厚度为20 km(见图 2黑色虚线).这是根据地震波及大地电磁数据的成像结果得到的典型的中下地壳低速、低阻的软弱层厚度(Zhang et al., 2010a; Bai et al., 2010; Yang et al., 2012; 朱介寿等, 2017).
前人研究(Clark and Royden, 2000; Cao et al., 2009; 朱介寿等, 2017)认为青藏高原中下地壳物质从青藏高原内部向东流动,由于受到华南块体的阻挡,在龙门山地区产生堆积抬升.这种观点认为从青藏中部至东部龙门山断裂带之间很长的距离范围内存在地壳流.在数值模拟的过程中,通常仅对模型左边界施加随深度变化的边界条件,来模拟中下地壳的差异性流动(杨辉等, 2013; 柳畅等, 2014).但在初始边界条件作用下,通道流的效应存在着一定的作用范围,即随距左侧边界水平方向距离的增加,通道流的效应逐渐减弱.因此,本文通过改变中下地壳的速度边界向内部扩展的距离L,来增大地壳流的作用范围.在不同的模型算例中(见表 2),文中也测试了BC1与BC2边界条件、不同的Vmax速度及不同的L对模型结果的影响.本文只考虑Poiseuille流,即通道流的流速最大值在其中部,模拟通道流的同时考虑了流动速度以及通道黏度的影响.
地球动力学数值模拟中初始条件是难以确定和约束的(柳畅等, 2012, 2014; 祝爱玉和张东宁, 2014; 祝爱玉等, 2015, 2016; 黄禄渊等, 2017a, 2017b).以往的研究对初始条件的设置,假设初始应力为0,忽略了重力的影响(柳畅等, 2012, 2014).由于岩石圈的长期流变特性,使得应力状态趋向于静岩压力(祝爱玉等, 2014),因此,本文中模型的初应力场是一个静岩应力场(无偏应力或剪切应力):模型内任意一点各个方向的正应力等于该点上覆岩石的重力.经过5万年时间的边界加载,模型达到稳定加载状态,因此我们获得了稳定的背景应力场,应力可以在一定的范围内波动,这是由于地震导致的应力扰动(尹力等,2018; 孙云强等, 2018).文中选取模型进入稳定状态后的地震循环模拟结果,分析了地震循环的不同阶段的变形.由于研究的时间尺度较短,为万年时间尺度,因此忽略了地形载荷的影响(Li and Liu, 2006; Luo and Liu, 2012).
1.3 控制方程模型通过求解静态的力平衡方程来模拟地壳岩石圈的应力与变形:

|
(1) |
其中σij为应力张量(i, j=1, 2, 3),ρ为密度,gi为重力加速度.
在进行数值模拟的过程中,对于每个时间步,模型可计算出总的应变增量,总的应变增量包括黏性应变增量、弹性应变增量和塑性应变增量(Li et al., 2009; Luo and Liu, 2012):

|
(2) |
其中{}代表张量,对于黏弹性材料,本构方程可写成:

|
(3) |
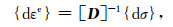
|
(4) |
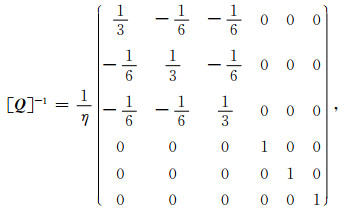
|
(5) |
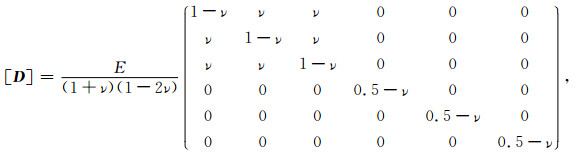
|
(6) |
其中[Q]和[D]分别为黏性和弹性的材料矩阵(公式(5)、(6));η为黏度系数,E为杨氏模量,ν为泊松比;σt为t时刻的应力;dσ为应力增量;dt为时间增量(Li et al., 2009; Luo and Liu, 2010, 2012).
采用塑性势函数(不相关塑性流动法则):

|
(7) |
塑性应变增量为:

|
(8) |
其中,dλ为塑性乘子,其与Drucker-Prager塑性屈服函数及塑性势函数等相关(Zienkiewicz and Taylor, 2005; Li et al., 2009).
本文采用二维黏弹塑性并行有限元程序模拟和研究了地壳岩石圈的变形和应力演化.使用本程序的研究也已在多个杂志中发表(Luo and Liu, 2009, 2010, 2012; Li and Liu, 2009),程序计算的可靠性已得到验证.根据Drucker-Prager屈服准则(Luo and Liu, 2010, 2012)来判断断层单元是否到达屈服,若达到屈服状态,即发生同震位错,当应力降低到预设的应力时地震结束.模拟采用的时间步长为1年,当发生地震时,时间步长变为1 s,地震结束时时间步长恢复为1年,进入下一次地震循环.关于地震及地震循环模拟的方法和详细过程可参考前人研究(Luo and Liu, 2010; 尹力等, 2018; 孙云强等, 2018).我们的所有模拟计算例子均在双CPU/28核的工作站上运行.
2 模拟结果本文首先模拟了无中下地壳流的算例在龙门山断层带大地震循环过程的短期的地壳地表变形分布及速度演化.然后,假设了中下地壳流可能存在的流动样式,模拟和探讨了其导致的龙门山断层带大地震循环过程的短期地壳地表变形及运动速度特征.最后,测试和分析了中下地壳流速度大小、中下地壳黏度、以及中下地壳流的范围(或中下地壳流长度)对模型结果的影响,并且根据已有的地形变数据约束模型结果,判断和评估是否存在中下地壳流以及可能存在的中下地壳流流动样式和速度.
2.1 无地壳流地震循环的变形分布模型算例1采用的边界条件为BC1(见图 2及表 2),即深度一致性速度边界.进入稳定加载阶段之后,选取一个地震循环进行变形分析.图 3显示了一个地震循环的应变、位移分布及其演化过程,其中箭头代表位移,底图为水平应变.图 4为一个地震循环的地表位移及其演化.

|
图 3 参考模型(算例1)模拟的一次地震循环过程中的位移(箭头)及水平应变εx(背景图)的模拟结果 (a)累积的震间位移及应变(4800yr);(b)同震时刻的位移及应变;(c)黏弹性松弛效应所产生累积的震后位移及应变(4800yr);(d)震间与同震位移与应变的叠加(图 3a与3b的叠加);(e)震间、同震与震后位移与应变的叠加(图 3a、3b和3c的叠加).其中白色实线为弹塑性上地壳的底边界;白色虚线为莫霍面;紫色实线为断层.此处压应变为负. Fig. 3 Results of the displacement (arrow) and horizontal strain εx (background) in one seismic cycle of the reference case (case 1) (a) Inter-seismic accumulated displacement and strain (4800yr); (b) Co-seismic displacement and strain; (c) Post-seismic accumulated displacement and strain due to viscoelastic stress relaxation (4800yr); (d) Inter-seismic and co-seismic displacement and strain (superimposition of (a) and (b)); (e) Inter-seismic, co-seismic and post-seismic displacement and strain (superimposition of (a), (b) and (c)). The white solid line represents the bottom boundary of the elastoplastic upper crust; the white dashed line represents the Moho; the purple solid line represents the fault. Compressive strain is negative. |

|
图 4 参考模型(算例1)模拟的一次地震循环过程中的地表位移及其演化 (a)震间、同震和震后3个阶段的水平位移;(b)震间、同震和震后3个阶段的垂向位移;(c)水平位移在地震循环3个阶段的演化;(d)垂向位移在地震循环3个阶段的演化. I代表震间;C代表同震;P代表震后;黑色虚线为断层地表出露位置;震间时间为4800年. Fig. 4 Surface displacement and its evolution in one seismic cycle predicted by case 1 (a) Inter-seismic, co-seismic and post-seismic horizontal displacement; (b) Inter-seismic, co-seismic and post-seismic vertical displacement; (c) Evolution of horizontal displacement in one seismic cycle; (d) Evolution of vertical displacement in one seismic cycle. I: inter-seismic period; C: co-seismic instant; P: post-seismic period. Black dashed line is location of the Longmen Shan fault. The inter-seismic period is 4800 years. |
模拟的应变结果显示在震间加载阶段整个模型区域处于挤压状态,且青藏东部的变形大于四川盆地(图 3a和4a);模拟的震间位移显示青藏东部中下地壳与上地壳及上地幔不存在明显的变形差异(图 3a),此时无中下地壳的差异性流动;青藏东部应变分布较均匀(图 3a和4a),地表产生整体均匀抬升,龙门山断层西侧产生微小的凸状隆起(图 4b浅灰线).
一个MW 7.9地震发生时,龙门山断层两侧发生相对错动,同震应变与位移分布局限于龙门山断层及其附近区域(图 3b).地表同震位移(图 4a、4b灰线)显示,同震时刻断层两侧发生位错,龙门山西侧发生显著垂向抬升,而四川盆地基本不抬升,与GPS和水准测量得到的同震地表变形(Shen et al., 2009; 王庆良等, 2008)具有相似的变形样式.地震使得龙门山断层附近的上地壳产生剧烈的同震拉张应变,震间累积的弹性应变被大大释放(图 3b).
在震后阶段,由于青藏东部中下地壳的黏弹性应力松弛效应,青藏东部上地壳继续向东侧移动(图 3c).震后水平地表位移显示(图 4a黑线)整个青藏东部继续向东移动,而垂向位移显示(图 4b黑线)龙门山西侧附近继续抬升.这种震后黏弹性松弛效应导致的地表位移样式是与汶川大地震发生之后的对地观测数据相一致的(Zhao et al., 2015; Rui and Stamps, 2016).震后黏弹性松弛效应导致的变形和位移可以发生在青藏东部比其同震变形区更大的区域内(比较图 3b和3c),而震后松弛的变形速率依赖于中下地壳及上地幔的黏度大小(Klotz et al., 2001; Hu et al., 2004; 尹力等, 2018).
经过一个地震循环,模型总的变形青藏东部较四川盆地更大,且青藏东部中下地壳近龙门山地区产生了明显的应变集中(见图 3e深蓝色).同样地,一个地震循环后,青藏东部产生较大的水平缩短(图 4c),造成了显著的垂向抬升(图 4d);而四川盆地由于力学强度大及黏度高(硬块),缩短量较小,垂直抬升相对较小(图 4c与图 4d);模型的整体缩短由断层位错吸收了大部分(图 4c),而垂向变形或抬升主要发生在龙门山断层带西侧附近及整个青藏东部(图 4d).图中可以看出,一个地震循环之后,龙门山断层带西侧附近区域比青藏东部产生了更大的抬升(见图 4d黑色曲线),这是由于地震位错导致的龙门山断层抬升(同震变形)(对比图 4d的浅灰色和灰色曲线)及震后的黏弹性松弛(震后变形)(对比图 4d的黑色和灰色曲线)共同作用的结果.
2.2 中下地壳流的地震循环的变形分布模型算例2采用的边界条件为BC2(见图 2及表 2),即随深度变化的速度边界;中下地壳流的长度L为150 km(见图 2及表 2).图 5显示了存在这种中下地壳流动的情况下一个地震循环的应变及位移分布.图 6为对应的地表位移的分布及演化.中下地壳与上地壳及岩石圈地幔存在差异性流动,在地壳流的前端(距离左边界150~250 km处)出现了显著的应变集中(图 5a);此时中下地壳物质在龙门山下方产生堆积,相对无地壳流的情况产生了更大的变形(对比图 5a和3a),从而产生了凸状隆起.通过对比有、无地壳流的同震及震后变形(图 3b、3c、5b、5c),发现两者在变形样式上并没有太大的区别,且地表位移曲线(图 4a、4b、6a、6b)也表现出相同的变形样式,但在震间的垂向位移上(图 4b、6b浅灰色曲线)存在较大差异.这是因为,同震瞬间是弹性变形,而震后中下地壳的黏弹性应力松弛效应是与地震导致的应力变化相关,这两者导致的变形都与中下地壳流动无关;而震间构造作用与中下地壳流动密切相关.

|
图 5 有地壳流(算例2)模拟的一次地震循环过程中的位移(箭头)及水平应变(背景图)的模拟结果 (a)累积的震间位移及应变(3000yr);(b)同震时刻的位移及应变;(c)黏弹性松弛效应所产生累积的震后位移及应变(3000yr);(d) 图 4a与4b应变与位移的叠加;(e) 图 4a、4b和4c应变与位移的叠加.其中白色实线为弹塑性上地壳的底边界;白色虚线为莫霍面;紫色实线为断层.此处压应变为负. Fig. 5 Results of the displacement (arrow) and horizontal strain εx (background) in one seismic cycle of the crust flow case (case 2) (a) Inter-seismic accumulated displacement and strain (3000yr); (b) Co-seismic displacement and strain; (c) Post-seismic accumulated displacement and strain due to viscoelastic stress relaxation (3000yr); (d) Inter-seismic and co-seismic displacement and strain (superimposition of (a) and (b)); (e) Inter-seismic, co-seismic and post-seismic displacement and strain (superimposition of (a), (b) and (c)). The white solid line represents the bottom boundary of the elastoplastic upper crust; the white dashed line represents the Moho; the purple solid line represents the fault. Compressive strain is negative. |

|
图 6 有地壳流(算例2)模拟的一次地震循环过程中的地表位移及其演化 (a)震间、同震和震后3个阶段的水平位移;(b)震间、同震和震后3个阶段的垂向位移;(c)水平位移在地震循环3个阶段的演化;(d)垂向位移在地震循环3个阶段的演化. I代表震间;C代表同震;P代表震后.黑色虚线为断层地表出露位置.震间时间为3000年. Fig. 6 Surface displacement and its evolution in one seismic cycle predicted by case 2 (a) Inter-seismic, co-seismic and post-seismic horizontal displacement; (b) Inter-seismic, co-seismic and post-seismic vertical displacement; (c) Evolution of horizontal displacement in one seismic cycle; (d) Evolution of vertical displacement in one seismic cycle. I: inter-seismic period; C: co-seismic instant; P: post-seismic period. Black dashed line is location of the Longmen Shan fault. The inter- seismic period is 3000 years. |
为了能够更好地探讨有、无地壳流的地壳变形差异,并与现今地形变观测数据作对比,文中提取了算例1与算例2的龙门山断层带大地震前十年和震后十年的平均地表运动速度以及同震变形分布(图 7).从图中可以观察到,震间地表水平速度存在微小差异:有地壳流的震间地表水平速度在龙门山断层西侧附近下降较大(即斜率较大)(对比图 7a中的红色实线和虚线),因此其水平变形在这里更加相对集中.但是,震间地表垂向速度在变形样式及数值上存在较大差异:在有地壳流的情况下,其垂向速度在龙门山断层西侧附近出现较大的凸状隆起(对比图 7a中的绿色实线和虚线).而震后地表变形(图 7b)及同震变形(图 7c)在变形样式和特征上无显著差异.

|
图 7 有与无中下地壳流(算例2与算例1)情况下的一次地震循环不同阶段的地表速度及位移对比 (a)震间地表速度;(b)震后地表速度;(c)同震地表位移曲线.红线代表水平速度;绿线代表垂向速度;实线为模型1的模拟结果;虚线为模型2的模拟结果.黑色虚线为断层地表出露位置. Fig. 7 Comparison of surface velocity and displacement at different stages of one seismic cycle between case 2 and case 1 (a) Inter-seismic velocity on the surface; (b) Post-seismic velocity on the surface; (c) Co-seismic displacement on the surface. The red curves show the horizontal velocity. The green curves show the vertical velocity. The solid curves are the model results from case 1. The dashed curves are the model results from case 2. Black dashed lines show the location of the Longmen Shan fault on the surface. |
中下地壳流的存在对震间变形影响较大(图 7a),因此,本文后面主要分析和对比了不同的中下地壳流流动样式和特征对地壳震间变形的影响.文中首先分析了不同的中下地壳流流动速度对模型结果的影响(见图 2及表 2).
对于青藏东部中下地壳的流动速度问题,不同的学者给出了不同的结果.Clark等(2005)认为青藏东缘低黏度的下地壳流动速度约为80 mm·a-1;而Cao等(2009)通过模拟结果表明下地壳的流动速度比地表速度大~8 mm·a-1.本文进行了3个模型算例测试(见表 2,模型算例2-4),从而探讨中下地壳流流速对地壳地表变形的影响.
随着中下地壳流流速的增大,在龙门山断层西侧附近水平速度也略微增加,但变化不明显(图 8a);而垂向抬升速度在龙门山断层西侧显著地逐渐增加,产生越来越大的凸状隆起(图 8b).这是因为当物质流速越大时,单位时间内流入的物质就越多,从而会在龙门山断层西侧的青藏东部产生更大的抬升速率.

|
图 8 不同地壳流动速度的模型算例(算例1、2-4)的地表变形速度对比 (a)水平地表速度;(b)垂向地表速度.case 1:参考模型, BC1; case 2: Vmax=10 mm·a-1; case 3: Vmax=5 mm·a-1; case 4: Vmax=20 mm·a-1.垂向黑色虚线为断层地表出露位置. Fig. 8 Comparison of surface velocity between different cases with different crust flow velocity (case 1, 2-4) (a) Horizontal velocity on the surface; (b) Vertical velocity on the surface. case 1: Reference model, BC1; case 2: Vmax=10 mm·a-1; case 3: Vmax=5 mm·a-1; case 4: Vmax=20 mm·a-1. Vertical black dashed lines show the location of the Longmen Shan fault on the surface. |
模型结果中左侧边界附近地表出现垂向速度的下降(图 8b黑色实线),这是模型左侧边界条件导致的边界效应.由于受到中下地壳流边界条件的影响,左侧边界附近的中下地壳物质向右侧运动,对上地壳产生拖曳,而且我们的模型为平面应变,没有第三维方向物质的进出,因此左侧存在物质的净亏损,且中下地壳流速越大物质的净亏损也越大,从而造成左侧边界附近地表出现垂向下降.而现实情况,中下地壳物质的流动可以是从青藏内部持续向东流动的,模型左侧边界附近存在由青藏内部物质向东流入的补充,因而大地水准测量数据显示龙门山断层西侧远处仍是抬升(图 1d),而不是模型显示的呈现下降的结果(图 8b黑色实线).这种边界效应会影响模型的边界附近,而不会对我们关注的模型内部的龙门山断层带附近产生影响.
2.4 中下地壳流的黏度η的影响本文随后分析了不同的中下地壳流黏度对模型结果的影响(见图 2及表 2).许多研究使用不同的方法给出了青藏高原中下地壳的黏度范围,但都处于1018~1021Pa·s范围之内(石耀霖和曹建玲, 2008; Godard et al., 2009; Clark et al., 2005; Cao et al., 2009).我们进行了4个模型算例(见表 2中的模型算例2、5、6、7),对青藏东部中下地壳分别使用了该范围内的黏度值(表 2),探讨中下地壳黏度对地壳地表变形的影响.
从地表水平速度上看(图 9a),当中下地壳黏度较低时(<~1.0×10²¹ Pa·s),水平变形速率及垂向变形速率随着黏度的增加并没有显著增加;而当黏度较高时(>~1.0×10²¹Pa·s)(见表 2的case 7),青藏东部的地表水平速度显著增加.这是因为中下地壳黏度低时,中下地壳与上地壳解耦度越高,上地壳主要受构造挤压作用产生变形.当中下地壳黏度大时,中下地壳与上地壳的耦合程度增加,中下地壳的快速流动拖曳上地壳发生明显的水平运动,因此上地壳及地表的水平速度增加.并且当中下地壳黏度变大时,青藏东缘与四川盆地的黏度差异变小,导致四川盆地内部的水平变形速率增大.垂向变形速率表现出同样的特点,从图 9b中可以看出青藏东部中下地壳黏度变大时,四川盆地发生相对较大的整体抬升;此外,中下地壳的拖曳作用导致青藏东部西侧区域上地壳产生拉张而在地表产生沉降,黏度越大时耦合性越强下降就会越明显.我们的研究结果表明中下地壳的黏度对地表变形存在重要的影响,中下地壳黏度越大则与上地壳的耦合程度越高.较大黏度情况下,中下地壳可能不会发生快速的差异性流动.

|
图 9 不同中下地壳黏度ηml的模型算例(算例1、2、5-7)的地表速度对比 (a)水平地表速度;(b)垂向地表速度.case 1:参考模型, ηml=7.0×10¹⁹Pa·s; case 2: ηml=7.0×10¹⁹Pa·s; case 5: ηml= 7.0×10¹⁸Pa·s; case 6: ηml=7.0×10²⁰Pa·s; case 7: ηml= 7.0×10²¹Pa·s.垂向黑色虚线为断层地表出露位置. Fig. 9 Comparison of surface velocity between different cases with different middle-lower crust viscosity ηml (case 1, 2, 5-7) (a) Horizontal velocity on the surface; (b) Vertical velocity on the surface. case 1: Reference model, ηml=7.0×10¹⁹Pa·s; case 2: ηml=7.0×10¹⁹Pa·s; case 5: ηml=7.0×10¹⁸Pa·s; case 6: ηml=7.0×10²⁰Pa·s; case 7: ηml=7.0×10²¹Pa·s. Vertical black dashed lines show the location of the Longmen Shan fault on the surface. |
Clark和Royden(2000)给出了均匀地壳的流速与黏度的关系公式,显示流动速度和黏度成反比关系,表明物质黏度越大越不容易发生流动.通过对比本文对黏度的测试结果(图 9a和9b)及前人研究结果(Clark and Royden, 2000; Clark et al., 2005; Cao et al., 2009),认为若存在中下地壳流,青藏东部的中下地壳黏度应小于1021Pa·s.根据本文的研究,以及前人的研究包括对震间和震后速度场与变形场的研究(Zhu and Zhang., 2013;柳畅等, 2014; 尹力等, 2018),本文偏向认为青藏东部中下地壳黏度约为~1019Pa·s比较合适,此时中下地壳与上地壳及地幔存在弱耦合的关系.
2.5 中下地壳流的流动距离L的影响本文最后分析了不同的中下地壳流流动距离L对模型结果的影响(见表 2).文中进行了3个模型算例测试(见表 2,算例2、8、9),探讨中下地壳流的流动距离对地壳地表变形的影响.
随着中下地壳流的流动距离从左侧边界向模型内部的增加,地表水平速度的变化不明显(图 10a),而最大垂向抬升速度的位置发生了明显的右移(凸状隆起位置右移)(图 10b).正如图 5a所示,地表垂向抬升速度最大位置处于地壳流的前缘;而中下地壳物质在地壳流的前缘产生堆积,导致地壳的增厚与抬升,以及地表的这种凸状隆起.

|
图 10 不同中下地壳流动距离L的模型算例(算例1、2、8、9)的地表速度对比 (a)地表水平速度; (b)地表垂向速度.case 1:参考模型; case 2: L=50 km; case 8: L=150 km; case 9: L=250 km.垂向黑色虚线为断层地表出露位置. Fig. 10 Comparison of surface velocity between different cases with different range length L of middle-lower crust flow (case 1, 2, 8, 9) (a) Horizontal velocity on the surface; (b) Vertical velocity on the surface. case 1: Reference model; case 2: L=50 km; case 8: L=150 km; case 9: L=250 km. Vertical black dashed lines show the location of the Longmen Shan fault on the surface. |
青藏高原东缘的造山机制目前仍处于争论之中.对于两种造山机制:地壳缩短造山与中下地壳流造山,仍不清楚哪一种机制是主控机制.对于中下地壳流造山机制,其韧性的中下地壳对上地壳及上地幔作用产生变形的动力机理,也一直是青藏高原东缘造山的一个重要问题.
目前,仍不清楚中下地壳的运动状态,比如是否存在中下地壳流;若存在中下地壳流,其流动速度、流动范围(流动通道厚度与宽度)为多少.因此,本文建立了一个有限元模型,研究了不同的中下地壳流流动样式会造成怎样的地壳地表变形及运动;并且,使用近年来的地形变观测数据约束模型,进而分析和探讨当前可能存在的青藏高原东缘中下地壳流动样式.
本研究中,有与无中下地壳流的模型算例(算例2与1)显示了震间地表垂向速度及变形存在显著差异;虽然两者均显示在龙门山西侧附近会出现凸状隆起,但有中下地壳流的模型显示的凸状隆起十分显著(图 7a).无中下地壳流的模型显示青藏东部与四川盆地的垂向差异抬升速率~0.6 mm·a-1(图 7a绿色实线),显著小于大地水准测量得到的垂向差异速率1~4 mm·a-1(图 1d);此时,青藏东部的抬升主要是由青藏东部岩石圈整体的缩短增厚所导致.而有中下地壳流的模型(算例2~4)结果显示,当地壳流的速度为5~20 mm·a-1时,得到的垂向差异抬升速率为1~3 mm·a-1(图 8b)和大地水准测量数据显示的垂向差异抬升速率(图 1d)相近;此时,龙门山西侧的凸状隆起主要是由中下地壳物质的堆积所造成.因此,通过对比本研究模拟的震间垂向变形速率与大地水准测量观测数据,中下地壳流的隆升机制似乎更占优势.
存在地壳流的情况下,通过模拟发现,中下地壳流不同的流动范围或流动长度影响地表垂向最大抬升速率的位置(图 10b),随着中下地壳流的流动范围逐渐向四川盆地扩展,地表垂向最大变形前缘(凸状隆起)逐渐向四川盆地的方向移动.因此,根据近十年的地表垂向变形速率样式(图 1e),以及地球物理探测数据得出的低速、低阻及高热流的物质分布范围,本文认为中下地壳流是可能存在的,并且青藏东缘中下地壳流的流动范围也许已经从青藏中部扩展至龙门山下方,并且地壳流在向东流动的过程中,由于受到四川盆地的阻挡,其流速由西向东逐渐下降,导致物质的堆积并产生垂向抬升.
中下地壳的黏度是研究青藏东缘深部动力学十分重要的问题.物质黏度受许多因素的影响,比如,温度、压力、应力应变等等;而中下地壳流动速度也与黏度、通道厚度、横向压力等等因素有关.本文中下地壳不同黏度的模型算例显示,随着黏度的增大,地表的水平速度随之增加(图 9a),说明地表水平速度和中下地壳物质的差异性运动就会越小.这些结果说明当黏度越大时,岩石圈各分层的耦合性就越强,中下地壳物质越不易发生流动.综合本文研究以及前人研究(Zhu and Zhang., 2013;柳畅等, 2014; 尹力等, 2018),我们偏向认为青藏东部中下地壳黏度为~1019Pa·s比较合适.在此黏度值的情况下,中下地壳与上地壳及岩石圈地幔的耦合程度较低;当中下地壳流流速为10~20 mm·a-1时,得到的垂向差异抬升速率为1~3 mm·a-1(图 8b)和大地水准测量数据显示的垂向差异抬升速率(图 1d)相近.
虽然,有中下地壳流的模型结果与现今观测的地表变形吻合更好,但是根据Zhu和Zhang(2013)的研究,其模型中不存在中下地壳流,也能得到与观测数据拟合较好的垂向变形速率.在他们的研究中,龙门山西侧的凸状隆起是由于该部分较软的中下地壳及更深的地幔物质受到构造挤压作用产生缩短增厚所造成(Zhu and Zhang, 2013).这说明地壳或岩石圈缩短,在合适的黏度结构下,也可能导致地形变观测到的地表垂向抬升速率样式和大小.另外,大地水准测量等地形变数据由于存在较大误差,不能很好约束中下地壳运动状态(包括有无中下地壳流;若有中下地壳流,其流动样式和速度大小).因此,本文认为仅根据目前的地形变观测数据仍不能准确判断和决定是否存在中下地壳流及其可能的流动样式与速度.为了能够准确判断中下地壳流是否存在,以及其流动样式、流动速度和流动范围,我们需要更密集的、更准确的及更长期的地形变观测数据.
本文采用了线性的Maxwell黏弹性体来模拟中下地壳,其黏度值是不随应力应变而变化的.而地震会导致断层附近的中下地壳的应力发生较大变化;这种应力变化会影响中下地壳的黏度.本文的模型并没有模拟上述过程.温度也与物质黏度直接相关,由于本文模拟的是数万年的地震循环过程,时间尺度相对较短,因此,也没有考虑温度变化对黏度的影响.本文建立的二维有限元模型对于解释三维情况下的地壳流动受到限制:不能模拟和解释侧向水平流动的情况及变形样式.在未来的研究中,可以考虑建立三维模型,考虑地壳流的侧向水平流动,因此,这种限制可以在未来的研究中查明,但是,在本文中探索这种限制超出了本文的研究目的.此外,岩石圈拆沉作用也可能是造山隆升的一个重要因素,Yi等(2016)通过模拟并利用地表观测及重力数据进行约束,给出了有无岩石圈拆沉情况下不同的地壳流流速.而本文并没有模拟和探讨岩石圈拆沉对地壳流流动速度的影响.
在此强调本文的模型没有模拟大变形的长期地质造山过程(柳畅等, 2014; Chen et al., 2013),也没有模拟中下地壳流的驱动力及动力学过程(Clark and Royden, 2000; 王晓芳和何建坤, 2012).我们模拟了有与无中下地壳流情况下短期的地壳地表变形样式和运动速度.并假设了中下地壳流的流动样式和流动速度,从而模拟和分析了其导致的地震循环过程的短期地壳地表变形及运动速度特征;然后再使用已有的地形变数据约束模型结果,从而判断和评价是否存在中下地壳流以及可能存在的中下地壳流流动样式和速度.本文的研究结果对于使用地形变数据去探讨和约束青藏东缘龙门山断层带附近的中下地壳运动状态具有重要意义.本文对于青藏东北缘的六盘山断层附近可能存在的中下地壳流及其导致的地壳地表变形,也有重要的启示作用和意义.
4 结论本文构建和使用了一个黏弹塑性有限元模型来研究不同的中下地壳运动状态导致的地壳地表变形和运动,分析了无中下地壳流的地壳地表变形及速度.并假设了中下地壳流的流动样式和速度,模拟和探讨了其导致的地震循环过程的短期地壳地表变形及运动速度特征.本文使用已有的地形变数据约束模型结果,从而判断和评估是否存在中下地壳流以及可能存在的中下地壳流流动样式和速度.最终得出以下结论:
(1) 模拟结果给出了有、无地壳流的一个地震循环过程不同阶段的位移、速度及其演化.震间加载阶段青藏东部相对于西川盆地产生较大的震间变形;同震时刻断层两侧发生相向错动,同震位移分布局限于龙门山断层及其附近区域;震后由于中下地壳的黏弹性松弛效应,青藏东部中上地壳继续回弹向右侧移动;经过一个地震循环之后,模型总的变形青藏东部较四川盆地更大,断层附近积累的应变被释放,且青藏东部中下地壳近龙门山地区产生了明显的应变集中.
(2) 通过对比有和无(算例2、1)中下地壳流的模拟结果,发现震间的地表垂向速度在变形样式及数值上存在较大差异.青藏东部地表变形显示,存在地壳流的地表垂向抬升速率显著大于无地壳流的情况.
(3) 模拟给出了存在中下地壳流时不同的流动状态对地表位移的影响.震间期出现的在龙门山断层西侧附近的垂向凸状隆起随中下地壳流的速度、黏度及通道长度的变化而变化.中下地壳流速度越大、这种垂向隆起越强烈;而中下地壳流流动长度越大,这种垂向凸状隆起的位置距离龙门山断层带就越近;中下地壳黏度越大,中下地壳与上地壳及地幔的耦合性就越强.
(4) 根据现有的地形变数据,很难直接判断青藏东部龙门山断层带附近中下地壳流是否存在.但是,随着本研究区地形变数据越来越多,其精度和密度越来越高,可以更好地约束模型结果,因此,本文的研究为判断中下地壳流是否存在,以及评估其流动样式和流动速度提供了一种方法.
致谢 感谢两位匿名审稿专家的宝贵意见.
Avouac J P, Tapponnier P. 1993. Kinematic model of active deformation in central Asia. Geophysical Research Letters, 20(10): 895-898. DOI:10.1029/93GL00128 |
Bai D H, Unsworth M J, Meju M A, et al. 2010. Crustal deformation of the eastern Tibetan plateau revealed by magnetotelluric imaging. Nature Geoscience, 3(5): 358-362. DOI:10.1038/ngeo830 |
Bendick R, Flesch L. 2007. Reconciling lithospheric deformation and lower crustal flow beneath central Tibet. Geology, 35(10): 895-898. DOI:10.1130/G23714A.1 |
Bird P. 1991. Lateral extrusion of lower crust from under high topography in the isostatic limit. Journal of Geophysical Research, 96(B6): 10275-10286. DOI:10.1029/91JB00370 |
Brown L D, Zhao W J, Nelson K D, et al. 1996. Bright spots, structure, and magmatism in Southern Tibet from INDEPTH seismic reflection profiling. Science, 274(5293): 1688-1690. DOI:10.1126/science.274.5293.1688 |
Burchfiel B C, Chen Z L, Liu Y P, et al. 1995. Tectonics of the Longmen Shan and Adjacent Regions, Central China. International Geology Review, 37(8): 661-735. DOI:10.1080/00206819509465424 |
Burchfiel B C, Royden L H, Van Der Hilst R D, et al. 2008. A geological and geophysical context for the Wenchuan earthquake of 12 May 2008, Sichuan, People's Republic of China. GSA Today, 18(7): 4-11. DOI:10.1130/GSATG18A.1 |
Cao J L, Shi Y L, Zhang H, et al. 2009. Numerical simulation of GPS observed clockwise rotation around the eastern Himalayan syntax in the Tibetan Plateau. Chinese Science Bulletin, 54(8): 1398-1410. |
Chéry J, Zoback M D, Hassani R. 2001. An integrated mechanical model of the San Andreas fault in central and northern California. Journal of Geophysical Research:Solid Earth, 106(B10): 22051-22066. DOI:10.1029/2001JB000382 |
Chen J H, Liu Q Y, Li S C, et al. 2009. Seismotectonic study by relocation of the Wenchuan MS8.0 earthquake sequence. Chinese Journal of Geophysics (in Chinese), 52(2): 390-397. DOI:10.1002/cjg2.v52.2 |
Chen L, Taras V G, Zhang Z J, et al. 2013. Formation mechanism of steep convergent intracontinental margins:Insights from numerical modeling. Geophysical Research Letters, 40(10): 2000-2005. DOI:10.1002/grl.50446 |
Chen L, Fredrik B, Zhang Z J, et al. 2014. Seismically constrained thermo-rheological structure of the eastern Tibetan margin:Implication for lithospheric delamination. Tectonophysics, 627: 122-134. DOI:10.1016/j.tecto.2013.11.005 |
Chen Y T, Yang Z X, Zhang Y, et al. 2013. From 2008 Wenchuan earthquake to 2013 Lushan earthquake. Scientia Sinica Terrae (in Chinese), 43(6): 1064-1072. |
Clark M K, Royden L H. 2000. Topographic ooze:Building the eastern margin of Tibet by lower crustal flow. Geology, 28(8): 703-706. DOI:10.1130/0091-7613(2000)28<703:TOBTEM>2.0.CO;2 |
Clark M K, Bush J W M, Royden L H. 2005. Dynamic topography produced by lower crustal flow against rheological strength heterogeneities bordering the Tibetan Plateau. Geophysical Journal International, 162(2): 575-590. DOI:10.1111/gji.2005.162.issue-2 |
Cook K L, Royden L H. 2008. The role of crustal strength variations in shaping orogenic plateaus, with application to Tibet. Journal of Geophysical Research:Solid Earth, 113(B8): B08407. DOI:10.1029/2007JB005457 |
Fu B H, Shi P L, Guo H D, et al. 2011. Surface deformation related to the 2008 Wenchuan earthquake, and mountain building of the Longmen Shan, eastern Tibetan Plateau. Journal of Asian Earth Sciences, 40(4): 805-824. DOI:10.1016/j.jseaes.2010.11.011 |
Fu R S, Huang J H, Li L G, et al. 2000. Numerical simulation of the three-step uplift model of the Tibet plateau. Earth Science Frontiers (in Chinese), 7(4): 588-596. |
Gan W J, Zhang P Z, Shen Z K, et al. 2007. Present-day crustal motion within the Tibetan Plateau inferred from GPS measurements. Journal of Geophysical Research:Solid Earth, 112(B8): B08416. DOI:10.1029/2005JB004120 |
Godard V, Cattin R, Lavé J. 2009. Erosional control on the dynamics of low-convergence rate continental plateau margins. Geophysical Journal International, 179(2): 763-777. DOI:10.1111/gji.2009.179.issue-2 |
Guo X Y, Gao R, Keller G R, et al. 2013. Imaging the crustal structure beneath the eastern Tibetan Plateau and implications for the uplift of the Longmen Shan range. Earth and Planetary Science Letters, 379: 72-80. DOI:10.1016/j.epsl.2013.08.005 |
Hao M, Wang Q L, Shen Z K, et al. 2014. Present day crustal vertical movement inferred from precise leveling data in eastern margin of Tibetan Plateau. Tectonophysics, 632: 281-292. DOI:10.1016/j.tecto.2014.06.016 |
Harrison T M, Copeland P, Kidd W S F, et al. 1992. Raising Tibet. Science, 255(5052): 1663-1670. DOI:10.1126/science.255.5052.1663 |
He J K, Lu S J, Wang W M. 2013. Three-dimensional mechanical modeling of the GPS velocity field around the northeastern Tibetan plateau and surrounding regions. Tectonophysics, 584: 257-266. DOI:10.1016/j.tecto.2012.03.025 |
Holbig E S, Grove T L. 2008. Mantle melting beneath the Tibetan Plateau:Experimental constraints on ultrapotassic magmatism. Journal of Geophysical Research:Solid Earth, 113(B4): B04210. DOI:10.1029/2007JB005149 |
Hu S B, He L J, Wang J Y. 2000. Heat flow in the continental area of China:A new data set. Earth and Planetary Science Letters, 179(2): 407-419. DOI:10.1016/S0012-821X(00)00126-6 |
Hu Y K, Wang J, He J, et al. 2004. Three-dimensional viscoelastic finite element model for postseismic deformation of the great 1960 Chile earthquake. Journal of Geophysical Research:Solid Earth, 109(B12): B12403. DOI:10.1029/2004JB003163 |
Huang L Y, Zhang B, Cheng H H, et al. 2017a. The co-seismic effect of the 2015 Chile Illapel MW8.3 earthquake and its effect on seismic risk of South America. Chinese Journal of Geophysics (in Chinese), 60(1): 163-173. DOI:10.6038/cjg20170114 |
Huang L Y, Zhang B, Qu W L, et al. 2017b. The co-seismic effects of 2010 Maule earthquake. Chinese Journal of Geophysics (in Chinese), 60(3): 972-984. DOI:10.6038/cjg20170312 |
Huang Y, Wu J P, Zhang T Z, et al. 2008. Relocation of the M8.0 Wenchuan earthquake and its aftershock sequence. Science in China Series D:Earth Sciences, 51(12): 1703-1711. DOI:10.1007/s11430-008-0135-z |
Hubbard J, Shaw J H. 2009. Uplift of the Longmen Shan and Tibetan plateau, and the 2008 Wenchuan (M=7.9) earthquake. Nature, 457(7235): 194-197. |
Hubbard J, Shaw J H, Klinger Y. 2010. Structural setting of the 2008 MW7.9 Wenchuan, China, Earthquake. Bulletin of the Seismological Society of America, 100(5B): 2713-2735. DOI:10.1785/0120090341 |
Jia D, Wei G Q, Chen Z X, et al. 2006. Longmen Shan fold-thrust belt and its relation to the western Sichuan Basin in central China:New insights from hydrocarbon exploration. AAPG Bulletin, 90(9): 1425-1447. DOI:10.1306/03230605076 |
Jia D, Li Y Q, Lin A M, et al. 2010. Structural model of 2008 MW7.9 Wenchuan earthquake in the rejuvenated Longmen Shan thrust belt, China. Tectonophysics, 491(1-4): 174-184. DOI:10.1016/j.tecto.2009.08.040 |
Kirby E, Reiners P W, Krol M A, et al. 2002. Late Cenozoic evolution of the eastern margin of the Tibetan Plateau:Inferences from 40Ar/39Ar and (U-Th)/He thermochronology. Tectonics, 21(1): 1001. DOI:10.1029/2000TC001246 |
Kirby E, Whipple K X, Tang W Q, et al. 2003. Distribution of active rock uplift along the eastern margin of the Tibetan Plateau:Inferences from bedrock channel longitudinal profiles. Journal of Geophysical Research:Solid Earth, 108(B4): 2217. DOI:10.1029/2001JB000861 |
Kirby E, Whipple K, Harkins N. 2008. Topography reveals seismic hazard. Nature Geoscience, 1(8): 485-487. DOI:10.1038/ngeo265 |
Klotz J G. Khazaradze D, Angermann C, et al. 2001. Earthquake cycle dominates contemporary crustal deformation in central and southern Andes. Earth and Planetary Science Letters, 193(3-4): 437-446. DOI:10.1016/S0012-821X(01)00532-5 |
Li J J, Wen S X, Zhang Q S, et al. 1979. A discussion on the period, amplitude and type of the uplift of the Qinghai-Xizang plateau. Scientia Sinica, 22(11): 1314-1328. |
Li Q S, Liu M. 2006. Geometrical impact of the San Andreas fault on stress and seismicity in California. Geophysical Research Letters, 33(8): L08302. DOI:10.1029/2005GL025661 |
Li Q S, Liu M, Zhang H. 2009. A 3-D viscoelastoplastic model for simulating long-term slip on non-planar faults. Geophysical Journal International, 176(1): 293-306. DOI:10.1111/gji.2008.176.issue-1 |
Li S H, Unsworth M J, Booker J R, et al. 2003. Partial melt or aqueous fluid in the mid-crust of Southern Tibet? Constraints from INDEPTH magnetotelluric data. Geophysical Journal International, 153(2): 289-304. DOI:10.1046/j.1365-246X.2003.01850.x |
Liu C, Zhu B J, Shi Y L. 2012. Stress accumulation of the Longmenshan fault and recurrence interval of Wenchuan earthquake based on viscoelasticity simulation. Acta Geologica Sinica (in Chinese), 86(1): 157-169. |
Liu C, Shi Y L, Zhu B J, et al. 2014. Crustal rheology control on the mechanism of the earthquake generation at the Longmen Shan fault. Chinese Journal of Geophysics (in Chinese), 57(2): 404-418. DOI:10.6038/cjg20140207 |
Liu C, Zhu B J, Yang X L. 2015. How does crustal shortening contribute to the uplift of the eastern margin of the Tibetan Plateau?. Journal of Asian Earth Sciences, 98: 18-25. DOI:10.1016/j.jseaes.2014.10.037 |
Liu Q, Li Y, Chen J, et al. 2009. Wenchuan MS8.0 earthquake:preliminary study of the S-wave velocity structure of the crust and upper mantle. Chinese Journal of Geophysics (in Chinese), 52(2): 309-319. |
Liu Q X, Zhu J S, Cao J X, et al. 2010. Relocation of the Wenchuan MS8.0 earthquake sequence and its aftershocks and their spatial distribution characteristics. Quaternary Sciences (in Chinese), 30(4): 736-744. |
Liu-Zeng J, Zhang Z, Wen L, et al. 2009a. Co-seismic ruptures of the 12 May 2008, MS8.0 Wenchuan earthquake, Sichuan:East-west crustal shortening on oblique, parallel thrusts along the eastern edge of Tibet. Earth and Planetary Science Letters, 286(3-4): 355-370. DOI:10.1016/j.epsl.2009.07.017 |
Luo G, Liu M. 2009. How does trench coupling lead to mountain building in the Subandes? A viscoelastoplastic finite element model. Journal of Geophysical Research, 114(B3): B03409. DOI:10.1029/2008JB005861 |
Luo G, Liu M. 2010. Stress evolution and fault interactions before and after the 2008 Great Wenchuan earthquake. Tectonophysics, 491(1-4): 127-140. DOI:10.1016/j.tecto.2009.12.019 |
Luo G, Liu M. 2012. Multi-timescale mechanical coupling between the San Jacinto fault and the San Andreas fault, southern California. Lithosphere, 4(3): 221-229. DOI:10.1130/L180.1 |
Mercier J L, Armijo R, Tapponnier P, et al. 1987. Change from late Tertiary compression to Quaternary extension in Southern Tibet during the India-Asia collision. Tectonics, 6(3): 275-304. DOI:10.1029/TC006i003p00275 |
Nelson K D, Zhao W J, Brown L D, et al. 1996. Partially molten middle crust beneath southern Tibet:Synthesis of project INDEPTH results. Science, 274(5293): 1684-1688. DOI:10.1126/science.274.5293.1684 |
Robert A, Zhu J, Vergne J, et al. 2010. Crustal structures in the area of the 2008 Sichuan earthquake from seismologic and gravimetric data. Tectonophysics, 491(1-4): 205-210. DOI:10.1016/j.tecto.2009.11.010 |
Royden L H, Burchfiel B C, King R W, et al. 1997. Surface deformation and lower crustal flow in eastern Tibet. Science, 276(5313): 788-790. DOI:10.1126/science.276.5313.788 |
Royden L H, Burchfiel B C, Van Der Hilst R D. 2008. The geological evolution of the Tibetan Plateau. Science, 321(5892): 1054-1058. DOI:10.1126/science.1155371 |
Rui X, Stamps D S. 2016. Present-day kinematics of the eastern Tibetan Plateau and Sichuan Basin:Implications for lower crustal rheology. Journal of Geophysical Research:Solid Earth, 121(5): 3846-3866. DOI:10.1002/2016JB012839 |
Shen Z K, Lv J N, Wang M, et al. 2005. Contemporary crustal deformation around the southeast borderland of the Tibetan Plateau. Journal of Geophysical Research:Solid Earth, 110(B11): B11409. DOI:10.1029/2004JB003421 |
Shen Z K, Sun J B, Zhang P Z, et al. 2009. Slip maxima at fault junctions and rupturing of barriers during the 2008 Wenchuan earthquake. Nature Geoscience, 2(10): 718-724. DOI:10.1038/ngeo636 |
Shi Y L, Cao J L. 2008. Effective viscosity of China continental lithosphere. Earth Science Frontiers (in Chinese), 15(3): 82-95. DOI:10.1016/S1872-5791(08)60064-0 |
Sun Y Q, Luo G. 2018. Spatial-temporal migration of earthquakes in the northeastern Tibetan Plateau:Insights from a finite element model. Chinese Journal of Geophysics (in Chinese), 61(6): 2246-2264. DOI:10.6038/cjg2018L0401 |
Tapponnier P, Xu Z Q, Roger F, et al. 2001. Oblique stepwise rise and growth of the Tibet plateau. Science, 294(5547): 1671-1677. DOI:10.1126/science.105978 |
Wang C Y, Han W B, Wu J P, et al. 2007. Crustal structure beneath the eastern margin of the Tibetan plateau and its tectonic implications. Journal of Geophysical Research:Solid Earth, 112(B7): B07307. DOI:10.1029/2005JB003873 |
Wang C Y, Flesch L M, Silver P G, et al. 2008. Evidence for mechanically coupled lithosphere in central Asia and resulting implications. Geology, 36(5): 363-366. DOI:10.1130/G24450A.1 |
Wang C Y, Lou H, Lv Z Y, et al. 2008. S-wave crustal and upper mantle's velocity structure in the eastern Tibetan Plateau-Deep environment of lower crustal flow. Science in China Series D:Earth Sciences, 51(2): 263-274. DOI:10.1007/s11430-008-0008-5 |
Wang C Y, Lou H, Silver P G, et al. 2010a. Crustal structure variation along 30°N in the eastern Tibetan Plateau and its tectonic implications. Earth and Planetary Science Letters, 289(3-4): 367-376. DOI:10.1016/j.epsl.2009.11.026 |
Wang H, Liu M, Shen X H, et al. 2010b. Balance of seismic moment in the Songpan-Ganze region, eastern Tibet:Implications for the 2008 Great Wenchuan earthquake. Tectonophysics, 491(1-4): 154-164. DOI:10.1016/j.tecto.2009.09.022 |
Wang Q L, Cui D X, Wang W P, et al. 2008. Present vertical crustal displacements of western Sichuan region. Science in China (Series-D Geosciences) (in Chinese), 38(5): 598-610. |
Wang X F, He J K. 2012. Channel flow of the lower crust and its relation to large-scale tectonic geomorphology of the eastern Tibetan Plateau. Science China:Earth Sciences, 42(4): 505-512. DOI:10.1007/s11430-012-4391-6 |
Wang Y X, Mooney W D, Han G H, et al. 2005. The crustal P-wave velocity structure from Altyn Tagh to Longmen mountains along the Taiwan-Altay geoscience transect. Chinese Journal of Geophysics (in Chinese), 48(1): 98-106. |
Xu X W, Wen X Z, Ye J Q, et al. 2008. The MS8.0 Wenchuan earthquake surface ruptures and its seismogenic structure. Seismology and Geology (in Chinese), 30(3): 597-629. |
Yang H, Teng J W, Pi J L. 2013. Numerical simulation of the geodynamical condition about the channel flow model in Tibetan plateau. Chinese Journal of Geophysics (in Chinese), 56(8): 2625-2635. DOI:10.6038/cjg20130812 |
Yang Y J, Ritzwoller M H, Zheng Y, et al. 2012. A synoptic view of the distribution and connectivity of the mid-crustal low velocity zone beneath Tibet. Journal of Geophysical Research:Solid Earth, 117(B4): B04303. DOI:10.1029/2011JB008810 |
Yi S, Freymueller J T, Sun W K. 2016. How fast is the middle-lower crust flowing in eastern Tibet? A constraint from geodetic observations. Journal of Geophysical Research:Solid Earth, 121(9): 6903-6915. DOI:10.1002/2016JB013151 |
Yin A. 2010. A special issue on the great 12 May 2008 Wenchuan earthquake (MW7.9):Observations and unanswered questions. Tectonophysics, 491(1-4): 1-9. DOI:10.1016/j.tecto.2010.05.019 |
Yin L, Luo G. 2018. Crustal deformation across the Longmen Shan fault zone from finite element simulation of seismic cycles. Chinese Journal of Geophysics (in Chinese), 61(4): 1238-1257. DOI:10.6038/cjg2018L0248 |
Yuan X H, Ni J, Kind R, et al. 1997. Lithospheric and upper mantle structure of southern Tibet from a seismological passive source experiment. Journal of Geophysical Research:Solid Earth, 102(B12): 27491-27500. DOI:10.1029/97JB02379 |
Zhang P Z, Shen Z K, Wang M, et al. 2004. Continuous deformation of the Tibetan Plateau from global positioning system data. Geology, 32(9): 809-812. DOI:10.1130/G20554.1 |
Zhang P Z, Xu X W, Wen X Z, et al. 2008. Slip rates and recurrence intervals of the Longmen Shan active fault zone, and tectonic implications for the mechanism of the May 12 Wenchuan earthquake, 2008, Sichuan, China. Chinese Journal of Geophysics (in Chinese), 51(4): 1066-1073. |
Zhang Z J, Wang Y H, Chen Y, et al. 2009. Crustal structure across Longmenshan fault belt from passive source seismic profiling. Geophysical Research Letters, 36(17): L17310. DOI:10.1029/2009GL039580 |
Zhang Z J, Yuan X H, Yun C, et al. 2010a. Seismic signature of the collision between the east Tibetan escape flow and the Sichuan Basin. Earth and Planetary Science Letters, 292(3-4): 254-264. DOI:10.1016/j.epsl.2010.01.046 |
Zhang Z Q, Zhang P Z, Wang Q L. 2010b. The structure and seismogenic mechanism of Longmenshan high dip-angle reverse fault. Chinese Journal of Geophysics (in Chinese), 53(9): 2068-2082. DOI:10.3969/j.issn.0001-5733.2010.09.007 |
Zhao B, Huang Y, Zhang C H, et al. 2015. Crustal deformation on the Chinese mainland during 1998-2014 based on GPS data. Geodesy and Geodynamics, 6(1): 7-15. DOI:10.1016/j.geog.2014.12.006 |
Zhao G Z, Chen X B, Wang L F, et al. 2008. Evidence of crustal 'channel flow' in the eastern margin of Tibetan Plateau from MT measurements. Chinese Science Bulletin, 53(12): 1887-1893. |
Zhu A Y, Zhang D N. 2014. Numerical simulation of the present activity characters of Anninghe-Zemuhe-Xiaojiang fault under gravity and other dynamic factor. 2014 Joint Annual Conference on Earth Sciences in China.
|
Zhu A Y, Zhang D N, Jiang C S. 2015. Numerical simulation of the segmentation of the stress state of the Anninghe-Zemuhe-Xiaojiang faults. Science China Earth Sciences, 59(2): 384-396. |
Zhu A Y, Zhang D N, Guo Y X. 2016. The numerical simulation on the seismogenic mechanism of the Lushan MS7.0 earthquake constrained by deformation observation. Chinese Journal of Geophysics (in Chinese), 59(5): 1661-1672. DOI:10.6038/cjg20160511 |
Zhu J S. 2007. The structural characteristics of lithosphere in the continent of Eurasia and its marginal seas. Earth Science Frontiers (in Chinese), 14(3): 1-20. DOI:10.1016/S1872-5791(07)60020-7 |
Zhu J S, Wang X B, Yang Y H, et al. 2017. The crustal flow beneath the eastern margin of the Tibetan Plateau and its process of dynamics. Chinese Journal of Geophysics (in Chinese), 60(6): 2038-2057. DOI:10.6038/cjg20170602 |
Zhu S B, Zhang P Z. 2013. FEM simulation of interseismic and coseismic deformation associated with the 2008 Wenchuan Earthquake. Tectonophysics, 584: 64-80. DOI:10.1016/j.tecto.2012.06.024 |
Zienkiewicz O C, Taylor R L. 2005. The Finite Element Method for Solid and Structural Mechanics. Butterworth-Heinemann: 631. |
陈九辉, 刘启元, 李顺成, 等. 2009. 汶川MS8.0地震余震序列重新定位及其地震构造研究. 地球物理学报, 52(2): 390-397. |
陈运泰, 杨智娴, 张勇, 等. 2013. 从汶川地震到芦山地震. 中国科学:地球科学, 43(6): 1064-1072. |
傅容珊, 黄建华, 李力刚, 等. 2000. 青藏高原隆升三阶段模型的数值模拟. 地学前缘, 7(4): 588-595. DOI:10.3321/j.issn:1005-2321.2000.04.029 |
黄禄渊, 张贝, 程惠红, 等. 2017a. 2015年智利Illapel MW8.3地震同震效应及其对南美大陆地震危险性影响. 地球物理学报, 60(1): 163-173. DOI:10.6038/cjg20170114 |
黄禄渊, 张贝, 瞿武林, 等. 2017b. 2010智利Maule特大地震的同震效应. 地球物理学报, 60(3): 972-984. DOI:10.6038/cjg20170312 |
黄媛, 吴建平, 张天中, 等. 2008. 汶川8.0级大地震及其余震序列重定位研究. 中国科学D辑:地球科学, 38(10): 1242-1249. |
李吉均, 文世宣, 张青松, 等. 1979. 青藏高原隆起的时代、幅度和形式的探讨. 中国科学, (6): 608-616. |
柳畅, 朱伯靖, 石耀霖. 2012. 粘弹性数值模拟龙门山断裂带应力积累及大震复发周期. 地质学报, 86(1): 157-69. DOI:10.3969/j.issn.0001-5717.2012.01.004 |
柳畅, 石耀霖, 朱伯靖, 等. 2014. 地壳流变结构控制作用下的龙门山断裂带地震发生机理. 地球物理学报, 57(2): 404-418. DOI:10.6038/cjg20140207 |
刘启元, 李昱, 陈九辉, 等. 2009. 汶川MS8.0地震:地壳上地幔S波速度结构的初步研究. 地球物理学报, 52(2): 309-319. |
刘巧霞, 朱介寿, 曹俊兴, 等. 2010. 汶川MS8.0级地震余震重新定位及其空间分布特征研究. 第四纪研究, 30(4): 736-744. DOI:10.3969/j.issn.1001-7410.2010.04.09 |
石耀霖, 曹建玲. 2008. 中国大陆岩石圈等效粘滞系数的计算和讨论. 地学前缘, 15(3): 83-95. |
孙云强, 罗纲. 2018. 青藏高原东北缘地震时空迁移的有限元数值模拟. 地球物理学报, 61(6): 2246-2264. DOI:10.6038/cjg2018L0401 |
王椿镛, 楼海, 吕智勇, 等. 2008. 青藏高原东部地壳上地幔S波速度结构——下地壳流的深部环境. 中国科学D辑:地球科学, 38(1): 22-32. |
王庆良, 崔笃信, 王文萍, 等. 2008. 川西地区现今垂直地壳运动研究. 中国科学D辑:地球科学, 38(5): 598-610. |
王晓芳, 何建坤. 2012. 下地壳管道流动与青藏高原东缘大尺度构造地貌关系. 中国科学:地球科学, 42(4): 505-512. |
王有学, Mooney W D, 韩果花, 等. 2005. 台湾-阿尔泰地学断面阿尔金-龙门山剖面的地壳纵波速度结构. 地球物理学报, 48(1): 98-106. DOI:10.3321/j.issn:0001-5733.2005.01.015 |
徐锡伟, 闻学泽, 叶建青, 等. 2008. 汶川M8.0地震地表破裂带及其发震构造. 地震地质, 30(3): 597-629. DOI:10.3969/j.issn.0253-4967.2008.03.003 |
杨辉, 滕吉文, 皮娇龙. 2013. 青藏高原通道流模型动力环境的数值模拟. 地球物理学报, 56(8): 2625-2635. DOI:10.6038/cjg20130812 |
尹力, 罗纲. 2018. 有限元数值模拟龙门山断裂带地震循环的地壳变形演化. 地球物理学报, 61(4): 1238-1257. DOI:10.6038/cjg2018L0248 |
张培震, 徐锡伟, 闻学泽, 等. 2008. 2008年汶川8.0级地震发震断裂的滑动速率、复发周期和构造成因. 地球物理学报, 51(4): 1066-1073. DOI:10.3321/j.issn:0001-5733.2008.04.015 |
张竹琪, 张培震, 王庆良. 2010b. 龙门山高倾角逆断层结构与孕震机制. 地球物理学报, 53(9): 2068-2082. DOI:10.3969/j.issn.0001-5733.2010.09.007 |
赵国泽, 陈小斌, 王立凤, 等. 2008. 青藏高原东边缘地壳"管流"层的电磁探测证据. 科学通报, 53(3): 345-350. DOI:10.3321/j.issn:0023-074X.2008.03.011 |
祝爱玉, 张东宁. 2014. 重力等动力因素作用下安宁河-则木河-小江断裂带现今构造活动分段特征的数值模拟研究. //2014年中国地球科学联合学术年会论文集. 北京: 中国地球物理学会, 中国地质学会.
|
祝爱玉, 张东宁, 蒋长胜. 2015. 安宁河-则木河-小江断裂带应力状态分段特征的数值模拟研究. 中国科学:地球科学, 45(12): 1839-1852. |
祝爱玉, 张东宁, 郭颖星. 2016. 以形变观测为约束的芦山MS7.0地震孕震机理数值模拟研究. 地球物理学报, 59(5): 1661-1672. DOI:10.6038/cjg20160511 |
朱介寿. 2007. 欧亚大陆及边缘海岩石圈的结构特性. 地学前缘, 14(3): 1-20. DOI:10.3321/j.issn:1005-2321.2007.03.001 |
朱介寿, 王绪本, 杨宜海, 等. 2017. 青藏高原东缘的地壳流及动力过程. 地球物理学报, 60(6): 2038-2057. DOI:10.6038/cjg20170602 |