热带辐合带(Intertropical Convergence Zone,ITCZ)是南北两条副热带高压间的低压区,气流在此发生交汇,具有强烈的上升运动和降水.ITCZ作为热带大气的主要系统之一,对全球大气环流具有重要影响.最初,Alpert(1945, 1946a, 1946b),Riehl(1954)利用风场资料对ITCZ进行了定义,因当时海洋上资料稀少,所以无法精确确定.范慧君(1985)利用云量确定ITCZ位置,发现中东太平洋ITCZ季节、年际变化较小,一般在5°N—8°N.蒋尚城(1988)利用长波辐射资料定义了ITCZ强度和位置,发现西太平洋ITCZ最强,同时也指出了双ITCZ现象.Chan和Evans(2002),Wang和Magnusdottir(2006)分别用850 hPa和975 hPa的相对涡度定义了ITCZ.Wei等(2008)用850 hPa纬向风经向切变涡度定义ITCZ位置,其结果与通过云量资料定义的结果基本一致.马丽萍(2009)发现利用925 hPa的相对涡度定义ITCZ比975 hPa更合适.Stanfield等(2016)利用降水资料对ITCZ进行了定义,并通过这种定义比较了29个模式对ITCZ的模拟效果.前人已从多种角度对ITCZ进行了定义,用多种方法描述了ITCZ的位置和强度,使得ITCZ的基本特征得到了定量分析.
东太平洋ITCZ常年位于赤道以北,Xie和Philander(1994),Xie(1996)从海气相互作用的角度提出了风-蒸发-SST正反馈机制,最先揭示了东太平洋ITCZ位于赤道以北的可能原因.Philander等(1996)提出的层云-SST正反馈机制以及Chang等(1998)提出的越赤道风-上升流正反馈机制又对东太平洋ITCZ常年偏北的现象做出了进一步的解释.Xie和Arkin(1998),Gruber等(2000)指出,东太平洋SST高温区在春季会移向赤道附近,这使得东太平洋ITCZ在春季位于最南端.Xu等(2005)发现北半球冬季ITCZ位于东太平洋暖池南部,并利用模式分析了其物理机制.Vecchi和Harrison(2006),Lengaigen和Vecchi(2010)发现在东部型厄尔尼诺年,东太平洋ITCZ会异常偏南.隋晓霞和王启(2011)在研究ITCZ上升运动的季节和年际变化时指出,东太平洋ITCZ的垂直速度极值位置在厄尔尼诺年偏南,拉尼娜年偏北.Xie和Yang(2014)指出在中部型厄尔尼诺年,东太平洋ITCZ会略微偏南,其偏南程度要小于东部型厄尔尼诺年.Hiroto等(2014)研究发现东太平洋ITCZ是连接低纬度海洋开尔文波与罗斯贝波的“大气桥”,海洋中的赤道开尔文波通过改变东太平洋ITCZ位置来激发西传的罗斯贝波.前人虽对ITCZ做出了一系列工作,但在分析与厄尔尼诺的相关性时,并未定量给出两者的相关关系以及两者在不同季节的相关性强弱,尤其是厄尔尼诺对ITCZ强度的影响,也未系统地比较两类厄尔尼诺对ITCZ影响的差异.有学者指出,21世纪以后发生的厄尔尼诺更加倾向于中部型(Larkin and Harrison, 2005; Ashok et al., 2007; Kao and Yu, 2009; Kug et al., 2009; Weng et al., 2009; Xie et al., 2014),而厄尔尼诺的悄然变化究竟会对ITCZ产生多大的影响?本文基于降水资料,对中东太平洋ITCZ(Centre and Eastern Pacific ITCZ,CEP-ITCZ)的位置、强度与3个Niño海区的相关性分别进行了定量分析,以便根据Niño海区SST异常推测ITCZ降水位置与强度的变化,这对海气相互作用的机制研究、气候预测、模式评估等具有重要意义.
1 资料与方法 1.1 资料降水数据选用1979—2015年GPCP与CMAP两种月平均资料,分辨率均为2.5°×2.5°.SST数据采用欧洲天气预报中心月平均资料,分辨率1°×1°.
1.2 CEP-ITCZ定义考虑到降水带能够最直观地反映ITCZ的强度与位置,且本文研究范围主要针对中东太平洋,CEP-ITCZ位置常年偏北,降水具有显著的带状分布特征.因此,本文采用Stanfield等(2016)从降水角度对CEP-ITCZ进行的定义.此定义方法远离陆地,可排除中美山脉对CEP-ITCZ的影响(Xu et al., 2005).
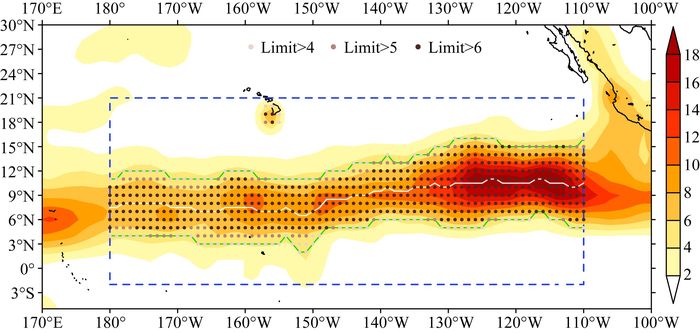
CEP-ITCZ关键区域为(180°W—110°W,2°S—21°N),如图 1虚线框.将GPCP或CMAP降水资料由2.5°×2.5°格点插值到1°×1°格点,插值法为双线性插值.对关键区域内降水率大于4 mm/day的格点进行描点,将每条经线上一系列连续点的最北端连线作为CEP-ITCZ北边界,同理可画出南边界.每条经线上南北端点的中点在纬向连线后为CEP-ITCZ中线,本文即以此中线表示其位置.注意:(1)同一经线上,北端点至南端点的描点无中断.(2)若某经线上最大降水率小于4 mm/day,则此经线的ITCZ中点由相邻经线插值得到.(3)若某一经线以东(西)至区域边界的最大降水率均小于4 mm/day,则利用中线上最东(西)端10个点连线的平均倾斜程度将中线延长至区域边界.此外,因CEP-ITCZ的年平均态在经向上约占8~9个纬距,所以定义中线向南北两侧各延长4个纬距后降水率的平均值作为CEP-ITCZ的强度.
|
图 1 CEP-ITCZ定义 虚线框为CEP-ITCZ关键区域,浅棕、棕色和深棕色描点分别表示降水率大于4、5和6 mm/day的格点,绿色实线为CEP-ITCZ南北边界,白色实线为CEP-ITCZ中线,阴影为降水率,单位:mm/day. Fig. 1 Definition of the CEP-ITCZ The dashed box represents the pivotal area of the CEP-ITCZ. Light brown, brown and dark brown dots indicate a gridded precipitation rate greater than 4, 5 and 6 mm per day, respectively. Green solid lines represent the north and south boundaries of the CEP-ITCZ. White solid line shows the centerline of the CEP-ITCZ. Shaded area represents the precipitation rate with unit mm/day. |
根据秦坚肇和王亚非(2014)提出的描述两类厄尔尼诺类型的指数CPI(Centre Pacific ENSO Index)与EPI(Eastern Pacific ENSO Index),并采用11月至次年1月的SST平均值资料(图 2),可以找出典型的东部型厄尔尼诺年(EP-El)包括:1982/83,1997/98;较强的中部型厄尔尼诺年(CP-El)包括:1987/88,1991/92,1994/95,2002/03,2006/07,2009/10.

|
图 2 两类厄尔尼诺指数时间序列 Fig. 2 Time series of two types of El Niño indices |
利用降水资料对CEP-ITCZ基本特征在普通年份的季节变化进行分析,其结果与前人利用云量、长波辐射、垂直速度等要素的统计结果基本一致.在与东太平洋各气压层的ITCZ垂直速度统计结果(隋晓霞和王启,2011)对比时发现,CEP-ITCZ降水位置与850 hPa层ITCZ垂直速度极值位置最接近,且强度有相同的季节变化规律.对于CEP-ITCZ在两类厄尔尼诺年的季节变化,尚无具体资料可供对比.
1979—2015年CEP-ITCZ的季节变化如图 3所示.从CEP-ITCZ位置的季节变化角度来看,GPCP(CMAP)资料显示,普通年份CEP-ITCZ的中线位置在3月份移至最南端,约5.27°N(5.32°N),9月份移至最北端,约9.68°N(9.82°N).两类厄尔尼诺发生时,CEP-ITCZ位置的季节变化规律与普通年份相似,均在6—8月份发生北跳,11月—次年1月份快速南撤,并且也在3月份移至最南端,9月份移至最北端.具体位置为,中部型厄尔尼诺年CEP-ITCZ最南端移至5.00°N(5.03°N),最北端移至9.75°N(9.86°N);东部型厄尔尼诺年CEP-ITCZ最南端移至0.74°N(0.96°N),最北端移至8.11°N(8.67°N).

|
图 3 CEP-ITCZ中线位置及强度的季节变化 Fig. 3 Seasonal variations of the position and intensity of the CEP-ITCZ |
从CEP-ITCZ强度的季节变化角度来看,GPCP(CMAP)资料中,普通年份CEP-ITCZ的强度具有明显的季节差异,在2月份最弱,为4.28 mm/day(4.89 mm/day),8月份最强,为8.79 mm/day(9.49 mm/day),此外在11月份会达到一个次高峰,约8.29 mm/day(9.13 mm/day).强度最值发生的月份比位置达到最北端或最南端要超前一个月.当两类厄尔尼诺发生时,CEP-ITCZ强度的季节差异会被削弱,在11月至次年2月份,CEP-ITCZ强度相对普通年份均有较大程度的增强,这是厄尔尼诺在冬季发展至极盛的结果.在中部型厄尔尼诺年,CEP-ITCZ最强月份发生在11月,强度为10.36 mm/day(10.91 mm/day),最弱月份为2月,强度为5.10 mm/day(5.62 mm/day).在东部型厄尔尼诺年,CEP-ITCZ最强仍发生在8月份,强度为11.18 mm/day(11.22 mm/day),在1月份再次达到一个峰值,强度为10.20 mm/day(9.77 mm/day).
气候平均态上,GPCP(CMAP)资料显示,普通年份CEP-ITCZ通常位于7.55°N(7.65°N),强度均值为6.85 mm/day(7.65 mm/day);中部型厄尔尼诺年则略微偏南,平均位于7.34°N(7.40°N),强度增强为8.52 mm/day(9.22 mm/day);东部型厄尔尼诺年偏南程度较大,平均位于4.55°N(4.84°N),强度增强为9.04 mm/day(9.46 mm/day).不难发现,东部型厄尔尼诺对CEP-ITCZ的位置与强度均有较大影响,而中部型厄尔尼诺对CEP-ITCZ的位置影响不大,但对CEP-ITCZ强度的影响却不亚于东部型厄尔尼诺.可见,两类厄尔尼诺与CEP-ITCZ之间有着不同的相关性.
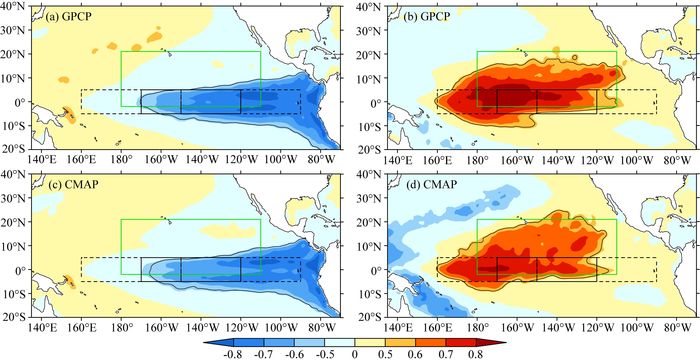
3 CEP-ITCZ年平均特征与厄尔尼诺的关系 3.1 年平均特征与厄尔尼诺的相关性为探讨Niño海区SST对CEP-ITCZ的影响,分别绘制CEP-ITCZ位置异常(图 4a,4c)、强度异常(图 4b,4d)与SST异常的相关系数分布场,图中黑色等值线内通过99.9%的信度检验.两种降水资料显示出了相似的结果:在图 4(a,c)中,东太平洋赤道附近出现了负相关,通过信度检验的区域从美洲沿岸一直延伸至170°W,表示东太平洋赤道地区SST越高,CEP-ITCZ位置越偏南.相关系数极小值出现在Niño 3海区,最小值达到-0.8以下,说明CEP-ITCZ位置与Niño 3海区SST具有良好的相关性.图 4(b,d)中,太平洋赤道附近出现了大面积的正相关,通过信度检验的区域在160°E—110°W,表示中太平洋赤道地区SST越高,CEP-ITCZ强度越强.相关系数最大值出现在Niño 4海区,达到0.8以上,说明CEP-ITCZ强度与Niño 4海区SST的相关性较大.经对比可以发现,影响CEP-ITCZ位置与强度的海区均在赤道附近,但与CEP-ITCZ位置相关性较大的海区更倾向于东太平洋,CEP-ITCZ强度则更加倾向于中太平洋.
|
图 4 CEP-ITCZ位置异常(a,c)、强度异常(b,d)与SST异常相关系数分布 黑色等值线内通过99.9%的信度检验,绿线框为CEP-ITCZ关键区域,黑实线框为Niño 3.4海区,黑虚线框由左至右分别为Niño 4与Niño 3海区. Fig. 4 Distribution of correlation coefficients between position anomalies (a, c), intensity anomalies (b, d) of the CEP-ITCZ and SST anomalies Black contours represent the 99.9% confidence level. Green box in each image represents the pivotal area of the CEP-ITCZ. Black box with solid lines shows Niño 3.4. Black boxes with dashed lines represent Niño 4 on the left side and Niño 3 on the right side, respectively. |
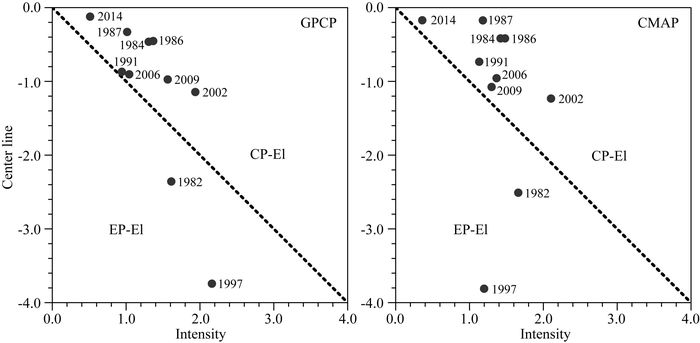
由此可以说明,对于东部型厄尔尼诺,CEP-ITCZ异常更倾向于位置偏南;对中部型厄尔尼诺,CEP-ITCZ异常将会更倾向于强度增强.为进一步验证此结论,本文采用1979—2015年11月至次年1月CEP-ITCZ位置及强度的平均值,绘制了标准化位置-强度二维散点图(图 5).由散点图可以发现,1987、1991等年份的CEP-ITCZ强度异常较大,位置异常较小,强度异常大于位置异常.1982年与1997年的CEP-ITCZ强度异常也较大,但位置却有更大的异常,其位置异常大于强度异常.
|
图 5 CEP-ITCZ位置-强度标准化的散点图 Fig. 5 Scatter plot of standardized position and intensity of the CEP-ITCZ |
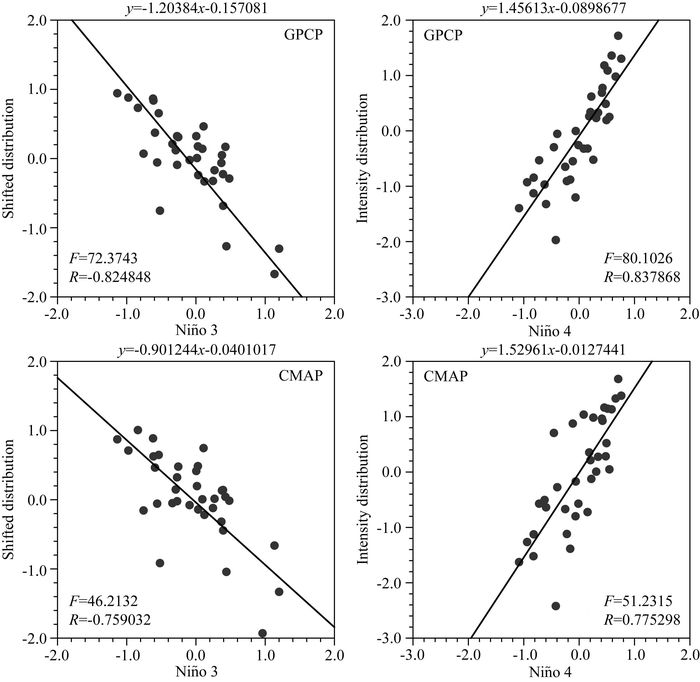
根据3.1节发现的与CEP-ITCZ异常密切相关的海区,分别绘制CEP-ITCZ年平均位置与Niño 3海区SST异常、强度与Niño 4海区SST异常的回归曲线(图 6),F为回归效果显著性检验统计量,大于7.40则代表通过99%的信度检验.GPCP(CMAP)资料中,CEP-ITCZ年平均位置与Niño 3海区SST相关性可达-0.82(-0.76),回归曲线斜率约为-1.20(-0.90).根据回归曲线,倘若Niño 3海区SST异常升高1 ℃,则CEP-ITCZ位置可能会向南偏移1°左右.CEP-ITCZ年平均强度与Niño 4海区SST相关性可达0.84(0.78),回归曲线斜率约为1.46(1.53),倘若Niño 4海区SST异常升高1 ℃,则CEP-ITCZ降水率可能会增强1.5 mm/day左右.
|
图 6 CEP-ITCZ位置异常与Niño 3海区SST异常、强度异常与Niño 4海区SST异常的回归曲线 等式为回归方程,R为相关系数,F为回归效果显著性检验统计量. Fig. 6 Regression curve between position/intensity anomalies of CEP-ITCZ and SST anomalies in Niño 3/Niño 4 The regression equation is on the top. R is correlation coefficient. F is the significance test statistic of the regression effect. |
由CEP-ITCZ月平均特征与各Niño海区SST异常超前滞后相关系数曲线(图 7)可以发现,Niño海区SST异常超前CEP-ITCZ异常一个月时,两者的相关性最显著.其中CEP-ITCZ位置异常与超前一个月的Niño 3海区SST异常相关性最大,相关系数可达-0.75;CEP-ITCZ强度异常与超前一个月的Niño 4海区SST异常相关性最大,相关系数达0.70.

|
图 7 CEP-ITCZ位置异常(a)、强度异常(b)与各Niño海区SST异常超前滞后相关系数 直线两侧通过95%的信度检验. Fig. 7 Lead-lag correlation coefficients between the position (a) and intensity (b) anomalies of the CEP-ITCZ and the SST anomalies in each Niño area Straight lines represent the 95% confidence level. |
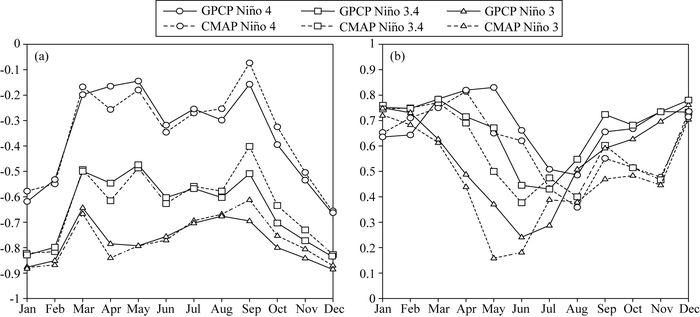
当Niño海区SST异常超前CEP-ITCZ异常一个月时,两者相关性的季节变化如图 8所示.图 8a描述的是CEP-ITCZ位置异常.不难发现,在所有月份,Niño 3海区对CEP-ITCZ位置异常的影响程度大于Niño 3.4海区且远远超过Niño 4海区.这进一步说明,在任意季节,中部型厄尔尼诺对CEP-ITCZ位置的影响都较弱.此外,两种降水资料均显示12月份CEP-ITCZ位置异常与11月份Niño 3海区SST异常相关性最好,相关系数为-0.89;之后至3月份,相关性逐渐减弱,3月份CEP-ITCZ位置异常与2月份Niño 3海区SST异常相关系数仅为-0.64,由前文可知此时CEP-ITCZ位置正位于一年中的最南端;其后两者的相关性又会增强,4—5月份达到次峰值后再次逐渐减弱,8—9月份两者的相关性再次达到一个低谷.
|
图 8 月平均CEP-ITCZ位置异常(a)、强度异常(b)与超前一个月的Niño海区SST异常相关系数季节变化曲线 Fig. 8 Seasonal variation of the correlation coefficients between the anomalous position (a) and intensity (b) of the monthly mean CEP-ITCZ and the SST anomalies ahead of one month in each Niño area |
图 8b中可知CEP-ITCZ强度与Niño 3.4和Niño 4海区SST的相关性较好.具体表现为,在北半球的初春至夏中(3月至7月),CEP-ITCZ强度异常与超前一个月的Niño 4海区SST异常相关系数较大,夏中至冬末(8月至次年2月),CEP-ITCZ强度异常与超前一个月的Niño 3.4海区SST异常相关系数较大.这说明两类厄尔尼诺对CEP-ITCZ强度都会产生较大影响.GPCP(CMAP)资料中,5月(4月)CEP-ITCZ强度异常与4月(3月)Niño 4海区SST异常的相关系数最大,为0.83(0.81);其后相关性快速减弱,7月两者的相关系数仅为0.50左右.7月之后,CEP-ITCZ强度与Niño海区SST的相关性不断增大,且Niño 3.4海区开始大于Niño 4海区.综合分析CEP-ITCZ强度异常与Niño海区SST异常相关系数变化曲线发现,冬季的相关系数较大,而夏季却远远小于冬季,这可能是因为厄尔尼诺通常在11月至次年2月达到极盛,这也意味着CEP-ITCZ强度与厄尔尼诺的相关性最大值应出现在12月至次年3月,图中Niño 3.4曲线基本符合此规律,而Niño 4曲线却在3月至5月达到最大值,且Niño 4曲线相位要落后于Niño 3.4曲线相位1~2个月.
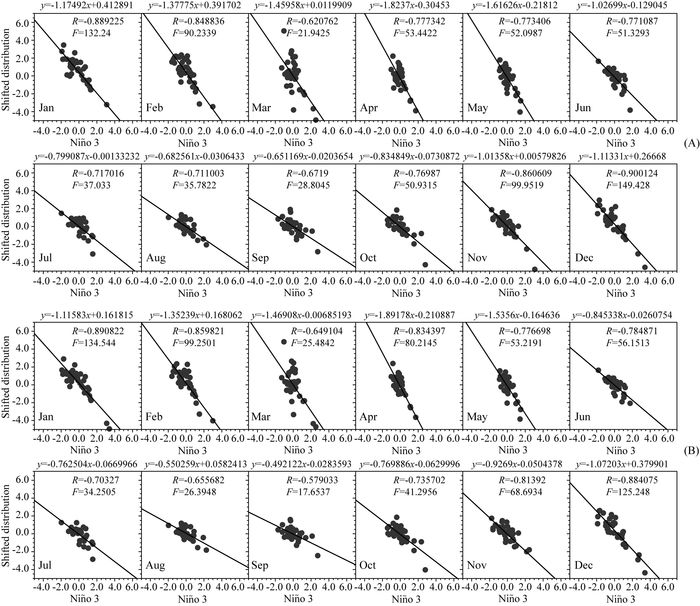
4.2 月平均特征对相关海区SST的敏感性根据4.1节中得到的影响CEP-ITCZ特征的关键海区,绘制各月份CEP-ITCZ位置与超前一个月的Niño 3海区SST异常回归曲线(图 9)和强度与超前一个月的Niño 3.4(或Niño 4)海区SST异常回归曲线(图 10).图 9中,各月曲线与年平均曲线相似,均为负斜率,Niño 3海区SST升高会伴随着次月CEP-ITCZ位置的偏南.由GPCP(CMAP)资料发现,4月份曲线斜率为最小值-1.82(-1.89),这说明4月份CEP-ITCZ位置对Niño 3海区SST的变化最敏感,相同程度的SST异常会使4月份CEP-ITCZ位置有相对更大的偏移.其后,曲线的斜率会逐渐增加,CEP-ITCZ位置对Niño 3海区SST的敏感性降低,9月份曲线斜率达到最大-0.65(-0.49).9月至次年的4月,曲线斜率又会降低,CEP-ITCZ位置对Niño 3海区SST敏感性增强.
|
图 9 各月CEP-ITCZ位置异常与超前一个月的Niño 3海区SST异常的回归曲线 (A)图为GPCP资料,(B)图为CMAP资料.等式为回归方程,R为相关系数,F为回归效果显著性检验统计量. Fig. 9 Regression curve between position anomalies of CEP-ITCZ every month and SST anomalies ahead of one month in Niño 3 (A) is GPCP data. (B) is CMAP data. The regression equations are on the top. R is correlation coefficient. F is the significance test statistic of the regression effect. |
|
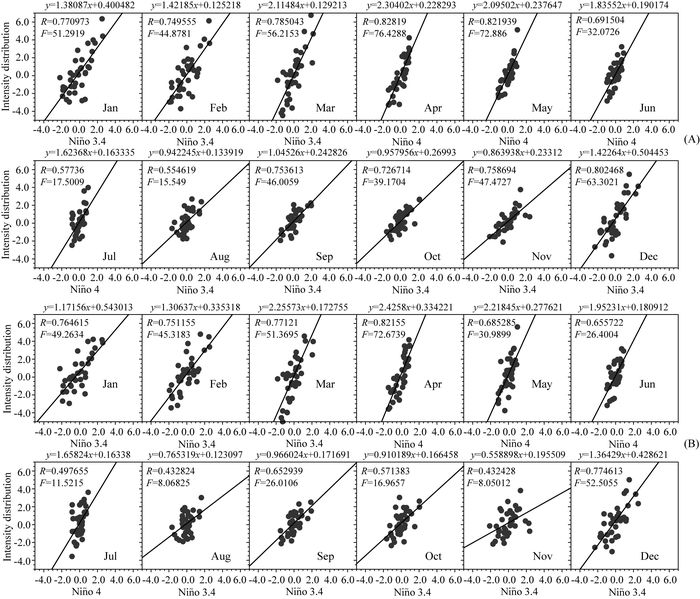
图 10 各月CEP-ITCZ强度异常与超前一个月的Niño 3.4(或Niño 4)海区SST异常的回归曲线 (A)图为GPCP资料,(B)图为CMAP资料,等式为回归方程,R为相关系数,F为回归效果显著性检验统计量. Fig. 10 Same as Fig. 9 but for intensity of CEP-ITCZ and Niño 3.4 or Niño 4 |
在图 10中,各月份均表现出Niño海区SST升高会使次月CEP-ITCZ增强的特征.根据相关系数季节变化曲线,图中4月至7月采用了Niño 4海区,其他月份为Niño 3.4海区.由GPCP(CMAP)资料得到,在4月份,CEP-ITCZ强度对Niño 4海区的SST敏感度最强,回归曲线斜率为2.30(2.43).4月至11月,曲线斜率整体呈现减小趋势,11月份曲线斜率最小,为0.86(0.56).11月至次年4月,曲线斜率整体呈增加趋势.
综合分析上述回归曲线斜率的变化趋势可以发现,在CEP-ITCZ位于最南端时(3月)的次月,CEP-ITCZ位置与强度对相关Niño海区SST异常的敏感程度最强.在CEP-ITCZ北跳过程中,相应的敏感程度会减弱.在CEP-ITCZ位于最北端(9月)之后的1~2个月内,CEP-ITCZ位置与强度对相关Niño海区SST异常的敏感程度达到最弱,其后在CEP-ITCZ南撤时又会增强.
5 结论与讨论ITCZ作为热带大气的重要组成部分,其异常变化会对全球大气环流产生重要影响,ITCZ的异常变化也可以作为中纬度灾害性天气预测的依据.本文用GPCP和CMAP降水资料对中东太平洋ITCZ的基本特征做出了统计分析,并定量分析了其异常变化与厄尔尼诺的相关性,得到如下结论.
(1) 普通年份,CEP-ITCZ平均位置约为7.6°N,强度7.25 mm/day,东部型厄尔尼诺年位置偏南约2.9°,强度增强1.9 mm/day;而中部型厄尔尼诺年位置偏南仅有0.2°,强度增强1.7 mm/day.两类厄尔尼诺期间,CEP-ITCZ位置的季节变化规律与普通年份相似,均是3月位于最南端,9月位于最北端,而强度的季节差异则被削弱.
(2) 分析CEP-ITCZ的年平均特征发现,中部型厄尔尼诺年的强度异常较大,位置略有偏移,强度异常大于位置异常;东部型厄尔尼诺年的CEP-ITCZ强度异常也较大,但位置却有更大的偏移,其位置异常大于强度异常.
(3) 分析CEP-ITCZ的月平均特征发现,与CEP-ITCZ位置相关性最大的海区为超前一个月的Niño 3海区,而与CEP-ITCZ强度相关性最大的海区则为超前一个月的Niño 3.4(8月—次年2月)或Niño 4(3—7月)海区.
(4) 在CEP-ITCZ达到最南端时(3月)的次月,CEP-ITCZ位置与强度对相关Niño海区SST异常的敏感程度最强;而在达到最北端(9月)之后的1~2个月内,前者对后者的敏感程度达到最弱.
根据本文研究结论,若厄尔尼诺在21世纪后更加倾向于中部型,则CEP-ITCZ异常应更多地表现为强度的变化.此外,通过分析Niño海区SST异常超前CEP-ITCZ异常一个月的相关关系,可对次月CEP-ITCZ异常进行预测.本文主要从统计学角度对CEP-ITCZ与厄尔尼诺的相关性做了定量分析,下一步将对两者相互作用的物理机制进行研究.
致谢两位审稿专家以及中国海洋大学高山红教授、国防科技大学郭海龙博士、刘爽博士对本文提出了非常宝贵的修改意见,在此一并致谢.
Alpert L.
1945. The intertropical convergence zone of the eastern Pacific ocean, I. Bulletin of American Meteorological Society, 26(10): 426-432.
|
|
Alpert L.
1946a. The intertropical convergence zone of the eastern Pacific ocean, Ⅱ. Bulletin of American Meteorological Society, 27(1): 15-29.
|
|
Alpert L.
1946b. The intertropical convergence zone of the eastern Pacific ocean, Ⅲ. Bulletin of American Meteorological Society, 27(2): 62-66.
|
|
Ashok K, Behera S K, Rao S A, et al.
2007. El Niño Modoki and its possible teleconnection. Journal of Geophysical Research:Atmospheres, 112(C11): C11007.
DOI:10.1029/2006JC003798 |
|
Chan S C, Evans J L.
2002. Comparison of the structure of the ITCZ in the west Pacific during the boreal summers of 1989-93 using AMIP simulations and ECMWF reanalysis. Journal of Climate, 15(24): 3549-3568.
DOI:10.1175/1520-0442(2002)015<3549:COTSOT>2.0.CO;2 |
|
Chang P, Ji L, Penland C, et al.
1998. Prediction of tropical Atlantic sea surface temperature. Geophysical Research Letters, 25(8): 1193-1196.
DOI:10.1029/98GL00852 |
|
Fan H J.
1985. A study of ITCZ over Pacific ocean by using satellite cloudiness data. Journal of Tropical Meteorology, 1(3): 269-276.
|
|
Gruber A, Su X J, Kanamitsu M, et al.
2000. The comparison of two merged rain gauge-satellite precipitation datasets. Bulletin of the American Meteorological Society, 81(11): 2631-2644.
DOI:10.1175/1520-0477(2000)081<2631:TCOTMR>2.3.CO;2 |
|
Hiroto A, Tanimoto Y, Hasegawa T, et al.
2014. Oceanic Rossby waves induced by the meridional shift of the ITCZ in association with ENSO events. Journal of Oceanography, 70(2): 165-174.
DOI:10.1007/s10872-014-0220-1 |
|
Jiang S C.
1988. The climatic characteristics of the ITCZ all over the globe. Acta Meteorologica Sinica, 46(2): 241-245.
|
|
Kao H Y, Yu J Y.
2009. Contrasting eastern-Pacific and central-Pacific types of ENSO. Journal of Climate, 22(3): 615-632.
DOI:10.1175/2008JCLI2309.1 |
|
Kug J S, Jin F F, An S I.
2009. Two types of El Niño events:Cold tongue El Niño and warm pool El Niño. Journal of Climate, 22(6): 1499-1515.
DOI:10.1175/2008JCLI2624.1 |
|
Larkin N K, Harrison D E.
2005. On the definition of El Niño and associated seasonal average U.S. weather anomalies. Geophysical Research Letters, 32(13): L13705.
DOI:10.1029/2005GL022738 |
|
Lengaigne M, Vecchi G A.
2010. Contrasting the termination of moderate and extreme El Niño events in coupled general circulation models. Climate Dynamics, 35(2): 299-313.
|
|
Ma L P. 2009. The impacts of climate change on tropical cyclone activities (in Chinese). Nanjing:Nanjing University of Information Science & Technology.
|
|
Philander S G H, Gu D, Halpern D, et al.
1996. Why the ITCZ is mostly north of the equator. Journal of Climate, 9(12): 2958-2972.
DOI:10.1175/1520-0442(1996)009<2958:WTIIMN>2.0.CO;2 |
|
Qin J Z, Wang Y F.
2014. Construction of new indices for the two types of ENSO events. Acta Meteorological Sinica, 72(3): 526-541.
|
|
Riehl H. 1954. Tropical Meteorology. New York:McGraw-Hill Book, 392.
|
|
Stanfield R E, Jiang J H, Dong X Q, et al.
2016. A quantitative assessment of precipitation associated with the ITCZ in the CMIP5 GCM simulations. Climate Dynamics, 47(5-6): 1863-1880.
DOI:10.1007/s00382-015-2937-y |
|
Sui X X, Wang Q.
2011. The seasonal and interannual features of ascending motion intensity and position in the intertropical convergence zone in the North Pacific. Periodical of Ocean University of China, 41(4): 19-27.
|
|
Vecchi G A, Harrison D E.
2006. The termination of the 1997-98 El Niño. Part I:mechanisms of oceanic change. Journal of Climate, 19(12): 2633-2646.
DOI:10.1175/JCLI3776.1 |
|
Wang C C, Magnusdottir G.
2006. The ITCZ in the central and eastern Pacific on synoptic time scale. Monthly Weather Review, 134(5): 1405-1421.
DOI:10.1175/MWR3130.1 |
|
Wei D N, Sun J L, Li Y P.
2008. Analysis of the anomalous strength and location of the ITCZ affecting the formation of northern Pacific typhoon. Journal of Ocean University of China, 7(2): 124-130.
DOI:10.1007/s11802-008-0124-z |
|
Weng H, Behera S K, Yamagata T.
2009. Anomalous winter climate conditions in the Pacific rim during recent El Niño Modoki and El Niño events. Climate Dynamics, 32(5): 663-674.
DOI:10.1007/s00382-008-0394-6 |
|
Xie P P, Arkin P A.
1998. Global monthly precipitation estimates from satellite-observed outgoing longwave radiation. Journal of Climate, 11(2): 137-164.
DOI:10.1175/1520-0442(1998)011<0137:GMPEFS>2.0.CO;2 |
|
Xie R H, Huang F, Jin F F, et al.
2014. The impact of basic state on quasi-biennial periodicity of central Pacific ENSO over the past decade. Theoretical and Applied Climatology, 120(1-2): 55-67.
|
|
Xie R H, Yang Y X.
2014. Revisiting the latitude fluctuations of the eastern Pacific ITCZ during the central Pacific El Niño. Geophysical Research Letters, 41(22): 7770-7776.
DOI:10.1002/2014GL061857 |
|
Xie S P, Philander S G H.
1994. A coupled ocean-atmosphere model of relevance to the ITCZ in the eastern Pacific. Tellus, 46(4): 340-350.
DOI:10.3402/tellusa.v46i4.15484 |
|
Xie S P.
1996. Westward propagation of latitudinal asymmetry in a coupled ocean-atmosphere model. Journal of Atmospheric Sciences, 53(22): 3236-3250.
DOI:10.1175/1520-0469(1996)053<3236:WPOLAI>2.0.CO;2 |
|
Xu H M, Xie S P, Wang Y P, et al.
2005. Effects of central American mountains on the eastern Pacific winter ITCZ and moisture transport. Journal of Climate, 18(18): 3856-3873.
DOI:10.1175/JCLI3497.1 |
|
范蕙君.
1985. 用平均云量图分析太平洋热带辐合带. 热带气象, 1(3): 269–276.
|
|
蒋尚城.
1988. 全球ITCZ的气候特征研究. 气象学报, 46(2): 241–245.
DOI:10.11676/qxxb1988.030 |
|
马丽萍. 2009. 气候变化对热带气旋活动的影响[博士论文]. 南京: 南京信息工程大学.
http://cdmd.cnki.com.cn/Article/CDMD-10300-2009095573.htm |
|
秦坚肇, 王亚非.
2014. 构建描述两种ENSO类型的新指数. 气象学报, 72(3): 526–541.
DOI:10.11676/qxxb2014.023 |
|
隋晓霞, 王启.
2011. 北太平洋热带辐合带区上升运动的季节和年际变化特征. 中国海洋大学学报, 41(4): 19–27.
|
|
 2018, Vol. 61


