2. 中国科学院大学, 北京 100049;
3. 中国地震局地球物理研究所, 北京 100081;
4. 中国地质科学院地球物理地球化学勘察研究所, 河北廊坊 065000
2. University of Chinese Academy of Sciences, Beijing 100049, China;
3. Institute of Geophysics, China Earthquake Administration, Beijing 100081, China;
4. Institute of Geophysical and Geochemical Exploration, Langfang Hebei 065000, China
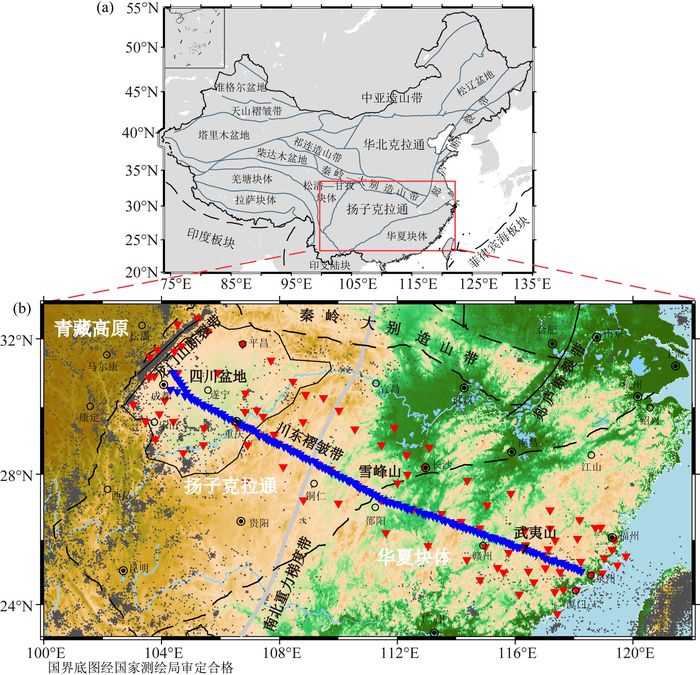
华南块体位于欧亚板块、印度洋板块和太平洋板块的交汇地带, 东临西太平洋边缘海,北侧通过秦岭—大别造山带与华北克拉通相连,西侧经过龙门山断裂带与青藏高原相邻,南接印支陆块,东南与菲律宾板块相接(图 1).现今华南块体属于较稳定的地区,地震活动性较低,内部变形少.但是其西侧受青藏高原隆升和扩展相关构造活动的影响,地震活动频繁,壳幔变形强烈(王琪, 2003).

|
图 1 研究区构造背景和地震台站分布 (a)中国构造分区图,蓝色粗实线代表构造分界线,黑色粗虚线代表印度板块和菲律宾海板块边界,红色实框代表研究区域;(b)研究区域、历史地震和地震台站分布图,蓝色倒三角代表流动台站,红色倒三角代表所用国家台网固定台站,深灰色小圆点代表地震震中位置(1965—2017,3<MS<9),黑色虚线代表构造分界线,浅灰色粗线代表南北重力梯度带. Fig. 1 Study region and stations (a) Tectonic map of China. Thick blue solid lines denote the tectonic boundaries, thick black dashed lines denote the boundaries of the India Plate and the Philippine Plate, red solid rectangle marks the study region; (b) Surface topography, seismicity and the distribution of stations. Blue inverted triangles denote the portable stations, red inverted triangles denote the permanent stations, dark gray dots denote the epicenter of the earthquakes(1965—2017, 3 < MS < 9), black dashed lines outline the primary tectonic boundaries, light gray solid line marks the North-South Gravity Lineament. |
华南块体内部构造及演化是大陆动力学研究的热点问题.华南块体是扬子克拉通与华夏块体在新元古代碰撞拼合所形成的(Li et al., 1993; Charvet et al., 1996).在其东北部,江绍断裂带被认为是扬子克拉通与华夏块体的碰撞缝合带,但该断裂带在西南段的延伸位置还存在较大分歧(杨明桂等, 2009; 饶家荣等, 2012),华南块体深部结构研究有助于了解其陆内块体特征和构造边界问题.另一方面,华南块体与华北克拉通在三叠纪通过碰撞拼合,共同组成了中国大陆东部.大量研究表明,华北克拉通东部显生宙以来已丧失了克拉通特有的稳定性,成为古老克拉通遭受破坏的最典型地区(Carlson et al., 2005; Zhu et al., 2011).华北克拉通显生宙改造和破坏只是中国东部这一时期构造演化的局部表现,其深部过程必然与紧邻的华南块体演化密切相关.对华南块体及其邻区深部结构开展详细研究,是深入认识中国东部显生宙整体演化的必要环节.
岩石圈结构,一直是大陆动力学研究的重要内容.近年来,随着观测数据的增加,观测技术的进步和分析方法的提高,华南大陆岩石圈结构研究取得了迅速发展,如大地电磁测深(刘国兴等, 2012; 张乐天等, 2012)、主动源深地震探测(熊小松等, 2009; Gao et al., 2016)、接收函数(Ai et al., 2007; Hu et al., 2011; Li et al., 2013)和层析成像研究(Huang and Zhao, 2006; Zhao et al., 2012; Bao et al., 2015; He and Santosh, 2016)等.然而,由于方法本身或者数据分布有限,前人的研究还存在一些局限性.例如,主动源类的方法探测深度不足,成本高;现有接收函数研究往往局限于少量台站或是局部区域;层析成像分辨率不够高,对间断面结构不敏感等等.对华南块体岩石圈的精细结构,包括不同块体和不同构造单元的岩石圈结构差异和接触关系等,仍缺乏深入认识.
密集流动地震台阵探测是获取区域岩石圈精细结构信息的有效手段.本文基于跨华南块体各构造单元的130个流动地震台站及其附近90个国家或省级固定台网台站的观测资料,采用S波接收函数波动方程叠后偏移方法,开展华南大陆岩石圈结构的地震学成像研究.通过岩石圈结构图像及其它地球物理、地质和构造等观测结果相结合,研究华南块体重要构造单元的现今岩石圈结构特征和性质,并探讨与之相关的构造演化和深部动力学过程.
1 数据与方法 1.1 数据2009年12月至2013年9月,在国家专项《深部探测技术实验与集成》和国家科技重大专项《深层油气成藏规律、关键技术及与目标预测》联合资助下,中国科学院地质与地球物理研究所地震台阵实验室在华南块体和青藏高原东北部实施完成了一条包括186个台站的线性流动地震台阵剖面观测.该剖面近似呈北西-南东向,东始于福建泉州,经贵州铜仁和四川成都,西至青海海南州,长度超过2500 km.观测剖面跨越了华夏块体、扬子克拉通、松潘—孜块体、西秦岭造山带等不同构造块体,武夷山、雪峰山、龙门山等构造带,以及南北重力梯度带.整个线性台阵共分四期布设完成,每个台站有效观测时间至少为12个月至18个月;台间距为10~20 km,在构造单元边界和构造带附近台间距根据场地条件加密至5~8 km不等.所用仪器大部分为带宽50 Hz—30 s/60 s的Güralp CMG-3ESP地震计,少部分为带宽50 Hz—120 s的CMG-3T地震计,采集器主要为Reftek 130型及Reftek 72A型.根据台间距、场地条件和背景噪音水平等差别,不同频带宽度仪器穿插布设.本文利用这条线性流动台阵中位于华南块体内(龙门山断裂带以东)的130个地震台站的观测资料开展结构成像研究(图 1,蓝色倒三角).
为了进一步增加对研究区的数据覆盖,提高成像结果的可靠性,我们同时收集了所用流动台阵附近国家台网和省级台网的90个固定台站数据(郑秀芬等, 2009)(图 1,红色倒三角).这些固定台站距离流动台站一般不超过200 km, 所用数据采集周期为2010年6月至2012年9月,期间地震计的方向矫正已经完成(Niu and Li, 2011).
本研究中我们选取震中距在55°—85°范围内,震级大于5.5级的远震事件.由于流动地震台阵分不同期次布设,时间跨度较大,需要分别选取不同时间段内的远震事件,故涉及的地震事件较多.经过人工挑选除去数据质量较差的事件,本研究最终用到的远震事件共计516个,震中分布如图 2a所示.这些地震事件分布于研究区的不同方位,以东南方向居多.

|
图 2 地震事件、S波接收函数个数分布和剖面位置 (a)远震事件分布,红色实框为本文研究区域,圆形代表远震事件;(b)各地震台站中S波接收函数个数分布; (c) Sp转换波穿透点位置、成像剖面和叠加单元分布.红色圆点代表在100 km处的穿透点位置,蓝色圆点代表在150 km处的穿透点位置,黑色倒三角代表地震台站位置,绿色实线代表成像剖面位置,绿色虚线代表剖面成像的投影区域,黑色虚线代表图 4中对应的叠加单元. Fig. 2 Earthquakes, S-receiver function numbers and imaging profiles (a) Distribution of the earthquakes. Red solid rectangle marks the study region, circles denote the teleseismic events; (b) The number of the S-receiver functions in each station; (c) Piercing points, imaging profiles and stacking blocks. The piercing points at 100 km depth for Sp converted phases are denoted as red dots, the piercing points at 150 km depth for Sp converted phases are denoted as blue dots, green solid lines are imaging profiles, the green dashed rectangle around each profile marks the area where the S receiver functions are projected onto the profile for imaging, the black dashed rectangle denotes the stacking block in Fig. 4. |
S波接收函数最早由(Farra and Vinnik, 2000)提出,来自上地幔浅部间断面的Sp转换波可以避免壳内多次波的干扰(Oreshin et al., 2002; Yuan et al., 2006),因此被广泛地用于上地幔间断面,特别是岩石圈底界面(LAB)结构的研究中.我们首先对选取的原始三分量地震记录进行预处理(包括去仪器响应、去平均值、去线性趋势和初步的滤波),然后将Z、N和E三个分量旋转到Z、R(径向)和T(切向)方向,再以S波理论到时为基准截取向前150 s、向后20 s的地震记录用于接收函数的计算.本研究采用时间域最大熵谱反褶积方法(吴庆举和曾融生, 1998)计算S波接收函数,所选取的高斯系数为2.5,水准量为0.001.计算获得S波接收函数后,将其时间坐标和振幅进行反转,使之与P波接收函数可对比.最后,对S波接收函数进行再次滤波和严格的手工挑选,遵循相近方位角波形相似原则,选取初动S波震相显著、Moho界面Sp转换波震相清晰、信噪比高的接收函数.经过一系列处理,总共获得了来自于220个台站516个远震事件的4973条高质量S波接收函数(图 2b).
1.3 波动方程叠后偏移成像本研究中S波接收函数成像采用由Chen等(2005)提出的基于波动方程的接收函数叠后偏移方法.该方法采用频率域波动方程波场传播算子,通过对共转换点(CCP)叠加后的接收函数进行反向波场延拓,来获得高精度的地下间断面结构图像.由于可以有效地处理横向速度变化,偏移图像与通常的CCP叠加图像相比,在压制噪声、恢复结构横向变化特征等方面表现出明显的优越性,因此特别适用于研究结构复杂或信号较弱的深部间断面.该方法已经在华北克拉通地壳-上地幔间断面的研究中取得了较好的效果(Chen, 2009; Chen and Ai, 2009; Chen et al., 2014).
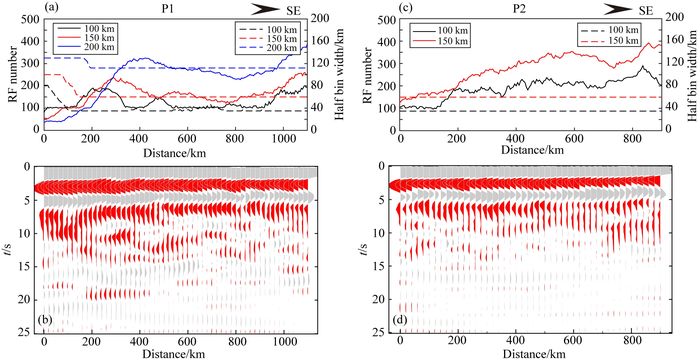
本研究采用对一维IASP91模型用中国东部平均地壳结构做了修正后的速度模型(Chen et al., 2006),计算Sp转换波到时和穿透点位置,并进行偏移成像.对S波接收函数都进行了动矫正,对应的参考射线参数为P=0,即矫正到从下方垂直入射的情况.根据台站分布、地震事件分布、地震射线穿透点位置和区域构造特点,我们最终在研究区设计了P1、P2两条剖面(图 2c)用以成像.实际处理中,该偏移成像方法分为两步:时间域CCP叠加和频率域波场反向延拓(Chen et al., 2005, 2008).在时间域CCP叠加中,叠加单元形状为长方形,沿剖面步长为5 km.叠加单元垂直于剖面方向的宽度保持不变(160 km),平行于剖面方向的长度则可根据数据分布情况变化.为了能通过叠加有效压制噪声,提高信噪比,保证成像结果的可靠性,我们限定叠加单元中最少接收函数个数为100.在频率域波场反向延拓中,我们对不同的频率范围进行成像测试.在深部结构研究中,接收函数的高频成分会被滤掉以消除噪音.目标间断面越深,滤波对应的截止频率就越低,但是过低的截止频率又会造成分辨率不足.综合考虑岩石圈底界面深度范围、分辨率要求和S波的低频特征,本研究中S波接收函数偏移成像所用的频率下限为0.03 Hz,上限介于0.3~0.5 Hz之间.
2 成像结果据图 3a, 3c所示,两条剖面在不同的目标深度处,叠加单元内的接收函数个数基本上都超过了100,大部分在200~300之间.在P1剖面最西端(图 3a),因为靠近台阵边缘和地震事件分布的不均匀性(大部分来自于西太平洋),叠加单元中接收函数个数不足100.在时间域CCP叠加图像中(图 3b, 3d),来自于Moho面的Sp转换波震相和它负的旁瓣是最强的信号.在本文的岩石圈结构研究中,我们主要关注更深部的结构信号.图 4给出了几个典型叠加单元S波接收函数叠加结果,从中可以比较清晰地识别出LAB信号和层内的负异常信号,不同区域的叠加结果差异明显.

|
图 3 S波接收函数叠加参数和时间域CCP叠加结果 (a, c)叠加参数资料图,实线代表叠加单元中接收函数个数变化,虚线代表叠加单元平行于剖面方向宽度的变化,不同颜色代表不同深度;(b, d)时间域CCP叠加结果,频率范围为0.03~0.5 Hz. Fig. 3 Parameters for stacking and time domain CCP stacking results (a, c) Statistics for stacking. Solid lines denote the numbers of the receiver functions in the bins, dashed lines denote the bin widths parallel to the profile, different color represents different depths; (b, d) Time domain stacked S-receiver function sections. Frequency: 0.03~0.5 Hz. |

|
图 4 S波接收函数时间域CCP叠加实例 叠加单元位置如图 2所示,图中粗黑色箭头指向来自于LAB的信号,细黑色箭头指向来自于岩石圈内部间断面的信号. Fig. 4 S-receiver function stacking results for individual stacking block Stacking blocks are shown in Fig. 2, thick black arrows mark the Sp conversion from the LAB, thin black arrows mark the Sp conversion from the mid-lithospheric discontinuity. |
图 5给出了对两条时间域CCP叠加剖面进行波场反向延拓后的偏移图像.图中红色代表由浅到深速度增加的间断面(如Moho面)所产生的信号,蓝色代表由浅到深速度降低的间断面(如岩石圈底界面)所产生的信号.在识别间断面结构信号时,我们遵循以下几个原则:(1)叠加单元内的接收函数个数尽可能多,有助于压制噪声;(2)间断面信号较强,且能够连续追踪;(3)间断面信号在不同的频率范围内的成像结果具有一致性;(4)在不同剖面的重合位置,结构特征相一致;(5)提取到的结构特征与该地区已有地球物理和地质观测较为吻合;(6)不过多关注剖面边缘的结构,因为在偏移过程中剖面边缘位置可能会由于数据较少而产生虚假信号.

|
图 5 地形及构造分区和偏移图像 (a, e)沿剖面地形和构造分区图,深灰粗实线代表块体边界,深灰细虚线代表块体内部构造边界,浅灰粗实线代表南北重力梯度带;(b—d, f—h) S波接收函数叠后偏移图像; (b, f) 0.03~0.3 Hz; (e, g) 0.03~0.4 Hz; (d, h) 0.03~0.5 Hz,黑色虚线代表识别的岩石圈底界面LAB, 白色虚线代表P1剖面和P2剖面的交叉位置. Fig. 5 Topography, tectonic units and migrated images (a, e) Topography and tectonic units along the profile. Thick dark gray solid lines denote the block boundary, thin dark gray dashed lines denote the inner tectonic boundaries, light gray solid line marks the North-South Gravity Lineament; (b—d, f—h) Migrated images for each profile; (b, f) 0.03~0.3 Hz; (e, g) 0.03~0.4 Hz; (d, h) 0.03~0.5 Hz, black dashed lines denote the identified LAB, white dashed lines denote the crossover position of profile P1 and profile P2. |
(1) P1剖面
该剖面长度为1100 km,方位角为118°,最西端位于四川盆地,向东穿过川东褶皱带、南北重力梯度带和雪峰山,止于华夏块体之内(图 5a).沿剖面地壳有自西向东变薄的趋势(图 5b—5d),四川盆地的地壳厚度可达45~50 km,在盆地以东至华夏块体西部,地壳厚度在35~40 km范围内变化,值得注意的是在雪峰山下方地壳厚度有明显的小尺度变化.根据不同频率的偏移图像,识别出该剖面的LAB如图 5b—5d中黑色虚线所示.在四川盆地之下,偏移图像一致地显示出多个强的负异常信号,我们最终将最深处(~190 km)的负异常信号识别为LAB.这主要出于三个方面的考虑:(1) ~190 km处的负异常信号很强,且在不同频率图像中一致性好;(2)如果较浅部的负异常信号代表LAB,那么更深处的负异常信号反映了软流圈内存在强的波速下降间断面结构,这从地球动力学的角度是不合理的;(3)深约190 km的岩石圈与四川盆地现有的地球物理学资料符合较好.LAB信号之上的强负异常信号可能反映了厚岩石圈内部的波速下降间断面.此外,在南北重力梯度带下方~160 km深度处,还存在着一个比较强的负信号.考虑到该信号只在局部出现,在高频图像中强度明显减弱(图 5d),且与上方的强正异常信号伴生,我们认为其可能代表局部的异常体或者仅仅是上方强正异常信号的旁瓣,在本文中不做过多关注.但是,该异常信号的存在说明川东褶皱带下方的上地幔结构可能比较复杂.
总体看来,沿P1剖面岩石圈结构复杂,LAB起伏明显.四川盆地的岩石圈最厚,可达~190 km,且在岩石圈内部存在两个减速间断面,深度分别为~100 km和~130 km.从四川盆地进入川东褶皱带后,岩石圈迅速变薄为~120 km,且有向东进一步缓慢变薄的趋势.在雪峰山下方,岩石圈明显加厚,从两侧的不足100 km变为~120 km,与之对应的LAB信号明显变弱且离散化.
(2) P2剖面
该剖面长度为900 km,方位角为108°,西起雪峰山东侧,经武夷山,东至台湾海峡(图 5e).根据高频偏移图像(图 5h),沿剖面地壳厚度约为30~35 km,有自西向东缓慢变小的趋势.相比扬子克拉通地区,该条剖面中的LAB信号深度浅且强度较弱,在低频图像中(图 5f)很容易受其它信号和Moho面旁瓣的影响,变得不连续;但是该LAB信号在高频图像中(图 5g, h)可以连续追踪,分辨率也较高.这条剖面与P1剖面在交会处的成像结果一致性好(图 5白色虚线),岩石圈在雪峰山下方可以达到~120 km.雪峰山以东至东南沿海区域的岩石圈厚度为~80-100 km,最厚的岩石圈位于剖面东端滨海地区(~100 km),最薄的岩石圈位于武夷山西侧(~80 km).
3 分析和讨论根据本文获得的S波接收函数偏移图像(图 5),我们对华南块体的岩石圈结构有了新的认识.地壳整体西厚东薄,且在构造边界带附近表现为小尺度变化:四川盆地的地壳厚度可达~45-50 km,华夏块体的地壳厚度仅为~30-35 km.我们的观测与前人的研究结果(e.g., Ai et al., 2007; 熊小松等, 2009; Li et al., 2013; Gao et al., 2016; Wei et al., 2016)基本一致.虽然将S波接收函数应用于地壳结构研究分辨率较低,本文不做重点关注;但是所得地壳结构和其它地球物理观测结果的一致性从侧面验证了本文叠加偏移成像结果的可靠性.
研究区域的岩石圈结构比较复杂,不同构造单元岩石圈结构差异显著,边界带附近小尺度变化强烈(图 4,图 5):厚的岩石圈主要位于四川盆地,薄的岩石圈主要分布于川东褶皱带和华夏块体,雪峰山下方的岩石圈有20~30 km增厚.下文我们将结合多学科观测结果,对主要构造带以及不同构造单元的岩石圈结构和性质展开进一步讨论,并探讨与之相关的构造演化和深部地幔动力学过程.
3.1 四川盆地的克拉通属性四川盆地位于扬子克拉通西北部,是我国西南地区惟一的大型中生代前陆盆地,新生代时期其西缘与青藏高原相互作用强烈(图 1).S波接收函数成像结果显示,四川盆地下方岩石圈底界面深达~190 km,且在~100 km和~130 km深度处存在强的岩石圈地幔内部波速下降间断面(图 5b—5d).四川盆地厚的岩石圈结构与体波层析成像显示的该地区上地幔浅部为高速异常的特征(Zhao et al., 2012; Huang et al., 2015)和盆地内部稀少的地震活动(图 1)相一致,反映四川盆地之下还保留着厚而冷的岩石圈地幔根,并保持着克拉通构造稳定的基本属性.我们在四川盆地下方观测到岩石圈地幔内部存在波速下降间断面的结果,与最近获得的鄂尔多斯岩石圈结构地震学图像(Chen et al., 2014)以及全球范围内其它很多克拉通地区的观测结果(Ford et al., 2010; Wölbern et al., 2012; Foster et al., 2014; Knapmeyer-Endrun et al., 2017)类似,进一步证明克拉通岩石圈地幔普遍具有分层性.
四川盆地的克拉通岩石圈结构特征和属性在区域演化,特别是西侧青藏高原的构造演化中起了重要作用.由于新生代印度板块向欧亚大陆的碰撞和俯冲,造成了青藏高原的隆升扩展和深部物质的侧向挤出(Willett and Beaumont, 1994).四川盆地正处于现今高原扩展和侧向挤出的前缘.青藏高原下方物质的挤出方向之所以会在龙门山断裂带西侧发生转向(Clark and Royden, 2000),并伴随壳幔变形方向和程度的改变(Gan et al., 2007; 常利军等, 2008a, b; Zhang et al., 2012),可能正是因为四川盆地厚而高强度的克拉通岩石圈根的阻挡作用.
3.2 雪峰山构造带雪峰山构造带经历了漫长的形成和演化过程,构造十分复杂(褚杨等, 2011; Chu et al., 2012).本文的S波接收函数叠加偏移图像中(图 5b—5d),雪峰山地区岩石圈结构表现出以下特征:首先,岩石圈厚度在雪峰山下方明显增加20~30 km,对应的LAB Sp转换波信号明显变弱且离散化.雪峰山附近特殊的岩石圈结构可能反映了雪峰山构造带下方复杂的构造变形特征.其次,雪峰山东西两侧的岩石圈结构横向变化显著:雪峰山以东区域,岩石圈厚度较薄(80~110 km),对应的LAB Sp转换波信号连续但强度较弱;以西区域岩石圈整体较厚,局部起伏较大,岩石圈上地幔结构复杂,对应的LAB Sp转换波信号不连续但强度很强.
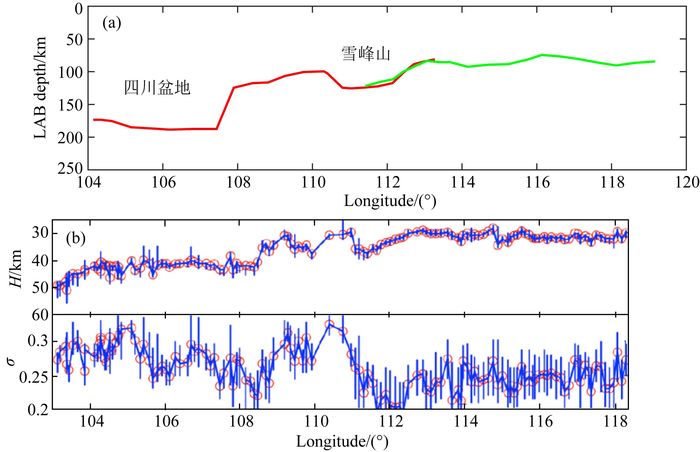
在其它的地球物理学观测资料中,雪峰山附近也经常可以观测到明显的东西差异.沿泉州—松潘剖面的P波接收函数H-κ叠加图像(图 6b)显示,大致以雪峰山为界,地壳厚度存在明显的东西差异:东侧地壳厚度为~30 km,西侧则在40~50 km范围变化;雪峰山下方地壳平均VP/VS变化剧烈.远震体波层析成像(Zhao et al., 2012)结果中,在120~300 km的上地幔浅部,雪峰山以西表现为S波高速异常,以东表现为S波低速异常.SKS横波分裂结果显示(Zhao et al., 2013),雪峰山两侧快波极化方向表现出从东到西的空间变化:东侧快波极化方向主体为北东—南西方向,而西侧快波极化方向变化复杂,但与区域构造的走向大致平行.

|
图 6 岩石圈和地壳结构对比 (a) LAB分布图,红色是P1剖面结果,绿色是P2剖面结果;(b) H-κ叠加结果(Wei et al., 2016). Fig. 6 Comparison of the lithospheric structure and the crustal structure (a) The distribution of the LAB in this study. Red line for profile P1 and green line for profile P2; (b) H-κ stacking results(Wei et al., 2016). |
这些观测综合表明,华南大陆以雪峰山为界,在整个岩石圈尺度上都存在显著的东西差异,反映了两侧地块具有不同的岩石圈结构和性质.我们认为雪峰山是扬子克拉通与华夏块体岩石圈尺度的构造边界,扬子克拉通与华夏块体的现今构造边界很可能从江绍断裂带沿雪峰山向西南延伸.
3.3 华南大陆的岩石圈减薄中生代以来,中国东部经历了强烈的岩石圈活化过程.尤其是在古太平洋俯冲作用影响下,华北克拉通东部遭受强烈破坏,岩石圈厚度从古生代~200 km减薄到现今~80 km,而其中-西部岩石圈只经历局部改造,主体仍保持克拉通的结构和性质(Chen, 2010; 朱日祥等, 2012);华南块体中生代以来也经历了大规模岩浆作用(Zhou and Li, 2000; Zhou et al., 2006; Shu et al., 2009)和强烈变质变形(Li and Li, 2007; 张国伟等, 2013).
本文成像结果显示(图 5),雪峰山以东的华夏块体岩石圈很薄,厚度不足100 km,与雪峰山以西四川盆地之下厚达~190 km的岩石圈和川东褶皱带下方复杂的上地幔结构明显不同.另外,华夏块体和雪峰山之下岩石圈底界面的Sp转换波信号和其它区域相比明显较弱(图 4).而Sp转换波信号的强弱可以反映出间断面的性质,例如间断面处的速度跳变,间断面的厚度等.区域远震层析成像结果(Huang et al., 2010; Zhao et al., 2012; Zheng et al., 2013)显示, 华南大陆东南部分(主要为华夏块体)上地幔存在显著P波低速异常.大地电磁观测获得的电性岩石圈结构(刘国兴等, 2012)与本文得到的地震学岩石圈结构相似,也显示华夏块体岩石圈东西两端较厚(>100 km),而中部则显著减薄.综合上述地球物理观测,我们认为,雪峰山以东的华夏块体在中生代以来强烈的岩浆-构造活动和变质变形作用下,岩石圈被显著改造,其结构和性质已经发生了明显改变.
华北地区的研究表明,岩石圈厚度变化梯度最大的位置一致位于南北重力梯度带东侧100~200 km(Chen, 2010).在华南地区,岩石圈结构和性质发生显著变化的雪峰山造山带,同样位于南北重力梯度带以东100~200 km位置(图 1,图 5a—5d).华南和华北观测结果的一致性表明,南北重力梯度带既是大陆内部构造演化复杂性的具体反映,又是联系中国东部显生宙构造演化的重要纽带.此外,我们发现华南地区岩石圈最薄的区域在华夏块体中部,且LAB起伏与地形有对应关系(图 5e—5h).这与华北东部岩石圈厚度向东变薄的观测(Chen et al., 2010; Zhu et al., 2011)不同.我们推测华南地区现今岩石圈结构可能不仅受到中生代以来太平洋板块俯冲的影响,也受到早期多期次陆块拼贴和陆内造山、新生代菲律宾海板块俯冲以及南海打开与演化等构造事件的综合影响.
4 结论本文基于华南大陆130个流动地震台站及附近90个固定台站的观测资料,采用S波接收函数波动方程叠后偏移成像方法,开展了区域岩石圈结构研究,取得了以下新认识:
(1) 华南大陆不同构造单元岩石圈结构差异显著,构造边界带附近小尺度变化强烈.150 km以上的厚岩石圈主要位于四川盆地,100 km以下的薄岩石圈主要分布于川东褶皱带和华夏块体.
(2) 四川盆地下方岩石圈厚度约为190 km,且存在岩石圈内部间断面,符合稳定克拉通的特征,说明四川盆地还保留着厚而冷的克拉通岩石圈根.
(3) 雪峰山下方岩石圈明显增厚20~30 km,且以雪峰山为界岩石圈结构和性质存在东西差异.扬子克拉通与华夏块体现今的构造边界可能从江绍断裂带向南西延伸至雪峰山.
(4) 华南和华北岩石圈的强烈减薄都发生在南北重力梯度带以东地区,反映了南北重力梯度带既是大陆内部构造演化复杂性的具体反映,又是联系中国东部显生宙构造演化的重要纽带.
致谢感谢中国科学院地质与地球物理研究所地震台阵实验室提供流动地震数据资料,感谢中国地震局地球物理研究所国家数字测震台网数据备份中心为本研究提供固定台站地震波形数据,感谢侯广兵、任国朝、程骋、危自根、赵明、郑天愉、何玉梅等在华南剖面野外观测数据采集工作中的辛勤付出,感谢两位匿名审稿人提出的建设性意见.
Ai Y S, Chen Q F, Zeng F, et al.
2007. The crust and upper mantle structure beneath southeastern China. Earth and Planetary Science Letters, 260(3-4): 549-563.
DOI:10.1016/j.epsl.2007.06.009 |
|
Bao X W, Song X D, Li J T.
2015. High-resolution lithospheric structure beneath Mainland China from ambient noise and earthquake surface-wave tomography. Earth and Planetary Science Letters, 417: 132-141.
DOI:10.1016/j.epsl.2015.02.024 |
|
Carlson R W, Pearson D G, James D E.
2005. Physical, chemical, and chronological characteristics of continental mantle.. Reviews of Geophysics, 43(1): RG1001.
|
|
Chang L J, Wang C Y, Ding Z F, et al.
2008a. Seismic anisotropy of upper mantle in the northeastern margin of the Tibetan Plateau. Chinese Journal of Geophysics, 51(2): 431-438.
DOI:10.3321/j.issn:0001-5733.2008.02.015 |
|
Chang L J, Wang C Y, Ding Z F.
2008b. Seismic anisotropy of upper mantle in Sichuan and adjacent regions. Science in China Series D:Earth Sciences, 51(12): 1683-1693.
DOI:10.1007/s11430-008-0147-8 |
|
Charvet J, Shu L S, Shi Y S, et al.
1996. The building of south China:collision of Yangzi and Cathaysia blocks, problems and tentative answers. Journal of Southeast Asian Earth Sciences, 13(3-5): 223-235.
DOI:10.1016/0743-9547(96)00029-3 |
|
Chen L, Wen L X, Zheng T Y.
2005. A wave equation migration method for receiver function imaging:1. Theory. Journal of Geophysical Research:Solid Earth, 110(B11): B11309.
|
|
Chen L, Zheng T Y, Xu W W.
2006. A thinned lithospheric image of the Tanlu Fault Zone, eastern China:Constructed from wave equation based receiver function migration. Journal of Geophysical Research:Solid Earth, 111(B9): B09312.
|
|
Chen Y L, Niu F L, Liu R F, et al.
2010. Crustal structure beneath China from receiver function analysis. Journal of Geophysical Research-Solid Earth, 115(B3): B03307.
|
|
Chen L, Ai Y S.
2009. Discontinuity structure of the mantle transition zone beneath the North China Craton from receiver function migration. Journal of Geophysical Research:Solid Earth, 114(B6): B06307.
|
|
Chen L.
2009. Lithospheric structure variations between the eastern and central North China Craton from S-and P-receiver function migration. Physics of the Earth and Planetary Interiors, 173(3-4): 216-227.
DOI:10.1016/j.pepi.2008.11.011 |
|
Chen L.
2010. Concordant structural variations from the surface to the base of the upper mantle in the North China Craton and its tectonic implications. Lithos, 120(1-2): 96-115.
DOI:10.1016/j.lithos.2009.12.007 |
|
Chen L, Jiang M M, Yang J H, et al.
2014. Presence of an intralithospheric discontinuity in the central and western North China Craton:Implications for destruction of the craton. Geology, 42(3): 223-226.
DOI:10.1130/G35010.1 |
|
Chen L, Tao W, Zhao L, et al.
2008. Distinct lateral variation of lithospheric thickness in the northeastern North China Craton. Earth and Planetary Science Letters, 267(1-2): 56-68.
DOI:10.1016/j.epsl.2007.11.024 |
|
Chu Y, Lin W, Michel, et al.
2011. Tectonic evolution of the Early Mesozoic Xuefengshan belt:Insights from structural analysis and geochronological constrains. Chinese Journal of Geology, 46(1): 146-160.
|
|
Chu Y, Lin W, Faure M, et al.
2012. Phanerozoic tectonothermal events of the Xuefengshan Belt, central South China:Implications from UPb age and LuHf determinations of granites. Lithos, 150: 243-255.
DOI:10.1016/j.lithos.2012.04.005 |
|
Clark M K, Royden L H.
2000. Topographic ooze:Building the eastern margin of Tibet by lower crustal flow. Geology, 28(8): 703-706.
DOI:10.1130/0091-7613(2000)28<703:TOBTEM>2.0.CO;2 |
|
Farra V, Vinnik L.
2000. Upper mantle stratification by P and S receiver functions. Geophysical Journal International, 141(3): 699-712.
DOI:10.1046/j.1365-246x.2000.00118.x |
|
Ford H A, Fischer K M, Abt D L, et al.
2010. The lithosphere-asthenosphere boundary and cratonic lithospheric layering beneath Australia from Sp wave imaging. Earth and Planetary Science Letters, 300(3-4): 299-310.
DOI:10.1016/j.epsl.2010.10.007 |
|
Foster K, Dueker K, Schmandt B, et al.
2014. A sharp cratonic lithosphere-asthenosphere boundary beneath the American Midwest and its relation to mantle flow. Earth and Planetary Science Letters, 402: 82-89.
DOI:10.1016/j.epsl.2013.11.018 |
|
Gan W J, Zhang P Z, Shen Z K, et al.
2007. Present-day crustal motion within the Tibetan Plateau inferred from GPS measurements. Journal of Geophysical Research:Solid Earth, 112(B8): B08416.
|
|
Gao R, Chen C, Wang H Y, et al.
2016. SINOPROBE deep reflection profile reveals a Neo-Proterozoic subduction zone beneath Sichuan Basin. Earth and Planetary Science Letters, 454: 86-91.
DOI:10.1016/j.epsl.2016.08.030 |
|
He C S, Santosh M.
2016. Crustal evolution and metallogeny in relation to mantle dynamics:A perspective from P-wave tomography of the South China Block. Lithos, 263: 3-14.
DOI:10.1016/j.lithos.2016.06.021 |
|
Hu J F, Xu X Q, Yang H Y, et al.
2011. S receiver function analysis of the crustal and lithospheric structures beneath eastern Tibet. Earth and Planetary Science Letters, 306(1-2): 77-85.
DOI:10.1016/j.epsl.2011.03.034 |
|
Huang J L, Zhao D P.
2006. High-resolution mantle tomography of China and surrounding regions. Journal of Geophysical Research:Solid Earth, 111(B9): B03307.
|
|
Huang Z C, Wang L S, Zhao D P, et al.
2010. Upper mantle structure and dynamics beneath Southeast China. Physics of the Earth and Planetary Interiors, 182(3-4): 161-169.
DOI:10.1016/j.pepi.2010.07.010 |
|
Huang Z C, Wang P, Xu M J, et al.
2015. Mantle structure and dynamics beneath SE Tibet revealed by new seismic images. Earth and Planetary Science Letters, 411: 100-111.
DOI:10.1016/j.epsl.2014.11.040 |
|
Knapmeyer-Endrun B, Krüger F, Geissler W H.
2017. Upper mantle structure across the Trans-European Suture Zone imaged by S-receiver functions. Earth and Planetary Science Letters, 458: 429-441.
DOI:10.1016/j.epsl.2016.11.011 |
|
Li Q S, Gao R, Wu F T, et al.
2013. Seismic structure in the southeastern China using teleseismic receiver functions. Tectonophysics, 606: 24-35.
DOI:10.1016/j.tecto.2013.06.033 |
|
Li S G, Xiao Y L, Liou D L, et al.
1993. Collision of the North China and yangtse blocks and formation of coesite-bearing eclogites-timing and processes. Chemical Geology, 109(1-4): 89-111.
DOI:10.1016/0009-2541(93)90063-O |
|
Li Z X, Li X H.
2007. Formation of the 1300-km-wide intracontinental orogen and postorogenic magmatic province in Mesozoic South China:A flat-slab subduction model. Geology, 35(2): 179.
DOI:10.1130/G23193A.1 |
|
Liu G X, Han K, Han J T.
2012. Lithosphere electrical structure in Southeast coastal region, South China. Journal of Jilin University (Earth Science Edition), 42(2): 536-544.
|
|
Niu F L, Li J.
2011. Component azimuths of the CEArray stations estimated from P-wave particle motion. Earthquake Science, 24(1): 3-13.
DOI:10.1007/s11589-011-0764-8 |
|
Oreshin S, Vinnik L, Peregoudov D, et al.
2002. Lithosphere and asthenosphere of the Tien Shan imaged by S receiver functions. Geophysical Research Letters, 29(8): 32-1.
|
|
Rao J R, Xiao Y H, Liu Y R, et al.
2012. Location of the Yangtze-Cathaysia plate convergence zone in Hunan. Chinese Journal of Geophysics, 55(2): 484-502.
DOI:10.6038/j.issn.0001-5733.2012.02.012 |
|
Shu L S, Zhou X M, Deng P, et al.
2009. Mesozoic tectonic evolution of the Southeast China Block:New insights from basin analysis. Journal of Asian Earth Sciences, 34(3): 376-391.
DOI:10.1016/j.jseaes.2008.06.004 |
|
Wang Q.
2003. Current crustal movement in Chinese mainland. Acta Seismologica Sinica, 25(5): 541-547.
|
|
Wei Z G, Chen L, Li Z W, et al.
2016. Regional variation in Moho depth and Poisson's ratio beneath eastern China and its tectonic implications. Journal of Asian Earth Sciences, 115: 308-320.
DOI:10.1016/j.jseaes.2015.10.010 |
|
Willett S D, Beaumont C.
1994. Subduction of Asian lithospheric mantle beneath Tibet inferred from models of continental collision. Nature, 369(6482): 642-645.
DOI:10.1038/369642a0 |
|
Wölbern I, Rümpker G, Link K, et al.
2012. Melt infiltration of the lower lithosphere beneath the Tanzania craton and the Albertine rift inferred from S receiver functions. Geochemistry, Geophysics, Geosystems, 13(8): Q0AK08.
|
|
Wu Q J, Zeng R S.
1998. The crustal structure of Qinghai-Xizang plateau inferred from broadband teleseismic waveform. Acta Geophysica Sinica, 41(5): 669-679.
|
|
Xiong X S, Gao R, Li Q S, et al.
2009. The moho depth of south china revealed by seismic probing. Acta Geoscience Sinica, 30(6): 774-786.
|
|
Yang M G, Huang S B, Lou F S, et al.
2009. Lithospheric structure and large-scale metallogenic process in Southeast China continental area. Geology in China, 36(3): 528-543.
|
|
Yuan X H, Kind R, Li X Q, et al.
2006. The Sreceiver functions:synthetics and data example. Geophysical Journal International, 165(2): 555-564.
DOI:10.1111/gji.2006.165.issue-2 |
|
Zhang G W, Guo A L, Wang Y J, et al.
2013. Tectonics of South China continent and its implications. Science China:Earth Sciences, 56(11): 1804-1828.
DOI:10.1007/s11430-013-4679-1 |
|
Zhang H S, Teng J W, Tian X B, et al.
2012. Lithospheric thickness and upper-mantle deformation beneath the NE Tibetan Plateau inferred from Sreceiver functions and SKS splitting measurements. Geophysical Journal International, 191(3): 1285-1294.
|
|
Zhang L T, Jin S, Wei B W, et al.
2012. Electrical structure of crust and upper mantle beneath the eastern margin of Tibetan Plateau and the Sichuan basin. Chinese Journal of Geophysics, 55(12): 4126-4137.
DOI:10.6038/j.issn.0001-5733.2012.12.025 |
|
Zhao L, Allen R M, Zheng T Y, et al.
2012. High-resolution body wave tomography models of the upper mantle beneath eastern China and the adjacent areas. Geochemistry Geophysics Geosystems, 13(6): Q06007.
|
|
Zhao L, Zheng T Y, Lu G.
2013. Distinct upper mantle deformation of cratons in response to subduction:Constraints from SKS wave splitting measurements in eastern China. Gondwana Research, 23(1): 39-53.
DOI:10.1016/j.gr.2012.04.007 |
|
Zheng H W, Gao R, Li T D, et al.
2013. Collisional tectonics between the Eurasian and Philippine Sea plates from tomography evidences in Southeast China. Tectonophysics, 606: 14-23.
DOI:10.1016/j.tecto.2013.03.018 |
|
Zheng X F, Ouyang B, Zhang D N, et al.
2009. Technical system construction of Data Backup Centre for China Seismograph Network and the data support to researches on the Wenchuan earthquake. Chinese Journal of Geophysics, 52(5): 1412-1417.
DOI:10.3969/j.issn.0001-5733.2009.05.031 |
|
Zhou X M, Li W X.
2000. Origin of Late Mesozoic igneous rocks in Southeastern China:implications for lithosphere subduction and underplating of mafic magmas. Tectonophysics, 326(3-4): 269-287.
DOI:10.1016/S0040-1951(00)00120-7 |
|
Zhou X M, Sun T, Shen W Z, et al.
2006. Petrogenesis of Mesozoic granitoids and volcanic rocks in South China:A response to tectonic evolution. Episodes, 29(1): 26-33.
|
|
Zhu R X, Chen L, Wu F Y, et al.
2011. Timing, scale and mechanism of the destruction of the North China Craton. Science China-Earth Sciences, 54(6): 789-797.
DOI:10.1007/s11430-011-4203-4 |
|
Zhu R X, Xu Y G, Zhu G, et al.
2012. Destruction of the North China Craton. Science China:Earth Sciences, 55(10): 1565-1587.
DOI:10.1007/s11430-012-4516-y |
|
常利军, 王椿镛, 丁志峰, 等.
2008a. 青藏高原东北缘上地幔各向异性研究. 地球物理学报, 51(2): 431–438.
DOI:10.3321/j.issn:0001-5733.2008.02.015 |
|
常利军, 王椿镛, 丁志峰.
2008b. 四川及邻区上地幔各向异性研究. 中国科学:地球科学, 38(12): 1589–1599.
|
|
褚杨, 林伟, FaureM, 等.
2011. 雪峰山早中生代构造演化:构造学和年代学分析. 地质科学, 46(1): 146–160.
|
|
刘国兴, 韩凯, 韩江涛.
2012. 华南东南沿海地区岩石圈电性结构. 吉林大学学报(地球科学版), 42(2): 536–544.
|
|
饶家荣, 肖海云, 刘耀荣, 等.
2012. 扬子、华夏古板块会聚带在湖南的位置. 地球物理学报, 55(2): 484–502.
DOI:10.6038/j.issn.0001-5733.2012.02.012 |
|
王琪.
2003. 中国大陆现今地壳运动研究. 地震学报, 25(5): 541–547.
|
|
吴庆举, 曾融生.
1998. 用宽频带远震接收函数研究青藏高原的地壳结构. 地球物理学报, 41(5): 669–679.
|
|
熊小松, 高锐, 李秋生, 等.
2009. 深地震探测揭示的华南地区莫霍面深度. 地球学报, 30(6): 774–786.
|
|
杨明桂, 黄水保, 楼法生, 等.
2009. 中国东南陆区岩石圈结构与大规模成矿作用. 中国地质, 36(3): 528–543.
|
|
张国伟, 郭安林, 王岳军, 等.
2013. 中国华南大陆构造与问题. 中国科学:地球科学, 43(10): 1553–1582.
|
|
张乐天, 金胜, 魏文博, 等.
2012. 青藏高原东缘及四川盆地的壳幔导电性结构研究. 地球物理学报, 55(12): 4126–4137.
DOI:10.6038/j.issn.0001-5733.2012.12.025 |
|
郑秀芬, 欧阳飚, 张东宁, 等.
2009. "国家数字测震台网数据备份中心"技术系统建设及其对汶川大地震研究的数据支撑. 地球物理学报, 52(5): 1412–1417.
DOI:10.3969/j.issn.0001-5733.2009.05.031 |
|
朱日祥, 徐义刚, 朱光, 等.
2012. 华北克拉通破坏. 中国科学:地球科学, 42(8): 1135–1159.
|
|
 2018, Vol. 61


