 2017, Vol. 60


2. 中国科学院大学, 北京 100039
2. University of Chinese Academy of Sciences, Beijing 100039, China
印度板块和欧亚板块的相互碰撞形成了世界上海拔最高的地区——喜马拉雅造山带(Tapponnier et al., 1982; Burg et al., 1984; Harrison et al., 1997; Hodges, 2000; Royden et al., 2008).喜马拉雅东构造结位于喜马拉雅造山带的东端,在该地区板块边界发生近90的突然转折,隆升高山与深切峡谷相对应,地形起伏高达5000 m.该地区构造变形显著而且集中在较小的范围内.受到印度季风影响,该地区的降水量较大,构造抬升和地表剥蚀作用同时发生(陈建军等, 2008),被认为是地球上深部构造与浅表剥蚀过程耦合最强烈的地区之一.
以雅鲁藏布江缝合带为界, 喜马拉雅东构造结地区可以分为拉萨地块和南迦巴瓦变质体两大部分.东构造结内部的南迦巴瓦变质体由派乡角闪岩相变质岩、直白麻粒岩相变质岩、多雄拉组强烈混合岩化的角闪岩相变质岩等组成.其中直白麻粒岩相变质岩,经历高级变质和高温韧性变形作用,被认为是印度板块俯冲折返挤出形成的构造片岩(张泽明等, 2008).南迦巴瓦变质体受制于东侧墨脱—阿尼桥右行走滑断裂和西侧东久—米林左行走滑断裂的约束向北推移,并深深插入雅鲁藏布江缝合带和拉萨地块之下(许志琴等, 2008)(见图 1).

|
图 1 喜马拉雅东构造结地区宽频带地震台站位置分布图 图中浅绿色三角为“雅江下游台阵”,深绿色三角为“喜马拉雅东构造结地震台阵”,没有标注名称的台站为数据量不足的台站.橙色圆圈代表1960年至今MS4.5以上地震震中位置(数据来自USGS), 其中深红色大圆圈表示研究区内1900年以后发生的3个MS7以上地震震中位置,在大圆圈内部标注的是震级和发震年份.蓝线为主要缝合带和断层, 数据来自Ding等(2001)的研究.IYS—雅鲁藏布江缝合带,JSF—嘉黎断裂带,BNS—班公湖—怒江缝合带,MAF—墨脱—阿尼桥走滑断裂带,DMF—东久—米林走滑断裂带,STDS—藏南拆离带,MCT—主中央逆冲断层,MBT—主边界俯冲断层,NJBW—南迦巴瓦构造结,SS—桑构造结,AS—阿萨姆构造结,LS—拉萨地块,QD-SG—柴达木—松潘甘孜地块,QT—羌塘地块,HM—喜马拉雅造山带.A、B分别为图 6所示的两条速度模型剖面的位置. Fig. 1 Locations of broadband seismic stations in the Eastern Himalayan Syntaxis The light green triangles represent the "Yalung Zangbo broadband seismic array" and the dark green triangles represent the "Eastern Himalayan Syntaxis broadband seismic array". The triangles without name represent the stations without enough data to calculate receiver functions. The orange circles are the epicenters of earthquakes greater than MS4.5 from 1960 (data from USGS). The big dark red circles stand for three earthquake larger than MS7 after 1900 with the date and magnitude in the circle. Blue lines are the main faults and sutures in this zone taken from the research of Ding et al. (2001). IYS —Yalung Zangbo Suture, JSF—Jiali Slip Fault, BNS—Bangong-Nujiang Suture, MAF—Motuo-Aniqiao Fault, DMF—Dongjiu-Milin Fault, STDS—South Tibet Detachment Suture, MCT—Main Center Thrust, MBT—Main Boundary Thrust, NJBW—Nanjiabawa Complex, SS—Sang Syntaxis, AS—Assam Syntaxis, LS—Lhasa block, QD-SG—Qaidam-Songpan-Garzê block, QT—Qiangtang block, HM—Himalayan Orogenic belt. A and B are the velocity profiles, shown in Fig. 6. |

|
图 6 沿图 1中A、B两条测线的S波速度结构 上半部分蓝色实线为地形,蓝色三角符号为台站位置.下半部分为对应台站S波速度模型,其中蓝色实线为各台站反演的初始模型,黑色实线为反演结果模型.黑色箭头表示H-k计算得到的Moho面位置,蓝色箭头表示低速层位置. Fig. 6 S-wave velocity structure along lines A and B in Fig. 1 The blue solid line in upper part of each figure is the topography. The blue triangles represent locations of seismic stations. The lower part of each figure is the corresponding S velocity model of the stations. The blue solid lines represent the starting models for inversion, the black solid lines represent final models. The black arrows denote the Moho calculated by H-k method, the blue arrows denote the low velocity layers (LVL). |
根据历史地震记载,该地区1900年以来共发生7级以上地震3次,中国有史以来记录到的最大地震——1950年8月15日MS8.6察隅地震即发生在这一地区(李保昆等, 2015).地震沿着主要的活动断裂带呈线性展布,东构造结地区地震主要集中在雅鲁藏布江大拐弯顶端及东侧,构造结东部地区地震主要沿着墨脱—阿尼桥断裂分布,西部地区及南迦巴瓦变质体内地震不发育(见图 1).
目前关于东构造结及周边地区结构的认识取得了初步的研究成果.Ren和Shen(2008)利用有限频层析成像的方法研究藏东南地区的速度结构.他们发现在藏东南地区南北向的裂谷从地表至300 km左右的岩石圈存在低速层,且该低速层底部存在明显的高速异常,认为该高速异常与拆离的地幔岩石圈有关.Fu等(2010)应用面波成像方法研究认为喜马拉雅东构造结地区的中地壳存在低速层,并认为这与高的地温梯度或部分熔融有关.崔仲雄和裴顺平(2009)研究了该地区的Pn波各向异性,发现快波方向围绕东构造结出现顺时针旋转.常利军等(2015)利用SKS波分裂的方法研究了该地区上地幔各向异性,也发现东构造结周边地区的S波快波方向呈现绕构造结顺时针旋转的环形变化特征,认为这与印度板块沿北东方向向青藏高原下方俯冲和沿东向向缅甸板块下俯冲有关.Xu等(2013)利用接收函数的方法研究得出喜马拉雅东构造结地区的地壳厚度有自南西向北东方向变厚的趋势,观测到了印度板块和拉萨地块岩石圈厚度的差别,并认为在雅鲁藏布江缝合带下存在软流圈上涌的现象.上述地震学研究大多集中于上地幔结构和岩石圈界面深度的探测,地壳厚度变化和东构造结内部结构的探讨较少.
为了对喜马拉雅东构造结地区中小地震活动性及其地下结构进行深入研究,中国科学院青藏高原研究所在该地区布置了23个宽频带流动地震台站和1个固定台站.本研究以这些台站观测波形为基础,结合中国地震局地球物理研究所布置的7个流动台站记录的波形数据,利用P波接收函数和波形反演的方法研究了该地区的地壳结构,并探讨了地表断裂带分布、地震震源参数与地壳结构的关系,为喜马拉雅东构造结的地球动力学解释提供更多的地球物理证据.
2 资料与方法 2.1 数据图 1为在研究区域架设的宽频带地震台站位置分布图.浅绿色三角为中国科学院青藏高原研究所布置的“雅江下游台阵”,共23台, 自2015年10月开始进行了为期半年的观测,其中带有台站名的为本研究中实际应用到的台站,其他为因各种原因数据不足的台站.LUL为青藏高原所藏东南高山环境综合观测研究站布设的固定地震台.深绿色三角代表中国地震局地球物理研究所布置的“喜马拉雅东构造结地震台阵”(ChinArray, 2006),观测时长为两年左右.以上观测台站的间距大致为10~20 km,覆盖东构造结及周边大范围地区,为本研究提供了重要的第一手资料.
2.2 接收函数计算接收函数是基于震源等效假设,通过反褶积计算去掉远震地震记录中包含的震源信息、远震传播路径信息、仪器响应等后得到的地震波形记录(Langston, 1979),接收函数包含台站下方地壳和上地幔间断面产生的转换波和多次波信息.在本研究中,首先对接收原始数据进行去仪器响应处理,并把原始数据转换为sac格式.从USGS(United States Geological Survey,美国地质调查局)下载体波震级大于5.5级的地震事件数据,选择的地震事件的震中距范围是30°~90°.利用Taup程序(Crotwell et al., 1999)计算P波震相理论到时,并截取P波初至前10 s至后90 s的波形数据.
处理时对每个截取的事件波形都进行了人工P波震相识别和到时修正,去除无法识别的事件波形,确保选择的波形有较好的信噪比.再利用IRIS (Incorporated Research Institution for Seismology,美国各高校组建的地震学研究团体)提供的SAC程序把NEZ三分量旋转为RTZ三分量,然后用径向分量(R)和垂向分量(Z)进行时间域迭代反褶积(Ligorria et al., 1999)计算得到有效接收函数.在反褶积过程中加入高斯滤波器,高斯滤波系数会影响震相的振幅的尖锐程度.较低的高斯滤波系数会压制多次波和噪声,使震相的振幅变宽,突出Moho面信息.较高的滤波系数会使震相的振幅变尖锐,壳内的多次波震相也会突显出来.通过测试和比较,本研究在提取接收函数时使用了高斯滤波系数分别为1.0和2.5的两种滤波器.表 1列举了各个台站得到的有效接收函数数量.图 2展示了用于提取有效接收函数利用到的地震震中位置,其中红色圆点为“雅江下游台阵”利用到的地震震中位置,共63个,计算生成650条接收函数;蓝色圆圈为“喜马拉雅东构造结地震台阵”利用到的地震震中位置,共528个,计算生成766条接收函数.
|
|
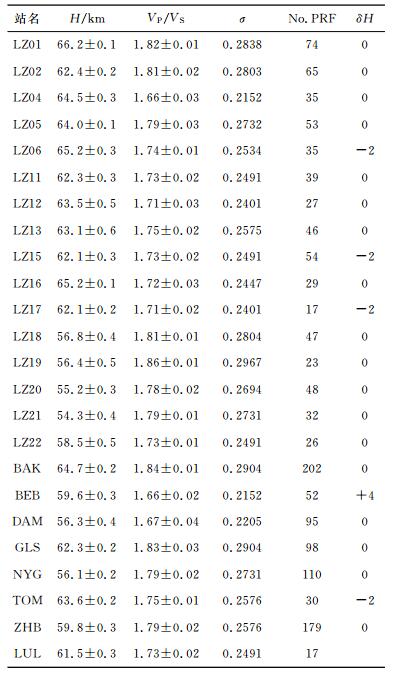
表 1 Moho面深度、波速比、泊松比、台站接收函数数量、Moho面深度对比(反演结果相对于H-k结果) Table 1 Moho depth (H), VP/VS ratio (k), Poisson's ratio, number of receiver functions, comparison of Moho depth (inversion results with H-k results) |

|
图 2 本研究使用的远震震中分布图 图中红色圆点为“雅江下游台阵”利用的地震事件震中位置,蓝色圆圈为“喜马拉雅东构造结地震台阵”利用的地震事件震中位置.绿色三角为台站位置. Fig. 2 Epicenter distribution of teleseismic events in the study The red circles represent the epicenter for stations of ITPCAS and the blue circles represent the epicenter for stations of CEA.The green triangles represent seismic stations. |
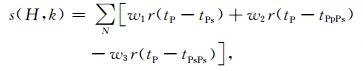
P波接收函数主要包含地震台站下方地壳和上地幔速度间断面所产生的Ps转换波及其多次反射波(PpPs,PpSs+PsPs)的信息.接收函数中的Ps转换波以及多次波的走时通常指的是与直达P波的走时差,它取决于间断面深度、射线参数以及台站下方的速度结构.在本研究中,应用Zhu和Kanamori(2000)的H-k方法,从Ps,PpPs,PpSs+PsPs等震相相对于P的延迟到时推算得出地壳厚度H和k(VP/VS).Zhu等(2000)研究认为对于地壳厚度为30 km的模型,1%的P波速度变化引起的地壳厚度变化小于0.5 km.Xu等(2013)也通过对该地区实际数据测试认为3%的P波速度变化会引起约2 km的H和约0.01的k变化,所以P波速度是一个相对自由的参数.结合前人(Xu et al., 2013)在该地区的研究经验及地震层析成像结果(Wei et al., 2016)取地壳的P波速度初始值为6.3 km·s-1.在时间域对每一个台站的接收函数进行叠加, 叠加前所有的P波接收函数都使用了0.05~1 Hz的零相位的巴特沃斯滤波器进行滤波,经过测试该角频率的滤波器可以较好地压制多次波,突出Ps波震相.得到的时间域与H-k域的转换表达式为:
|
(1) |
其中w是各个震相的权系数(∑w=1),r为相应震相的振幅函数,使s(H, k)达到最大值的H和k就认为是最优值.结合前人的研究经验(Bai et al., 2010; Xu et al., 2013)与多次测试, 本研究中Ps、PpPs、PsPs+PpSs震相的权系数分别取0.7、0.25、0.05.由于东构造结地区地壳结构的复杂性,使用单一高斯滤波系数提取的接收函数进行H-k计算得到的结果可能会存在误差,为此我们使用了1.0和2.5两种不同的高斯滤波系数.如果Moho面是尖锐的速度间断面,那么不同滤波系数得到的接收函数进行计算的结果应该一致;如果Moho面是速度渐变的界面,那么高斯系数为1.0的接收函数计算结果可能体现的是Moho的平均深度,高斯系数为2.5的接收函数计算结果可能是渐变面中变化最明显的位置.在本研究中,分别用两种滤波系数的接收函数进行了H-k计算,把得到的Moho和波速比分别取算数平均即为最后结果.泊松比是衡量地球介质属性的重要参数,它对地壳矿物组成、地壳流体和部分熔融的存在比较敏感,在各向同性介质中,泊松比可以由k(VP/VS)换算得到,表达式为σ=0.5(1-1/(k2-1))(Xu et al., 2007).
以ZHB台站数据为例,图 3展示了接收函数及H-k计算结果.从图中可以看出,两个计算结果有所不同,最终结果取两者的平均值,误差估计取两者误差值中较大的值.

|
图 3 ZHB台站接收函数及H-k计算结果 左上图和右上图分别为高斯滤波系数为1.0和2.5的接收函数,数字为计算得到的Moho面深度和k(VP/VS),虚线为各识别出的相应震相平均到时位置.下图对应H-k计算得到的结果,白色圆圈范围是计算极值的95%置信区间,图中相应数字为最优的H和k. Fig. 3 Results of receiver functions and corresponding H-k calculations for station ZHB The upper figures display the receiver functions, which are applied in the H-k method to calculate the depth of Moho discontinuity and k (VP/VS). The dash line denotes the average arriving time of each phase. The lower figures are the corresponding H-k calculations, the white circle is the 95% confidential interval. The numbers in the figures are the optimized H and k. |
利用接收函数波形反演台站下方速度结构的方法,对速度间断的存在比较敏感,但反演结果的准确性比较依赖初始模型与真实值的接近程度(Owens et al., 1987; Ammon et al., 1990; Kind et al., 1996).本研究中我们应用Shen等(2016)的面波和噪声反演得到的S波速度模型作为初始模型,并结合H-k方法得到的结果修改Moho面的深度.为减小地表较薄的低速沉积层的影响,地表至4 km深度范围为0.5 km厚的水平层叠加,设定该部分为沉积层,初始速度参考Crust1.0模型(Laske et al., 2013).4 km至Moho面为2 km厚的水平层,Moho面以下为5 km厚的水平层.不同于前人(Xu et al., 2007)固定Moho深度的做法,在本研究中没有对Moho面深度和速度进行约束.与H-k方法尽量选择多的接收函数进行叠加的原则不同,反演尽量选择方位角和震中距相当的事件,这主要是尽量避免各向异性对反演结果的影响.对“雅江下游台站”我们选定的地震事件的震源反方位角为110°~140°,震中距为30°~60°,地震事件集中在菲律宾和汤加海沟附近.对“喜马拉雅东构造结台阵”,我们选定的地震事件反方位角为45°~75°,震中距为35°~60°,地震事件多分布在日本地区.区域选择的依据是该区域在观测期间内用于提取有效接收函数的地震密度较高,且在其中选取的相应事件波形信噪比较高.用该范围内地震提取的具有不同高斯滤波系数(1.0, 2.5) 的接收函数全部参与反演,反演结果尽量拟合所有接收函数,使相关系数极值达到0.8以上.不同滤波系数的接收函数在反演过程中对模型影响的大小不同,权重是滤波系数的倒数,即模型的改变量是各个接收函数反演计算得到的改变量乘以权系数后再取算数平均.反演采用迭代方法,每次迭代结果是下一次迭代的初始模型,迭代的阈值是0.0002,即迭代模型的速度改变小于该值时停止迭代.为减小反演结果的速度抖动,减小反演陷入局部极值的可能,在反演结果中应用了差分平滑(Ammon et al., 1990)的思想,每次迭代后用模型中垂向相邻的三层线性插值获得中间层的速度值,再与反演得到的速度值取算数平均,即为该层平滑后的速度,从地表开始依次平滑模型中所有层的速度.图 4为各台站接收函数观测结果与反演模型模拟结果对比,其中红色实线是参与反演的实际接收函数的叠加结果,黑色实线是利用反演得到的速度模型,根据实际接收函数的射线参数模拟出的接收函数再叠加的结果.为了对不同震中距的多个波形进行叠加突出Ps震相,我们对各台站参与反演的接收函数对应的地震事件的震中距和震源深度进行算数平均,求取平均震源位置的射线参数,以此对波形进行了Ps震相的到时校正.

|
图 4 各台站接收函数观测结果与反演模型模拟结果对比 红色实线为各流动台站观测结果经Ps波到时校正后叠加的结果,黑色实线为用反演得到的模型计算出的理论接收函数叠加的结果,三角符号所在位置为识别出的Ps波.波形下方数字为反演结果和实际波形的互相关系数. (a)中叠加的接收函数的高斯滤波系数为1.0; (b)为2.5,叠加的接收函数都进行了0.05~1 Hz的带通滤波. Fig. 4 Comparison of observed and simulated receiver functions with the preferred inversed model The red solid lines represent the stacked waveform after Ps moveout correction. The black solid lines represent the stacked synthetic waveforms from the inversed model. The triangles represent the location of Ps wave. The number below corresponding waveform is the correlation coefficient between synthetic and observed waveforms. The Gaussian factor of all receiver functions is 1.0 in (a) and 2.5 in (b). All receiver functions have been Butterworth filtered by0.05~1 Hz before stacking. |
本研究获得的Moho面深度显示在图 5a中.从图 5a和图 6可以看出,整个研究区域的Moho面深度有北东向变深的趋势,其中喜马拉雅东构造结西部Moho面最浅,LZ21台站下方为54.3 km.喜马拉雅东构造结两侧以及北面,即拉萨地块的Moho面深度普遍在60 km以上.

|
图 5 喜马拉雅东构造结地区Moho面深度和泊松比分布图 (a) Moho面深度变化;(b)泊松比分布.图中三角符号为本研究的台站位置.背景等值线图为观测结果插值之后的结果,其他符号与图 1相同. Fig. 5 Distributions of Moho depth and Poisson's ratio in the Eastern Himalayan Syntaxis (a) Moho depth; (b) Poisson's ratio. Triangles represent seismic stations. Contour lines are the interpolation of observations. Other symbols are of same meanings as in Fig. 1. |
上述研究结果表明,喜马拉雅东构造结内Moho面深度较周围拉萨地块明显变浅.前人接收函数的研究(Xu et al., 2013; Peng et al., 2017)也发现了东构造结内部Moho面较浅,其周围的拉萨地块的Moho面深度普遍在60 km以上.层析成像的研究结果(Peng et al., 2016)认为印度板块岩石圈在东构造结下发生撕裂,岩石圈破碎拆沉,在重力均衡和岩石圈物质上涌的作用下造成了地壳的抬升.同时对东构造结内的超高压变质岩的研究(Ding et al., 1999; Zhang et al., 2007)也认为其中包含了岩石圈折返的物质,这些物质呈现出石榴辉石岩化的特征,这也可能说明地幔岩石圈物质在东构造结地区发生折返,Moho面跟随折返的岩石圈出现上隆.一些学者(Ren et al., 2008; Fu et al., 2010)认为俯冲的印度板块拆沉可能发生在雅江缝合带以北的拉萨地块下,并推断地幔软流圈物质发生上涌.但在本研究中台站覆盖的拉萨地块范围内并未发现地壳有明显减薄.
3.2 泊松比分布本研究获得的泊松比显示在图 5b中,并标注在台站符号下面.从图 5b中可以看出高泊松比(>0.28) 分布在喜马拉雅东构造结内部.同时,拉萨地块上的嘉黎走滑断裂带两侧的泊松比分布不同,北面的泊松比较高,南面较低.
前人研究(Oconnell and Budiansky, 1974; Mavko, 1980; Christensen, 1996)认为裂隙、流体和部分熔融等诸多因素可引起泊松比的变化,相比于实验室样本尺度的结果,由H-k方法得到的波速比换算得到的泊松比体现的是地壳尺度的平均特征.图 5中的震源分布可以看出地震主要分布在嘉黎断裂带、雅鲁藏布江缝合带大拐弯北端及雅鲁藏布江缝合带东段的墨脱—阿尼桥断裂带附近.和钟铧等(2006)通过对嘉黎断裂带两侧的蛇绿岩研究,认为嘉黎断裂带是拉萨地块上的重要缝合带.姜枚等(2012)利用大地电磁和层析成像联合反演的方法研究也认为嘉黎断裂带北东和南西两侧的中下地壳结构存在较大差异.墨脱—阿尼桥走滑断裂带是雅鲁藏布江缝合带的一部分,董汉文等(2014)研究认为墨脱—阿尼桥走滑断裂带有各段差异性,在强烈的右行走滑的基础上表现出自南向北的从拉张向逆冲的过渡.结合图 5b的泊松比分布结果可以看出嘉黎断裂带和墨脱—阿尼桥走滑断裂带也处于泊松比变化梯度较大的地区即图中等值线较密的地区.从震源分布来看,嘉黎断裂带和墨脱—阿尼桥走滑断裂带也是该地区地震发生的主要区域,这说明地壳结构的强烈变化与地震活动性有一定的相关性.
3.3 地壳低速层我们沿A、B线(见图 1)绘制两条S波速度剖面,结果展示在图 6中.Zeitler等(2014)研究结果表明喜马拉雅东构造结地区的地震震源分布在地表至地下20 km范围内,Bai等(2017)利用拟合整个西藏地区的地震进行重定位的研究结果也显示有同样结果.本研究中判断低速层的依据是速度比上覆地层的速度低0.5~0.8 km·s-1(Kind et al., 1996; Li et al., 2006; Xu et al., 2007).在图 6中,蓝色箭头指示的部分为低速层,位置大致分布在地壳20~40 km深度范围内,厚度在5~15 km.A、B两条剖面的结果显示,在靠近嘉黎断裂带南面的LZ12、LZ13台站没有观测到低速层的存在,这可能说明低速层在嘉黎断裂带附近出现了间断.
藏南地区的低速层已经被前人通过不同的数据和方法观测和验证(Kind et al., 1996; Yuan et al., 1997; Ozacar and Zandt, 2004; Ren and Shen, 2008),并被解释为板块碰撞俯冲产生的部分熔融.岩石物理的实验认为当泊松比达到0.3左右时就可能存在部分熔融(Christensen, 1996; Owens and Zandt, 1997).对比图 5b中本研究的结果,我们认为喜马拉雅东构造结西部及东久—米林走滑断裂带附近可能存在部分熔融.彭淼等(2012)利用大地电磁的方法研究认为,喜马拉雅东构造结的低阻带可能与高压麻粒岩的部分熔融有关,低阻层的深度与本研究的结果相似.
Ding和Zhong(1999),Zhong和Ding(1996)认为直白组构造片岩中的麻粒岩透镜体经历的峰值变质条件为T=750~890 ℃,P=1.4~1.8 GPa,相当于中下地壳的温压条件.Mueller和Massonne(2001)认为在中地壳的压力条件下,花岗岩在650 ℃左右开始熔融.喜马拉雅东构造结地区出露的也多为花岗岩或以花岗岩为母岩的变质岩(Xu et al., 2008).所以结合Mueller和Massonne(2001)的结果,泊松比在0.3左右,S波速度在3.0~3.4 km·s-1,深度在20~40 km的低速层温度会在700 ℃以上.该温压条件与前面提到的直白组高压麻粒岩的变质条件相当,所以该挤出片岩的产生可能与该低速层有关.Zhu等(1995)及Roger等(1995)在解释鲜水河断裂带南部的贡嘎山花岗岩成因时也有相似结论,认为花岗岩来自地壳的部分熔融.
4 结论本研究利用在喜马拉雅东构造结地区布设的宽频带地震台接收的远震地震数据,采用P波接收函数和波形反演的方法研究了青藏高原东南部喜马拉雅东构造结附近的地壳结构,得到了以下结论:
(1) 喜马拉雅东构造结内部的Moho面相对较浅,位于54~60 km范围内,并呈现出北东向变深的趋势,其周围的拉萨地块的Moho面深度较深,基本在60 km以上.
(2) 喜马拉雅东构造结西部及东久—米林走滑断裂带附近的泊松比相对较高,在0.29以上,可能存在部分熔融.喜马拉雅东构造结周边的拉萨地块泊松比相对较低.嘉黎断裂带南北两侧的泊松比差别较大,说明该断裂带两侧地壳结构存在显著差别.在嘉黎断裂带、墨脱—阿尼桥断裂带附近泊松比变化梯度较大,这些地区也是地震频发地区,说明地震活动性的剧烈程度与地壳结构的局部差异有关.
(3) 喜马拉雅东构造结及周边的拉萨地块内普遍存在低速层,分布在20~40 km深度范围内,厚度约为5~15 km.喜马拉雅东构造结内的低速层可能与直白组挤出岩片的形成有关.
喜马拉雅东构结地区的地壳构造十分复杂且有横向不均匀性,倾斜地层构造的存在(Li et al., 2008; Ren and Shen, 2008; Wei et al., 2016)势必影响反演的结果.今后还需要进一步改进反演方法以便获取更为精确的结果.
致谢感谢中国地震局地球物理研究所“中国地震科学探测台阵数据中心”为本研究提供地震波形数据.感谢Lupei Zhu教授提供的迭代反褶积和H-k叠加程序.感谢C Ammon教授提供的最小二乘反演程序, 感谢同组的赵俊猛研究员、徐强副研究员的讨论和帮助.地震数据处理使用SAC(Seismic Analysis Code), 全部图件使用GMT(The Generic Mapping Tools)绘制.
| Ammon C J, Randall G E, Zandt G. 1990. On the nonuniqueness of receiver function inversions. Journal of Geophysical Research-Solid Earth and Planets, 95(B10): 15303-15318. DOI:10.1029/JB095iB10p15303 | |
| Bai L, Li G, Khan N G, et al. 2017. Focal depths and mechanisms of shallow earthquakes in the Himalayan-Tibetan region. Gondwana Research, 41: 390-399. DOI:10.1016/j.gr.2015.07.009 | |
| Bai L, Tian X, Ritsema J. 2010. Crustal structure beneath the Indochina peninsula from teleseismic receiver functions. Geophysical Research Letters, 37(24): L24308. DOI:10.1029/2010GL044874 | |
| Burg J P, Chen G M. 1984. Tectonics and structural zonation of southern Tibet, China. Nature, 311(5983): 219-223. DOI:10.1038/311219a0 | |
| Chang L J, Wang C Y, Ding Z F, et al. 2015. Upper mantle anisotropy of the eastern Himalayan syntaxis and surrounding regions from shear wave. Science in China Series D-Earth Sciences, 45(5): 577-588. | |
| Chen J J, Ji J Q, Gong J F, et al. 2008. Formation of the Yarlung Zangbo Grand Canyon, Tibet, China. Geological Bulletin of China, 27(4): 491-499. | |
| ChinArray. 2006. China seismic array waveform data. China Earthquake Administration. doi: 10.12001/ChinArray.Data | |
| Christensen N I. 1996. Poisson's ratio and crustal seismology. Journal of Geophysical Research-Solid Earth, 101(B2): 3139-3156. DOI:10.1029/95JB03446 | |
| Crotwell H P, Owens T J, Ritsema J. 1999. The taup toolkit: flexible seismic travel-time and ray-path utilities. Seismological Research Letters, 70(2): 154-160. DOI:10.1785/gssrl.70.2.154 | |
| Cui Z X, Pei S P. 2009. Study on Pn velocity and anisotropy in the uppermost mantle of the Eastern Himalayan Syntaxis and surrounding regions. Chinese Journal of Geophysics, 52(9): 2245-2254. | |
| Ding L, Zhong D L. 1999. Metamorphic characteristics and geotectonic implications of the high-pressure granulites from Namjagbarwa, eastern Tibet. Science in China Series D—Earth Sciences, 42(5): 491-505. DOI:10.1007/BF02875243 | |
| Ding L, Zhong D L, Yin A, et al. 2001. Cenozoic structural and metamorphic evolution of the eastern Himalayan syntaxis (Namche Barwa). Earth and Planetary Science Letters, 192(3): 423-438. DOI:10.1016/S0012-821X(01)00463-0 | |
| Dong H W, Xu Z Q, Li Y, et al. 2014. Characteristics of the Medog shear zone in the Eastern Himalayan Syntaxis and its tectonic significance. Acta Petrologica Sinica, 30(8): 2229-2240. | |
| Fu Y V, Li A, Chen Y J. 2010. Crustal and upper mantle structure of southeast Tibet from Rayleigh wave tomography. Journal of Geophysical Research-Solid Earth, 115(B12): B12323. DOI:10.1029/2009JB007160 | |
| Harrison T M, Ryerson F J, LeFort P, et al. 1997. A Late Miocene-Pliocene origin for the Central Himalayan inverted metamorphism. Earth and Planetary Science Letters, 146(1-2): E1-E7. DOI:10.1016/S0012-821X(96)00215-4 | |
| He Z Y, Yang D M, Wang T W. 2006. Age, geochemistry and its tectonic significance of Kaimeng ophiolites in Jiali fault belt, Tibet. Acta Petrologica Sinica, 22(3): 653-660. | |
| Hodges K V. 2000. Tectonics of the Himalaya and southern Tibet from two perspectives. Geological Society of America Bulletin, 112(3): 324-350. DOI:10.1130/0016-7606(2000)112<324:TOTHAS>2.0.CO;2 | |
| Jiang M, Peng M, Wang Y X, et al. 2012. Geophysical evidence for deep subduction of Indian lithospheric plate beneath Eastern Himalayan Syntaxis. Acta Petrologica Sinica, 28(6): 1755-1764. | |
| Kind R, Ni J, Zhao W J, et al. 1996. Evidence from earthquake data for a partially molten crustal layer in southern Tibet. Science, 274(5293): 1692-1694. DOI:10.1126/science.274.5293.1692 | |
| Langston C A. 1979. Structure under Mount Rainier, Washington, inferred from teleseismic body waves. Journal of Geophysical Research, 84(B9): 4749-4762. DOI:10.1029/JB084iB09p04749 | |
| Laske G, Masters G, Ma Z, et al. 2013. Update on CRUST1.0a 1-degree global model of Earth's crust. Geophysical Research Abstracts, 15: EGU2013-2658. | |
| Li B K, Diao G L, Xu X W, et al. 2015. Redetermination of the source parameters of the Zay, Tibet M8.6 earthquake sequence in 1950. Chinese Journal of Geophysics, 58(11): 4254-4265. | |
| Li C, Van Der Hilst R D, Meltzer A S, et al. 2008. Subduction of the Indian lithosphere beneath the Tibetan Plateau and Burma. Earth and Planetary Science Letters, 274(1-2): 157-168. DOI:10.1016/j.epsl.2008.07.016 | |
| Li S L, Mooney W D, Fan J C. 2006. Crustal structure of mainland China from deep seismic sounding data. Tectonophysics, 420(1-2): 239-252. DOI:10.1016/j.tecto.2006.01.026 | |
| Ligorria J P, Ammon C J. 1999. Iterative deconvolution and receiver-function estimation. Bulletin of the Seismological Society of America, 89(5): 1395-1400. | |
| Mavko G M. 1980. Velocity and attenuation in partially molten rocks. Journal of Geophysical Research, 85(B10): 5173-5189. DOI:10.1029/JB085iB10p05173 | |
| Mueller H J, Massonne H J. 2001. Experimental high pressure investigation of partial melting in natural rocks and their influence on VP and VS. Physics and Chemistry of the Earth Part A-Solid Earth and Geodesy, 26(4-5): 325-332. DOI:10.1016/S1464-1895(01)00062-X | |
| Oconnell R J, Budiansky B. 1974. Seismic velocities in dry and saturated cracked solids. Journal of Geophysical Research, 79: 5412-5426. DOI:10.1029/JB079i035p05412 | |
| Owens T J, Taylor S R, Zandt G. 1987. Crustal structure at regional seismic test network stations determined from inversion of broadband teleseismic Pwaveforms. Bulletin of the Seismological Society of America, 77(2): 631-662. | |
| Owens T J, Zandt G. 1997. Implications of crustal property variations for models of Tibetan plateau evolution. Nature, 387(6628): 37-43. DOI:10.1038/387037a0 | |
| Ozacar A A, Zandt G. 2004. Crustal seismic anisotropy in central Tibet: Implications for deformational style and flow in the crust. Geophysical Research Letters, 31(23): L23601. DOI:10.1029/2004GL021096 | |
| Peng M, Jiang M, Chen Y L, et al. 2017. Crustal structure under the eastern Himalayan Syntaxis seismic array and its geodynamic implictions derived from receiver functions. Chinese Journal of Geophysics, 60(1): 70-85. | |
| Peng M, Jiang M, Li Z H, et al. 2016. Complex Indian subduction style with slab fragmentation beneath the Eastern Himalayan Syntaxis revealed by teleseismic P-wave tomography. Tectonophysics, 667: 77-86. DOI:10.1016/j.tecto.2015.11.012 | |
| Peng M, Tan H D, Jiang M, et al. 2012. Joint inversion of receiver functions and magnetotelluric data: Application to crustal and mantle structure beneath central Namche Barwa. Chinese Journal of Geophysics, 55(7): 2281-2291. | |
| Ren Y, Shen Y. 2008. Finite frequency tomography in southeastern Tibet: Evidence for the causal relationship between mantle lithosphere delamination and the northsouth trending rifts. Journal of Geophysical Research, 113(B10): B10316. DOI:10.1029/2008JB005615 | |
| Roger F, Calassou S, Lancelot J, et al. 1995. Miocene emplacement and deformation of the Konga Shan granite (Xianshuihe fault zone, west Sichuan, China)-geodynamic implications. Earth and Planetary Science Letters, 130(1-4): 201-216. DOI:10.1016/0012-821X(94)00252-T | |
| Royden L H, Burchfiel B C, Van Der Hilst R D. 2008. The geological evolution of the Tibetan plateau. Science, 321(5892): 1054-1058. DOI:10.1126/science.1155371 | |
| Shen W, Ritzwoller M H, Kang D, et al. 2016. A seismic reference model for the crust and uppermost mantle beneath China from surface wave dispersion. Geophysical Journal International, 206(2): 954-979. DOI:10.1093/gji/ggw175 | |
| Tapponnier P, Peltzer G, LeDain A Y, et al. 1982. Propagating extrusion tectonics in Asia-new insights from simple experiments with plasticine. Geology, 10(12): 611-616. DOI:10.1130/0091-7613(1982)10<611:PETIAN>2.0.CO;2 | |
| Wei W, Zhao D, Xu J, et al. 2016. Depth variations of P-wave azimuthal anisotropy beneath mainland China. Scientific Reports, 6. DOI:10.1038/srep29614 | |
| Xu L L, Rondenay S, Van Der Hilst R D. 2007. Structure of the crust beneath the southeastern Tibetan Plateau from teleseismic receiver functions. Physics of the Earth and Planetary Interiors, 165(3-4): 176-193. DOI:10.1016/j.pepi.2007.09.002 | |
| Xu Q, Zhao J, Pei S, et al. 2013. Imaging lithospheric structure of the eastern Himalayan syntaxis: New insights from receiver function analysis. Journal of Geophysical Research-Solid Earth, 118(5): 2323-2332. DOI:10.1002/jgrb.50162 | |
| Xu Z Q, Cai Z H, Zhang Z M, et al. 2008. Tectonics and fabric kinematics of the Namche Barwa terrane Eastern Himalayan Syntaxis. Acta Petrologica Sinica, 24(7): 1463-1476. | |
| Yin A, Harrison T M. 2000. Geologic evolution of the Himalayan-Tibetan orogen. Annual Review of Earth and Planetary Sciences, 28: 211-280. DOI:10.1146/annurev.earth.28.1.211 | |
| Yuan X H, Ni J, Kind R, et al. 1997. Lithospheric and upper mantle structure of southern Tibet from a seismological passive source experiment. Journal of Geophysical Research-Solid Earth, 102(B12): 27491-27500. DOI:10.1029/97JB02379 | |
| Zeitler P K, Meltzer A S, Brown L, et al. 2014. Tectonics and topographic evolution of Namche Barwa and the easternmost Lhasa block, Tibet. Geological Society of America Special Papers, 507: 23-58. DOI:10.1130/2014.2507(02) | |
| Zhang Z M, Wang J L, Shen K, et al. 2008. Paleozoic circum-Gondwana orogens: Petrology and geochronology of the Namche Barwa Complex in the eastern Himalayan syntaxis, Tibet. Acta Petrologica Sinica, 24(7): 1627-1637. | |
| Zhang Z M, Zheng L L, Wang J L, et al. 2007. Garnet pyroxenite in the Najagbarwa Group-complex in the eastern Himalayan tectonic syntaxis, Tibet, China: Evidence for subduction of the Indian continent beneath the Eurasian plate at 80~100 km depth. Geological Bulletin of China, 26(1): 1-12. | |
| Zhong D L, Ding L. 1996. Discovery of high-pressure basic granulite in Namjagbarwa area, Tibet, China. Chinese Science Bulletin, 41(1): 87-88. | |
| Zhu L P, Kanamori H. 2000. Moho depth variation in southern California from teleseismic receiver functions. Journal of Geophysical Research-Solid Earth, 105(B2): 2969-2980. DOI:10.1029/1999JB900322 | |
| Zhu L P, Owens T J, Randall G E. 1995. Lateral variation in crustal structure of the northern Tibetan Plateau inferred from teleseismic receiver functions. Bulletin of the Seismological Society of America, 85(6): 1531-1540. | |
| 常利军, 王椿镛, 丁志峰, 等. 2015. 喜马拉雅东构造结及周边地区上地幔各向异性. 中国科学:地球科学, 45(5): 577–588. | |
| 陈建军, 季建清, 龚俊峰, 等. 2008. 雅鲁藏布江大峡谷的形成. 地质通报, 27(4): 491–499. | |
| 崔仲雄, 裴顺平. 2009. 青藏高原东构造结及周边地区上地幔顶部Pn速度结构和各向异性研究. 地球物理学报, 52(9): 2245–2254. | |
| 董汉文, 许志琴, 李源, 等. 2014. 喜马拉雅东构造结墨脱剪切带特征及其区域构造意义. 岩石学报, 30(8): 2229–2240. | |
| 和钟铧, 杨德明, 王天武. 2006. 西藏嘉黎断裂带凯蒙蛇绿岩的年代学、地球化学特征及大地构造意义. 岩石学报, 22(3): 653–660. | |
| 姜枚, 彭淼, 王有学, 等. 2012. 喜马拉雅东构造结岩石圈板片深俯冲的地球物理证据. 岩石学报, 28(6): 1755–1764. | |
| 李保昆, 刁桂苓, 徐锡伟, 等. 2015. 1950年西藏察隅M8.6强震序列震源参数复核. 地球物理学报, 58(11): 4254–4265. | |
| 彭淼, 姜枚, YoulinC, 等. 2017. 利用远震接收函数揭示的喜马拉雅东构造结台阵下方地壳结构及其动力学意义. 地球物理学报, 60(1): 70–85. | |
| 彭淼, 谭捍东, 姜枚, 等. 2012. 利用接收函数和大地电磁数据联合反演南迦巴瓦构造结中部地区壳幔结构. 地球物理学报, 55(7): 2281–2291. DOI:10.6038/j.issn.0001-5733.2012.07.014 | |
| 许志琴, 蔡志慧, 张泽明, 等. 2008. 喜马拉雅东构造结——南迦巴瓦构造及组构运动学. 岩石学报, 24(7): 1463–1476. | |
| 张泽明, 王金丽, 沈昆, 等. 2008. 环东冈瓦纳大陆周缘的古生代造山作用:喜马拉雅东构造结南迦巴瓦岩群的岩石学和年代学证据. 岩石学报, 24(7): 1627–1637. | |
| 张泽明, 郑来林, 王金丽, 等. 2007. 东喜马拉雅构造结南迦巴瓦岩群中的石榴辉石岩——印度大陆向欧亚板块之下俯冲至80~100 km深度的证据. 地质通报, 26(1): 1–12. | |
| 中国地震科学台阵. 2006. 中国地震科学探测台阵波形数据. 中国地震局. doi: 10.12001/ChinArray.Data. | |