 2017, Vol. 60


2. 中国科学院地质与地球物理研究所, 地球与行星物理重点实验室, 北京 100029
2. Key Laboratory of Earth and Planetary Physics, Institute of Geology and Geophysics, Chinese Academy of Sciences, Beijing 100029, China
北京时间2015年9月17日6时54分32秒在智利中部伊拉佩尔以西近海沿岸48 km处发生了一次MW8.3大地震,地震发生后引发了大规模的海啸,太平洋海啸预警中心(PTWC)随即发布海啸预警,并在智利沿岸观测到了4.6 m高的海啸(http://www.tianqi.com/news/105923.html).主震后几小时内该区域又分别发生了多次6.0以上的余震,此次地震、余震和海啸造成了较大的人员伤亡与财产损失.根据美国地质调查局(USGS)的定位结果,此次地震的震中位置为31.57°S,71.67°W,震源深度22.4 km,位于纳兹卡板块和南美洲板块间的俯冲带上(http://earthquake.usgs.gov/earthquakes/eventpage/us20003k7a).
纳兹卡板块以~74 mm·a-1的速度向北东方向移动(DeMets et al., 2010),与南美洲板块发生碰撞俯冲,密度较大的大洋板块纳兹卡板块俯冲到了密度较小的大陆板块南美洲板块之下,形成了典型的智利型俯冲带.1900年以来智利地区历史地震记录资料显示该区域发生过多次MW8.0以上的强烈地震,绝大多数大地震都是俯冲带内板间浅源地震,从震源机制解来看,地震主要以逆冲作用为主,与其所处的南美洲板块西缘的俯冲带密切相关.因此,由于频繁的强烈地震活动,使得该区域成为了地震学与地球动力学的重点研究区域(Comte and Pardo, 1991; Beck et al., 1998; Brooks et al., 2003; Lomnitz, 2004; Haberland et al., 2009; Moreno et al., 2010; Vigny et al., 2011; Métois et al., 2012; Lay et al., 2014; Liu et al., 2015).
2015年伊拉佩尔MW8.3地震破裂区域附近,近一个世纪已经发生过十几次7.0级以上的大地震,此次事件以南500 km处的马乌莱地区,于2010年2月27日14时34分11秒发生过一次MW8.8强震.根据USGS的调查结果,2010年马乌莱强震震中为36.12°S,72.90°W,震源深度22.9 km,位于南美洲板块西缘俯冲带上,这次强震同样造成了较大的财产损失和人员伤亡.2015年伊拉佩尔MW8.3地震与2010年马乌莱MW8.8地震两个余震分布区之间存在着一个明显的约75 km的地震空区,该空区在1985年发生过8.0级地震,更早之前,1906年8.2级和1971年7.8级两次地震也在该俯冲带相近位置发生破裂(图 1).因此如何评价这两次地震对邻近俯冲带断层,特别是空区的影响显得尤为重要.

|
图 1 研究区域构造背景图 图中红色五角星、蓝色五角星和黑色五角星分别表示2015年9月17日伊拉佩尔MW8.3地震震中、2010年2月27日马乌莱MW8.8地震震中和历史地震震中,黑色实心点和灰色实心点分别代表 2015年和2010年主震后24小时内的余震,白色方框为我们所用断层面在地表的投影,震源机制解源自全球矩心矩张量(GCMT)目录(http://www.globalcmt.org/CMTsearch.html),板块间汇聚速度取自DeMets等(2010). Fig. 1 Map showing the tectonics background of study area The red star, blue star and black stars are the epicenter of 2015 Illapel earthquake, 2010 Maule earthquake and history earthquakes, respectively, black points and gray points are the aftershocks within 24 hours for 2015 event and 2010 event, white frames are the projection of the fault planes, and the focal mechanism provided by Global Centroid Moment Tensor (GCMT) (http://www.globalcmt.org/CMTsearch.html), the rate of plate convergence provided by DeMets et al. (2010). |
计算震后静态库仑应力的变化是研究震源区附近的应力变化有效手段.地震发生后,地壳内的应力分布会发生改变,周边某些断层上库仑应力增大,加大了断层破裂的概率,易于发生地震,库仑应力减小则减少了断层上的负载(Stein et al., 1992; King et al., 1994; Toda et al., 1998).因此,在本文中,我们首先基于有限断层模型,使用远场体波和面波波形联合反演,获取2015年伊拉佩尔MW8.3地震与2010年马乌莱MW8.8地震的震源破裂过程.基于震源破裂过程,进一步计算震源区附近的静态库仑应力变化,评价这两次地震对邻近俯冲带断层的影响.
2 数据和方法对于强震,通过远场宽频带数字记录,基于有限断层模型,利用波形反演的方法可以获得地震的破裂过程图像(Hartzell and Heaton, 1983; 姚振兴和纪晨, 1997; Ji et al., 2002; 王卫民等, 2008; 刘成利等, 2013; 张勇等, 2013).Ji等(2002)和Shao等(2011)发展了一种在小波域中进行有限断层反演的方法,根据远场体波和面波波形记录,利用小波域反演方法来研究大地震的震源破裂过程,最终能同时有效地得到滑动量、滑动方向、上升时间和破裂速度等.该方法同时考虑到了信号的时间与频率特征,适合于不同尺度的波形,可以有效地提高分辨率.本文利用Ji等(2002)和Shao等(2011)发展的方法,通过远场体波和面波波形联合反演,来获取2015年伊拉佩尔MW8.3地震与2010年马乌莱MW8.8地震的震源破裂过程.
基于获取的震源破裂过程,进一步计算邻近俯冲带上的静态库仑应力的变化.基于库仑失稳准则以及震源机理原理,库仑破裂函数定义为

|
(1) |
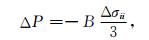
其中Δτ为沿断层面滑动方向的剪应力变化, Δσn为断层面法向正应力变化, ΔP为空隙压力变化, μ为摩擦系数.空隙压力变化满足(Cocco and Rice, 2002)
|
(2) |
其中B为Skempton系数,Δσii为地震激发的应力张量迹.应力张量迹满足

|
(3) |
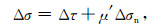
则根据应力张量可以计算断层面上的库仑应力变化,如(4) 式所示.
|
(4) |
其中Δσ,Δτ,Δσn和μ′分别表示库仑应力、断层面上的剪应力、断层面上的正应力以及等效摩擦系数.通常认为库仑应力增加大于0.1×10⁵ Pa即有利于余震的触发(Ma et al., 2005).Okada(1985)给出了一套完整的计算半无限介质内剪切位错点源、有限源静态位移场的解析解,我们基于Okada(1985)的理论解答,计算这两次强震之后在周边俯冲带上的静态库仑应力的变化.
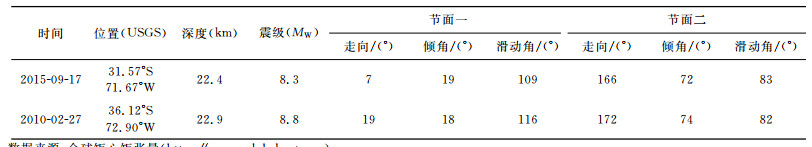
3 结果与讨论 3.1 2015年伊拉佩尔MW8.3地震震源过程伊拉佩尔MW8.3地震发生后,USGS等多家机构分别给出了震源的定位结果,本文在进行震源破裂过程研究时,采用了USGS给出的定位结果(31.57°S,71.67°W).GCMT给出的震源机制解如表 1所示,考虑到智利俯冲带近南北向的走向,特别是余震的分布(图 1),选定节面一(走向7°,倾角19°)为地震破裂面.用一条沿走向长为315 km,沿倾向宽为165 km的断层模拟破裂面,将之剖分为15 km×15 km的231个子断层单元来模拟破裂面上滑动的时空分布.
|
|
表 1 2015年和2010年两次地震事件全球矩心矩张量(GCMT)震源机制解 Table 1 Focal mechanism from Global Centroid Moment Tensor for two events |
从国际地震学研究联合会(IRIS)下载远场地震波形资料(震中距30°~90°),选取信噪比高、且方位角覆盖均匀的体波和面波记录,在移除仪器响应之后,共选择了20个P波垂向和15个SH波切向的体波位移波形记录以及20个垂向和17个切向的面波位移波形记录来反演得到断层面上的滑动分布.对于体波记录,所用频带范围为0.02~0.5 Hz,对于面波记录,所用频带范围为0.004~0.006 Hz.基于Crust2.0的速度模型(表 2)来计算震源区速度结构的影响.
|
|
表 2 2015年伊拉佩尔地震地壳速度结构模型 Table 2 The velocity model for the 2015 event |

反演结果如图 2所示,图 2a—2d分别给出了破裂过程的时空分布、地震矩张量时间函数、远场体波拟合结果以及远场面波拟合结果,远场波形得到了很好的拟合.滑动主要分布在震中北侧,北侧的破裂沿走向传播了约150 km,沿深度约45 km,较大的滑动量位于沿走向方向50~110 km,深度5~15 km范围内.相应的南侧破裂沿背离走向传播了约100 km,深度约25 km.子断层的滑动以逆冲为主,加权平均滑动角度为107°,平均滑动量约2.43 m(表 3).反演得到的标量地震矩为3.28×10²¹Nm,按Kanamori(1977)给出的公式,换算为矩张量震级约为MW8.3.
|
|
表 3 2015年伊拉佩尔地震研究结果 Table 3 The inversion results of the 2015 event |

|
图 2 2015年伊拉佩尔地震反演结果 (a)地震滑动时空分布,图中五角星表示震中位置,箭头大小表示滑动量大小,箭头方向表示滑动方向,图中数字为破裂传播时间;(b)标量地震矩释放随时间变化关系;(c)远场体波波形的拟合结果;(d)远场面波波形的拟合结果,图中黑线为实际观测数据,红线为位移的理论地震图,并给出了台站名称(左)、每个记录的方位角(左上)、震中距(左下)、观测中最大值(右), 其作用为将波形进行归一化. Fig. 2 The inversion results of 2015 Illapel earthquake (a) Slip distribution on the fault, the star indicates the epicenter, the size of the arrow indicates the slip size, the direction of the arrow indicates the slip direction, the number is the rupture propagation time; (b) Relationship between scalar seismic moment rate and the time; (c) The fitting results of the observed far field body waves and the synthetic waveforms; (d) The fitting results of the observed far field surface waves and the synthetic waveforms, the black line and the red line indicates the observed record and the synthetic seismogram, the station (left), azimuth (upper left), epicentral distance (bottom left) and the maximum in observation (right) are also plotted. |
2015年伊拉佩尔MW8.3地震破裂自震中位置起始向四周扩展,起始的0~20 s,滑动位于震中附近,滑动量较小.20 s之后北侧的较大滑动区被触发,矩张量释放的函数快速地上升.40 s起滑动同时在南北侧浅部快速传播,矩张量释放的函数更快速地上升,地震矩释放在48 s达到峰值.60 s之后破裂速度逐渐下降直到最后破裂停止,较大的滑动主要集中在北侧.标量地震矩释放随时间的变化图显示此次地震95%的标量地震矩在104 s内得到了释放,平均破裂传播速度约为1.82 km·s-1.本文给出的平均破裂速度为加权平均破裂速度(Shao et al., 2011),其结果比较稳定,破裂速度范围为1.25~3.75 km·s-1,上升时间范围为2.8~28 s.
3.2 2010年马乌莱MW8.8地震震源过程对于2010年马乌莱MW8.8地震,同样使用了USGS的定位结果(36.12°S,72.90°W).基于GCMT的震源机制解(表 1)以及余震分布(图 1)等相关信息,选定节面一(走向19°,倾角18°)为地震破裂面.用一条沿走向长460 km,沿倾向宽225 km的断层模拟破裂面,将其剖分成20 km×15 km的345个子断层单元来模拟破裂面上滑动的时空分布.共选择了17个P波垂向和12个SH波切向的体波位移波形记录以及17个垂向和14个切向的面波位移波形记录来反演得到断层面上的滑动分布.对于体波记录,所用频带范围为0.02~0.5 Hz,对于面波记录,所用频带范围为0.004~0.006 Hz.基于Crust2.0的速度模型(表 4)来计算震源区速度结构的影响.
|
|
表 4 2010年马乌莱地震地壳速度结构模型 Table 4 The velocity model for the 2010 event |

反演结果如图 3所示,图 3a—3d分别给出了破裂过程的时空分布、地震矩张量时间函数、远场体波拟合结果以及远场面波拟合结果,远场波形得到了很好的拟合.结果显示这次地震为双侧破裂事件,滑动向南北两侧扩展,滑动分布在长约360 km,宽约150 km的区域内,平均的滑动量为4.95 m(表 5).较大的滑动量位于沿走向方向70~150 km,深度10~30 km范围内.子断层的滑动以逆冲为主,加权平均滑动角度为109°.反演得到的标量地震矩为1.86×10²²Nm,换算为矩张量震级约为MW8.8(Kanamori, 1977).
|
|
表 5 2010年马乌莱地震研究结果 Table 5 The inversion results of the 2010 event |


|
图 3 2010马乌莱地震反演结果 (a)地震滑动时空分布,图中五角星表示震中位置,箭头大小表示滑动量大小,箭头方向表示滑动方向,图中数字为破裂传播时间;(b)标量地震矩释放随时间变化关系;(c)远场体波波形的拟合结果;(d)远场面波波形的拟合结果,图中黑线为实际观测数据,红线为位移的理论地震图,并给出了台站名称(左)、每个记录的方位角(左上)、震中距(左下)、观测中最大值(右), 其作用为将波形进行归一化. Fig. 3 The inversion results of 2010 Maule earthquake (a) Slip distribution on the fault, the star indicates the epicenter, the size of the arrow indicates the slip size, the direction of the arrow indicates the slip direction, the number is the rupture propagation time; (b) Relationship between scalar seismic moment rate and the time; (c) The fitting results of the observed far field body waves and the synthetic waveforms; (d) The fitting results of the observed far field surface waves and the synthetic waveforms, the black line and the red line indicates the observed record and the synthetic seismogram, the station (left), azimuth (upper left), epicentral distance (bottom left) and the maximum in observation (right) are also plotted. |
2010年马乌莱MW8.8地震破裂自震中位置开始向四周扩展,起始的0~20 s,沿走向深部约40 km处发生较大破裂.20~40 s破裂继续向南北两个方向扩展,向南侧的破裂扩展速度要明显大于向北侧的破裂扩展速度.40~60 s内南侧的破裂扩展速度显著降低,而北侧的较大破裂区域开始破裂.60~80 s南侧的破裂扩展趋于停止,北侧沿走向100~160 km区域快速地破裂,地震矩释放在81 s达到峰值,80 s之后的破裂主要集中在震中以北的区域内.标量地震矩释放随时间的变化图显示此次地震95%的标量地震矩在121 s内得到了释放,平均破裂传播速度约为1.90 km·s-1.破裂速度范围为1.25~3.75 km·s-1,上升时间范围为4.0~40 s.马乌莱MW8.8地震矩心深度约30.0 km,最大的滑动量约为12.5 m,最大滑动量位于沿走向100 km,深度21 km处,而相应的伊拉佩尔MW8.3地震矩心深度约21.2 km,最大的滑动量约为8 m,最大滑动量位于沿走向75 km,深度8 km处.两次地震均为以逆冲为主的浅源地震,滑动角度非常相近,然而虽然马乌莱地震震级高达MW8.8,但引发的海啸却远小于伊拉佩尔MW8.3地震,也是由于后者浅部滑动较大所致.
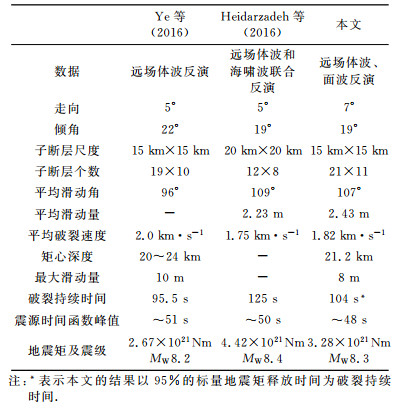
两次地震发生后,许多学者给出了震源破裂过程的相关研究,对于2015年伊拉佩尔地震,Ye等(2016)利用有限断层方法,通过远场P波和SH波反演得到震源破裂过程,发现震源北向的破裂以2.0 km·s-1的速度发展,破裂持续时间为95.5 s;Heidarzadeh等(2016)基于多时窗方法,利用远场P波和海啸波联合反演获得破裂速度为1.75 km·s-1,破裂持续时间125 s,平均滑动量2.23 m.对于2010年马乌莱地震,Lay等(2010)利用远场体波和Rayleigh波反演得到平均破裂速度为2.0~2.5 km·s-1,平均滑动量为5 m;Delouis等(2010)联合远场体波记录和大地测量数据共同反演,结果显示破裂为双向传播,且在震源两边均延伸约250 km,平均破裂速度为2.6 km·s-1.由于使用资料、反演方法等的差异,这些结果存在或多或少的差别,但均反映了这两次地震震源的宏观特征(表 3,5),本文滑动分布结果与前人研究成果在总体上较为一致.
3.3 静态库仑应力变化利用前文获得的滑动分布模型,使用Okada(1985)的方法,计算了2010年马乌莱MW8.8地震之后,震中以北俯冲带断层上静态库仑应力的变化(图 4).前人研究结果表明,大多数发生强震的俯冲带断裂面上的等效摩擦系数通常较低(Wang,2015),考虑到智利地区地质构造情况,最终半无限介质模型参数选取为P波速度6.2 km·s-1,S波速度3.5 km·s-1,密度2.9 g·cm-3,经过测试等效摩擦系数取值为0.1.将计算区域分成了两个部分,两次地震破裂区之间的区域为第一部分,使用走向12°,倾角19°,滑动角107°的断层面进行计算.结果显示2010年马乌莱地震导致该区域的库仑应力平均增加了约3.19×10⁵ Pa,在马乌莱地震破裂区北侧库仑应力显著增加的区域(>1×10⁵Pa),有大量余震发生,与库仑应力增加有着很好的对应关系.计算区域的第二部分为2015年伊拉佩尔地震破裂区附近,使用走向7°,倾角19°,滑动角107°的断层面进行计算.2010年马乌莱地震使得该区域的库仑应力增加了(0.01~0.15)×105Pa,由此可知2010年马乌莱地震促进了其北侧2015年伊拉佩尔地震的发生.在距震中以北约420 km和580 km处,库仑应力增加量约为0.1×10⁵ Pa和0.02×10⁵ Pa.

|
图 4 库仑应力变化图 (a) 2010年马乌莱MW8.8地震静态库仑应力变化图;(b) 2015年伊拉佩尔MW8.3地震静态库仑应力变化图.图中黑色圆圈为主震后24小时内该区域大于5.0级的余震分布, 虚线线框为我们所用的地震断层面在地表的投影, 红色五角星和蓝色五角星分别为2015年MW8.3和2010年MW8.8地震震中. Fig. 4 Coulomb stress change (a) 2010 Maule earthquake static Coulomb stress change; (b) 2015 Illapel earthquake static Coulomb stress change. The black circles are the aftershocks larger than magnitude 5.0 within 24 hours, the dash frames are the projection of the fault planes, the red star and blue star are the epicenter of Illapel earthquake and Maule earthquake, respectively. |
同样,我们也计算了2015年伊拉佩尔MW8.3地震之后周边俯冲带断层上的静态库仑应力变化(图 4).采用前文相同的计算参数,将计算区域分为两个部分,两次地震破裂区之间的区域(Part Ⅰ)以及伊拉佩尔地震北侧的区域(Part Ⅱ),结果显示2015年伊拉佩尔地震使得Part Ⅰ区域的库仑应力平均增加了约0.29×10⁵ Pa,Part Ⅱ区域的库仑应力平均增加了约2.23×10⁵ Pa.由此可知,这两次地震破裂区之间的俯冲带上,库仑应力有了进一步的显著增强.Heidarzadeh等(2016)进一步比较两次地震的滑动分布,发现两次地震的破裂区域在32.5°S附近明显分开;值得注意的是,这个边界区域在2010年之后发生过超过20余次5级以上的地震,推测2010年马乌莱地震存在向北的同震应力转移,并诱发了活跃的边界区域地震活动从而导致了2015年伊拉佩尔地震的发生.从应力积累的角度看,我们认为2010年马乌莱地震有利于2015年伊拉佩尔地震的发生,对后者的发生起到了促进作用.
4 结论基于有限断层模型,通过远场波形资料得到了2015年伊拉佩尔MW8.3地震和2010年马乌莱MW8.8地震震源破裂过程图像.结果显示这两次地震均为逆冲型大地震,2015伊拉佩尔地震的平均滑动角度为107°,平均滑动量为2.43 m,平均破裂速度为1.82 km·s-1,标量地震矩为3.28×10²¹ Nm.2010马乌莱地震的平均滑动角度为109°,平均滑动量为4.95 m,平均破裂速度为1.90 km·s-1,地震矩张量为1.86×10²² Nm.2015伊拉佩尔地震的矩心深度为21.2 km,最大滑动量深度为8 km,而2010马乌莱地震的矩心深度为30.0 km,最大滑动量深度为21 km,前者更强的浅部滑动量分布应该是其引起了更大的海啸的一个原因.
基于滑动分布,计算了2015年伊拉佩尔和2010年马乌莱这两次地震引起的周边俯冲带断层上的静态库仑应力变化,结果显示,两次地震均使得周边俯冲带上的库仑应力显著增加,2010年马乌莱地震使得2015年伊拉佩尔地震破裂区附近库仑应力增加了(0.01~0.15)×105 Pa,从应力积累的角度看,2010年马乌莱地震有利于2015年伊拉佩尔地震的发生,对后者的发生起到了促进作用.
致谢远场波形资料下载于国际地震学研究联合会(IRIS).
| Beck S, Barrientos S, Kausel E, et al. 1998. Source characteristics of historic earthquakes along the central Chile subduction Askew et alzone. Journal of South American Earth Sciences, 11(2): 115-129. DOI:10.1016/S0895-9811(98)00005-4 | |
| Brooks B A, Bevis M, Smalley R Jr, et al. 2003. Crustal motion in the Southern Andes (26~36°S):Do the Andes behave like a microplate?. Geochemistry, Geophysics, Geosystems, 4(10): 1085. DOI:10.1029/2003GC000505 | |
| Cocco M, Rice J R. 2002. Pore pressure and poroelasticity effects in Coulomb stress analysis of earthquake interactions. Journal of Geophysical Research, 107(B2): ESE 2-1--ESE 2-17. DOI:10.1029/2000JB000138 | |
| Comte D, Pardo M. 1991. Reappraisal of great historical earthquakes in the northern Chile and southern Peru seismic gaps. Natural Hazards, 4(1): 23-44. DOI:10.1007/BF00126557 | |
| Delouis B, Nocquet J M, Vallée M. 2010. Slip distribution of the February 27, 2010 MW=8.8 Maule earthquake, central Chile, from static and high-rate GPS, InSAR, and broadband teleseismic data. Geophysical Research Letters, 37(17): L17305. DOI:10.1029/2010GL043899 | |
| DeMets C, Gordon R G, Argus D F. 2010. Geologically current plate motions. Geophysical Journal International, 181(1): 1-80. DOI:10.1111/gji.2010.181.issue-1 | |
| Haberland C, Rietbrock A, Lange D, et al. 2009. Structure of the seismogenic zone of the southcentral Chilean margin revealed by local earthquake traveltime tomography. Journal of Geophysical Research, 114(B1): B01317. DOI:10.1029/2008JB005802 | |
| Hartzell S H, Heaton T H. 1983. Inversion of strong ground motion and teleseismic waveform data for the fault rupture history of the 1979 Imperial Valley, California, earthquake. Bulletin of the Seismological Society of America, 73(6): 1553-1583. | |
| Heidarzadeh M, Murotani S, Satake K, et al. 2016. Source model of the 16 September 2015 Illapel, Chile, MW8.4 earthquake based on teleseismic and tsunami data. Geophysical Research Letters, 43(2): 643-650. DOI:10.1002/2015GL067297 | |
| Ji C, Wald D J, Helmberger D V. 2002. Source description of the 1999 Hector Mine, California, earthquake, part Ⅰ:Wavelet domain inversion theory and resolution analysis. Bulletin of the Seismological Society of America, 92(4): 1192-1207. DOI:10.1785/0120000916 | |
| Kanamori H. 1977. The energy release in great earthquakes. Journal of Geophysical Research, 82(20): 2981-2987. DOI:10.1029/JB082i020p02981 | |
| King G C P, Stein R S, Lin J. 1994. Static stress changes and the triggering of earthquakes. Bulletin of the Seismological Society of America, 84(3): 935-953. | |
| Lay T, Ammon C J, Kanamori H, et al. 2010. Teleseismic inversion for rupture process of the 27 February 2010 Chile (MW 8.8) earthquake. Geophysical Research Letters, 37(13): L13301. DOI:10.1029/2010GL043379 | |
| Lay T, Yue H, Brodsky E E, et al. 2014. The 1 April 2014 Iquique, Chile, MW8.1 earthquake rupture sequence. Geophysical Research Letters, 41(11): 3818-3825. DOI:10.1002/2014GL060238 | |
| Liu C L, Zheng Y, Ge C, et al. 2013. Rupture Process of the Ms7.0 Lushan Earthquake. Science China Earth Sciences, 56(7): 1187-1192. DOI:10.1007/s11430-013-4639-9 | |
| Liu C L, Zheng Y, Wang R J, et al. 2015. Kinematic rupture process of the 2014 Chile MW8.1 earthquake constrained by strong-motion, GPS static offsets and teleseismic data. Geophysical Journal International, 202(2): 1137-1145. DOI:10.1093/gji/ggv214 | |
| Lomnitz C. 2004. Major earthquakes of Chile:a historical survey, 1535-1960. Seismological Research Letters, 75(3): 368-378. DOI:10.1785/gssrl.75.3.368 | |
| Ma K F, Chan C H, Stein R S. 2005. Response of seismicity to Coulomb stress triggers and shadows of the 1999 MW=7.6 Chi-Chi, Taiwan, earthquake. Journal of Geophysical Research, 110(B5): B05S19. DOI:10.1029/2004JB003389 | |
| MéTois M, Socquet A, Vigny C. 2012. Interseismic coupling, segmentation and mechanical behavior of the central Chile subduction zone. Journal of Geophysical Research, 117(B3): B03406. DOI:10.1029/2011JB008736 | |
| Moreno M, Rosenau M, Oncken O. 2010. 2010 Maule earthquake slip correlates with pre-seismic locking of Andean subduction zone. Nature, 467(7312): 198-202. DOI:10.1038/nature09349 | |
| Okada Y. 1985. Surface deformation due to shear and tensile faults in a half-space. Bulletin of the Seismological Society of America, 75(4): 1135-1154. | |
| Shao G F, Li X Y, Ji C, et al. 2011. Focal mechanism and slip history of the 2011 MW9.1 off the Pacific coast of Tohoku Earthquake, constrained with teleseismic body and surface waves. Earth, Planets and Space, 63(7): 559-564. DOI:10.5047/eps.2011.06.028 | |
| Stein R S, King G C P, Lin J. 1992. Change in failure stress on the southern San Andreas fault system caused by the 1992 magnitude=7.4 Landers earthquake. Science, 258(5086): 1328-1332. DOI:10.1126/science.258.5086.1328 | |
| Toda S, Stein R S, Reasenberg P A, et al. 1998. Stress transferred by the 1995 MW=6.9 Kobe, Japan, shock:Effect on aftershocks and future earthquake probabilities. Journal of Geophysical Research:Solid Earth, 103(B10): 24543-24565. DOI:10.1029/98JB00765 | |
| Vigny C, Socquet A, Peyrat S, et al. 2011. The 2010 MW8.8 Maule megathrust earthquake of Central Chile, monitored by GPS. Science, 332(6036): 1417-1421. DOI:10.1126/science.1204132 | |
| Wang K L. 2015. Subduction faults as We see them in the 21st Century.//AGU Fall Meeting Abstracts. Washington:AGU. | |
| Wang W M, Zhao L F, Li J, et al. 2008. Rupture process of the MS8.0 Wenchuan earthquake of Sichuan, China. Chinese Journal of Geophysics, 51(5): 1403-1410. DOI:10.3321/j.issn:0001-5733.2008.05.013 | |
| Yao Z X, Ji C. 1997. The inverse problem of finite fault study in time domain. Chinese Journal of Geophysics, 40(5): 691-701. | |
| Ye L L, Lay T, Kanamori H, et al. 2016. Rapidly estimated seismic source parameters for the 16 September 2015 Illapel, Chile MW8.3 earthquake. Pure and Applied Geophysics, 173(2): 321-332. DOI:10.1007/s00024-015-1202-y | |
| Zhang Y, Xu L S, Chen Y T. 2013. Rupture process of the Lushan 4.20 earthquake and preliminary analysis on the disaster-causing mechanism. Chinese Journal of Geophysics, 56(4): 1408-1411. DOI:10.6038/cjg20130435 | |
| 刘成利, 郑勇, 葛粲, 等. 2013. 2013年芦山7.0级地震的动态破裂过程. 中国科学:地球科学, 43(6): 1020–1026. | |
| 王卫民, 赵连锋, 李娟, 等. 2008. 四川汶川8.0级地震震源过程. 地球物理学报, 51(5): 1403–1410. DOI:10.3321/j.issn:0001-5733.2008.05.013 | |
| 姚振兴, 纪晨. 1997. 时间域内有限地震断层的反演问题. 地球物理学报, 40(5): 691–701. | |
| 张勇, 许力生, 陈运泰. 2013. 芦山4.20地震破裂过程及其致灾特征初步分析. 地球物理学报, 56(4): 1408–1411. DOI:10.6038/cjg20130435 | |