 2017, Vol. 60


2. 中国科学院计算地球动力学重点实验室, 北京 100049
2. Key Laboratory of Computational Geodynamics, Chinese Academy of Sciences, Beijing 100049, China
岩石圈-软流圈边界(lithosphere-asthenosphere boundary, 简称LAB)是地球内部相对刚性岩石圈和相对黏塑性软流圈之间的分界面(Eaton et al., 2009; Fischer et al., 2010), 其性质也被认为是理解板块构造理论的重要基础(魏荣强和李午阳, 2015).作为上地幔中力学性质发生明显变化的界面(Eaton et al., 2009), LAB的存在形态对于板块汇聚或大陆/海洋岩石圈向地球深部俯冲的地质构造过程具有重要影响(Stern, 2002; Artemieva, 2011).在深度方向上, LAB为岩石圈的高速向软流圈的低速转变的过渡区间(Fischer et al., 2010).地震学家通常将上地幔地震波低速区(low velocity zone)作为软流圈出现的标志(Gutenberg, 1959; Romanowicz, 2009), 其低速特征一般被认为与地幔物质部分熔融(partial melting)或者脱水(dehydration)等因素有关(Karato and Jung, 1998; Kawamoto et al., 2013).对LAB的存在形态开展地震学探测有助于进一步认识地幔对流、板块运动以及岩石圈演化等地球动力学过程.
南美地区是海洋板块俯冲所导致的大陆深震区之一(如, Cahill and Isacks, 1992).至少从晚白垩纪开始, 纳兹卡板块(Nazca plate)在秘鲁—智利海沟(Peru-Chile trench)处以低角度俯冲于南美板块(South American plate)下方(Pardo-Casas and Molnar, 1987).南美俯冲带属于平缓的“智利型”俯冲带(Uyeda and Kanamori, 1979), 纳兹卡板块和南美板块之间的汇聚速率约为6.6 cm·a-1(Kendrick et al., 2003), 俯冲板块与上覆大陆板块之间接触面积大且存在紧密的耦合作用, 大陆弧受到挤压而上升形成安第斯山脉(Andean mountain)(郑永飞等, 2015).长时间持续的洋-陆汇聚作用也被认为与沿俯冲带发生的地震和火山活动是直接相关的(Cahill and Isacks, 1992; Contenti et al., 2012).
南美地区上地幔速度结构是地震学家的研究热点之一(如,Collier and Helffrich, 2001; Heit et al., 2007; Schmerr and Garnero, 2007; Li et al., 2008a; 周元泽和眭怡, 2010).全球地震层析成像研究显示纳兹卡板块在南美中部地区上地幔浅部的俯冲较为平缓(Li et al., 2008a), 在地幔转换带底部未发生滞留而直接穿过了660 km间断面而进入下地幔(Ritsema et al., 2004; Fukao and Obayashi, 2013).从秘鲁—智利海沟至下地幔顶部范围内, 纳兹卡板块显示为明显的地震波高波速异常(Li et al., 2008a; Fukao and Obayashi, 2013).冷俯冲板块的存在影响了南美地区上地幔间断面的起伏特征:近源SdP震相叠加得出410 km间断面在南美俯冲带地区最大抬升幅度为60 km, 在远离俯冲带的地区未发生明显变化; 660 km间断面的下沉幅度为33 km (Collier and Helffrich, 2001).SS前驱波叠加研究也揭示了410 km和660 km间断面类似的特征(Schmerr and Garnero, 2007).受南美地区台站分布较为稀疏的限制, 有关LAB的报道并不多见.接收函数研究显示南美地区Moho深度从南美大陆西海岸到安第斯山地区为18~80 km, LAB的深度为50~160 km (Heit et al., 2007), 且Moho和LAB在俯冲带地区均显示出自西向东逐渐增大的趋势(Yuan et al., 2000; Heit et al., 2007; Phillips et al., 2012; Phillips and Clayton, 2014).
本文选用多个国家或地区的部分固定台网和/或流动台阵所记录的南美中部地区4个深源地震的波形资料, 利用线性倾斜叠加方法提取了sP在LAB底反射的前驱震相(sLABP), 对南美中部地区LAB的起伏形态进行了小尺度地震学探测, 以进一步认识与纳兹卡板块俯冲有关的构造活动对南美大陆岩石圈的影响和作用.
2 资料选取与处理sdP震相为离源上行的S波在遇到震源上方的间断面(深度为d)时反射并转换为下行P波, 即sP的前驱波(图 1).近源震相(如, sdP, SdP和pdP)具有较小的菲涅尔区(Fresnel zone), 因此对地球内部结构的分辨率要相对更高一些(Helffrich, 2000; Rost and Thomas, 2002; 蒋志勇等, 2003; 臧绍先等, 2003; Zhou et al., 2012; 崔辉辉等, 2017).深源地震的sP和pP震相之间具有足够长的走时空窗, 因此sdP震相不会受到pP及其地壳内多次反射波的干扰.sP和sdP震相射线路径差别主要集中在地表与间断面之间(图 1), 两震相的走时差与慢度差能有效约束间断面的形态(Flanagan and Shearer, 1998; Zheng et al., 2007; 王晓冉等, 2015;秦满忠等, 2016; Cui et al., 2017).由于sdP自身能量较弱, 可能会受到背景噪声的干扰而不容易直接被识别, 因此本文采用线性倾斜叠加(linear slant stack)方法来增强信号的强度.线性倾斜叠加是N次根倾斜叠加方法(Nth-root stack method)(McFadden et al., 1986; 周元泽和臧绍先, 2001; Jiang et al., 2002; Zang et al., 2006; Li et al., 2008b; 周元泽和王卓君, 2011; 谢彩霞等, 2012; 眭怡等, 2015; Yang and He, 2015)的特殊形式, 优点在于数据处理过程中不会产生波形畸变现象, 可较好地评价次生震相的振幅特性(臧绍先和周元泽, 2002; Rost and Thomas, 2009).

|
图 1 sP及前驱震相射线路径示意图 射线路径上虚线为S波, 实线为P波.sdP为上行S波在震源上方间断面底反射并转换为下行P波. Fig. 1 Schematic illustration describing the sP phase and its precursor (sdP) The dashed and solid lines denote the S and P waves in ray paths, respectively. The sdP phase is the underside reflection and conversion of an upgoing S wave to a downgoing P wave on a discontinuity above the source. |
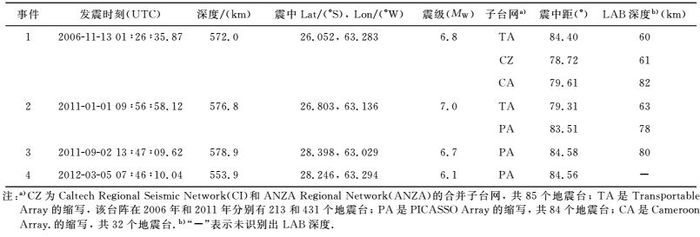
本文收集了2006—2012年发生于南美中部地区的深源地震事件(500~600 km, MW>6.0), 选用了高密度固定台网和流动台阵所记录的远震中距(75°~90°)垂向宽频带波形资料, 其中固定台网包括美国西部的Caltech Regional Seismic Network (简称CI)和ANZA Regional Network (简称ANZA), 考虑到台站分布因素而将两个台网合并为子台网CZ; 流动台阵包括2006年和2011年美国地区布设的Transportable Array (简称TA), 地中海地区的PICASSO Array (简称PA)和非洲西部的Cameroon Array (简称CA)(图 2).地震波形数据下载于美国地震学研究联合会(Incorporated Research Institutions for Seismology, 简称IRIS)网站(http://www.iris.edu/).我们从收集的地震事件中仔细挑选出sP持续时长不超过20 s、波形简单且信噪比高的4个地震事件, 共计7个地震事件-子台网分组(表 1).震源参数引自美国地质调查局(U.S.Geological Survey)提供的PDE (Preliminary Determination of Epicenters)目录(http://earthquake.usgs.gov/data/pde.php), 震源机制解参数引自全球质心矩张量解(Global Centroid-Moment-Tensor, 简称GCM T)(http://www.globalcmt.org/)(Dziewonski et al., 1981; Ekström et al., 2012).
|
|
表 1 本文所用地震事件和sLABP震相反射深度列表 Table 1 Earthquakes used and reflected depths of the sLABP phases |

|
图 2 震源-台站示意图和各子台网的台站分布 (a)矩形表示震中位置, 三角形表示台网/台阵分布;(b)紫色三角形为子台网CZ, 灰色和黑色三角形分别为2006和2011年的TA台阵;(c)红色和蓝色三角形分别为PA和CA台阵. Fig. 2 Source-receiver geometry and station distribution of each sub-network (a) The rectangle denotes the epicenter location, and the triangles denote the network/array distribution; (b) Purple triangles denote the sub-network CZ, and the gray and black ones denote the TA at 2006 and 2010, respectively; (c) The red and blue triangles denote the PA and CA, respectively. |
本文地震数据处理的主要步骤如下: (1) 对原始地震数据进行去均值、去线性趋势和去仪器响应处理.(2) 对地震数据进行0.01~0.20 Hz的带通滤波处理.(3) 对各分组的波形以sP峰值点对齐并归一化, 观测波形示例见图 3.选取信噪比最好的60道数据进行线性倾斜叠加处理(如果子台网挑选后的波形数据小于60道, 则全部用于处理)得到叠加波形.(4) 将叠加波形数据进行Hilbert变换获得包络线, 进一步做以10为底的对数并乘以20倍的处理, 绘制相对走时-慢度域的灰度图(Vespagram).(5) 浅部地壳速度结构可能会影响sP震相的传播, 因此本文利用CRUST1.0模型(Laske et al., 2012)对IASP91模型(Kennett and Engdahl, 1991)的地壳部分速度结构进行改进而得到IASP91-SA模型(图 4), 利用TauP程序(Buland and Chapman, 1983; Crotwell et al., 1999)计算sdP相对于sP的理论走时差和慢度差以进行震相识别.(6) 计算所识别sdP次生震相反射点的水平和深度分布.

|
图 3 子台网PA记录的地震事件3的观测波形(a)和叠加波形(b) 归一化sP震相的峰值点均对应于0 s时刻.标有“s80P”的虚线分别为80 km界面处sdP震相的到时. Fig. 3 Observed waveforms of Event 3 recorded by the sub-network PA (a) and the stacked waveform (b) The peaks of the normalized sP phases are all at the time of 0 s.The dashed line with the "s80P" denote the arrival times for the sdP phases on the discontinuity at the depth of 80 km, respectively. |

|
图 4 南美中部地区IASP91-SA模型的P波和S波速度图 地壳部分速度引自CRUST1.0模型(Laske et al., 2012), 地幔部分引自IASP91模型(Kennett and Engdahl, 1991).实线和虚线分别为P波和S波速度.410表示410 km间断面. Fig. 4 P-and S-wave velocities of the IASP91-SA model for the central South America area The velocities of the crust part are from the CRUST1.0 model (Laske et al., 2012), and the ones of the mantle part are from the IASP91 model (Kennett and Engdahl, 1991).Solid and dashed lines denote the P-and S-wave velocities, respectively.The 410 denotes the 410 km discontinuity. |
反射点深度误差主要来自次生震相的走时拾取误差和地幔物质横向不均匀性引起的走时偏差.手动拾取次生震相的走时误差一般控制在0.5 s之内(Chen et al., 2014), 以IASP91-SA模型换算后深度误差大致为2 km.基于P波层析成像模型GAP_P4(Obayashi et al., 2013)和S波层析成像模型S40RTS (Ritsema et al., 2011),利用二维射线追踪(Rawlinson and Sambridge, 2004)测试得出地震射线传播路径上速度不均匀性导致的反射点深度误差为2 km, 对反射点水平位置造成的误差在3~4 km.深震的深度定位误差对sdP和sP之间走时差及慢度差的影响很小, 对反射点水平位置造成的误差小于10 km (Collier and Helffrich, 1997; Collier et al., 2001).因此得出反射点深度误差约为4 km, 水平位置不确定性小于13~14 km.
3 结果由图 5中的倾斜叠加灰度图可见, 0 s时刻对应于sP峰值点且能量最强.由sdP相对于sP的走时差和慢度差的分布可见, 理论sdP与sP的走时差基本保持不变且慢度差很小, 在此变化趋势范围内的次生震相可以被识别为sdP震相.根据地震射线的方位角分布, 将6个地震事件-子台网分组划分为两部分(图 5a—5c和5d—5f), 这对应于图 7中sdP震相反射点分区的划分(分区Ⅰ和分区Ⅱ).

|
图 5 线性倾斜叠加灰度图 白色加号表示基于IASP91-SA模型计算的理论sdP震相.绿色线为sdP相对于sP的理论走时差和慢度差分布.箭头指向sdP震相的位置, 相应的数字为反射点深度. Fig. 5 Vespagrams of the linear slant stacks White pluses denote the theoretical sdP phases calculated with the IASP91-SA model.Green lines represent the theoretical travel-time and slowness differences of the sdP phase relative to the sP phase.The arrows with the numbers point to the sdP phases and their reflected depths. |

|
图 6 分区Ⅰ和分区Ⅱ叠加波形的偏移结果 灰色标记的序号a—f与图 5中的序号对应,填充波形的黑色和灰色分别表示正振幅和负振幅. Fig. 6 The migration results of the stacked waveforms of part Ⅰ and part Ⅱ The sequence numbers a—f marked in gray correspond to the ones in Fig. 5.The black and gray colors filled in the waveforms indicate the positive and negative amplitudes, respectively. |

|
图 7 反射点的水平(a, b)和深度(c)分布 (a)反射点水平投影被划分为分区Ⅰ和分区Ⅱ, 序号a—f与图 5中的序号对应.陆地地形数据引自ETOPO1模型(Amante and Eakins, 2009).灰色虚线为和达—贝尼奥夫带等深线(Gudmundsson and Sambridge, 1998), 显示出纳兹卡板块的俯冲深度.(b) LAB深度等值线数据引自LITHO1.0模型(Pasyanos et al., 2014).(c)地震层析成像深度剖面(27°S), 数据引自GAP_P4模型(Obayashi et al., 2013). Fig. 7 Horizontal (a, b) and depth (c) distribution of reflected points (a) Horizontal distribution of reflected points are separated into part Ⅰ and part Ⅱ, and the sequence numbers a—f correspond to the ones in Fig. 5.The land topography data is taken from the ETOPO1 model (Amante and Eakins, 2009).Gray dashed lines represent the Wadati-Benioff zone (Gudmundsson and Sambridge, 1998), indicating the subducted depths of the Nazca Plate.(b) The contour data of LAB depths is taken from the LITHO1.0 model (Pasyanos et al., 2014).(c) The data for the tomographic depth section (27°S) is taken from the GAP_P4 model (Obayashi et al., 2013). |
由图 5a—5c可见, 次生震相整体上分布较少.在sP前25~30 s内均存在一个明显的次生震相, 与sP的相对慢度差较小(-0.06~0.06 s·deg-1), 经时深转换后得出的深度位于60~63 km; 由图 5d—5f可见, 在sP前30~40 s内均存在一个明显的次生震相, 与sP的相对慢度差较小(-0.06~0.09 s·deg-1), 经时深转换后得出的深度位于78~82 km.通过图 6中的叠加波形可看出所识别的sdP震相与sP极性相反, 分区Ⅰ(0.24~0.26) 内的振幅比大于分区Ⅱ的(0.03~0.16).结合Heit等(2007)利用接收函数方法得到的南美地区LAB深度(50~150 km), 可确定所识别的sdP次生震相为sP在LAB底反射的前驱震相(sLABP).
叠加灰度图中sdP次生震相的能量或幅度有所差异(图 5), 这可能体现了所用地震事件的震源机制不同导致辐射花样(radiation pattern)的差别或者俯冲板块残片及局部散射体对地震波传播的影响(Vinnik et al., 1998; Niu et al., 2003; Chen et al., 2014; Kaneshima, 2016).本文叠加结果中未识别出smP震相, 在其他近源震相叠加研究中(如, Flanagan and Shearer, 1998; Zheng et al., 2007; 王晓冉等, 2015) Moho也未被识别出来, 这可能与地壳结构的复杂性或者地震资料中的噪声干扰有关, 也可能是近源sP震相分辨能力的限制.此外, 在图 5a中, sP前20~25 s内存在一个次生震相, 换算后的深度为40 km, 与邻近地区Moho深度(43~65 km) (Heit et al., 2007)较为接近,但其极性与sP极性相反, 因此该次生震相可能不是smP,这有待进一步识别.
4 讨论与结论6个sLABP次生震相的反射点在深度方向上位于南美板块的底边界,而反射点(a—f和d—f)地表投影位于南美中部地区(图 7a).分区Ⅰ内LAB深度位于60~63 km, 平均深度为61 km, 起伏为3 km; 分区Ⅱ内LAB深度位于78~82 km, 平均深度为80 km, 起伏为4 km.分区Ⅰ比分区Ⅱ更靠近秘鲁—智利海沟, 分区Ⅰ的LAB平均深度较分区Ⅱ的要小19 km, 因此本文研究显示出LAB深度自西向东呈变大的趋势, 岩石圈厚度增大的方向与板块俯冲方向一致.
本文将sLABP次生震相反射点与面波频散研究得出的LITHO1.0模型(Pasyanos et al., 2014)进行对比, 发现在研究区域北部LAB深度较为接近, 而在南部有所差异, 但LAB深度自西向东的变大趋势是一致的(图 7b).分区Ⅱ内反射点(d—f)距离海沟的距离基本相同且得到的LAB深度也较为接近, 因此本文得出的LAB等深线基本是平行于海沟的, 这比LITHO1.0的结果更为合理.图 7c给出了该区域纬度为27°S的P波层析成像深度剖面, 纳兹卡板块以地震波高速异常形式存在; 板块上方存在地震波低速异常, 一般认为是与地幔楔(mantle wedge)的存在有关(Huang and Zhao, 2006; Li et al., 2008a; Fukao and Obayashi, 2013).我们将次生震相的反射点投影到层析成像深度剖面上, 发现反射点大部分位于板块上方的低速异常区附近, 由反射点的分布可拟合出LAB的倾角约为5°.二维射线追踪(Rawlinson and Sambridge, 2004)测试显示5°间断面倾斜对间断面深度的误差在1~3 km, 平均为2 km.接收函数研究显示远离俯冲带的南美大陆地区岩石圈厚度为80~160 km (Heit et al., 2007).由此可见, 处于俯冲带地区的分区Ⅰ和分区Ⅱ下方岩石圈厚度是相对偏小的.
纳兹卡板块在秘鲁—智利海沟处俯冲于南美大陆下方(郑永飞等, 2015).在地球内部温度和压力环境下, 俯冲下去的板块通过脱水作用在不同深度持续释放水等挥发分物质(Ohtani, 2005; Ohtani and Zhao, 2009), 进而引发软流圈物质出现部分熔融并且导致地幔楔内的小尺度对流更为活跃(Karato and Jung, 1998; Karato, 2012).数值模拟研究表明, 软流圈内的小尺度对流对岩石圈底部具有强烈的侵蚀作用, 从而引发岩石圈出现减薄(He, 2014).本文观测到南美中部地区LAB深度自西向东呈增大的趋势, 这可能反映了大陆岩石圈受改造程度的差异.因此我们推测在靠近海沟的地区, 软流圈内部分熔融程度较高且熔体较为富集, 对大陆岩石圈的侵蚀作用较强; 在远离海沟的地区, 软流圈内部分熔融程度降低且熔体分布减少, 对大陆岩石圈的侵蚀作用减弱.
致谢美国地震学研究联合会数据管理中心(IRIS DMC)为本研究提供了地震波形数据支持.中国科学院大学魏荣强副教授和Array Information Technology陈友麟博士在论文撰写中给予了帮助.两位审稿人提出的宝贵意见和修改建议提升了论文的水平.文中的图件主要采用了Generic Mapping Tools (Wessel and Smith, 1998)绘制.作者在此一并表示衷心感谢.
| Amante C, Eakins B W. 2009. ETOPO1:1 arc-minute global relief model:procedures, data sources and analysis. NOAA Technical Memorandum NESDIS NGDC-24. National Geophysical Data Center, NOAA, doi:10.7289/V5C8276M. | |
| Artemieva I M. 2011. The Lithosphere, An Interdisciplinary Approach. New York:Cambridge University Press. | |
| Buland R, Chapman C H. 1983. The computation of seismic travel times. Bull. Seismol. Soc. Am., 73(5): 1271-1302. | |
| Cahill T, Isacks B L. 1992. Seismicity and shape of the subducted Nazca Plate. J. Geophys. Res., 97(B12): 17503-17529. DOI:10.1029/92jb00493 | |
| Chen J, Zhou Y Z, Wang H C. 2014. Detection of the Lehmann discontinuity beneath Tonga with short-period waveform data from Hi-net. Science China Earth Sciences, 57(8): 1953-1960. DOI:10.1007/s11430-014-4834-3 | |
| Collier J D, Helffrich G R. 1997. Topography of the "410" and "660" km seismic discontinuities in the Izu-Bonin subduction zone. Geophys. Res. Lett., 24(12): 1535-1538. DOI:10.1029/97gl01383 | |
| Collier J D, Helffrich G R. 2001. The thermal influence of the subducting slab beneath South America from 410 and 660 km discontinuity observations. Geophys. J. Int., 147(2): 319-329. DOI:10.1046/j.1365-246X.2001.00532.x | |
| Collier J D, Helffrich G R, Wood B J. 2001. Seismic discontinuities and subduction zones. Phys. Earth Planet. Inter., 127(1-4): 35-49. DOI:10.1016/S0031-9201(01)00220-5 | |
| Contenti S, Gu Y J, Ökeler A, et al. 2012. Shear wave reflectivity imaging of the Nazca-South America subduction zone:stagnant slab in the mantle transition zone?. Geophys. Res. Lett., 39(2): L02310. DOI:10.1029/2011gl050064 | |
| Crotwell H P, Owens T J, Ritsema J. 1999. The TauP toolkit:flexible seismic travel-time and ray-path utilities. Seismol. Res. Lett., 70(2): 154-160. DOI:10.1785/gssrl.70.2.154 | |
| Cui H H, Gao Y J, Zhou Y Z. 2017. Seismic evidence of the lithosphere-asthenosphere boundary beneath Izu-Bonin area. Chin. Sci. Bull., 62(7): 711-720. DOI:10.1360/N972016-00889 | |
| Cui H H, Zhou Y Z, Chen Y L. 2017. Seismic evidence of the lithosphere-asthenosphere boundary beneath the Tonga area, southwestern Pacific. J. Asian Earth Sci., 138: 129-135. DOI:10.1016/j.jseaes.2017.02.013 | |
| Dziewonski A M, Chou T A, Woodhouse J H. 1981. Determination of earthquake source parameters from waveform data for studies of global and regional seismicity. J. Geophys. Res., 86(B4): 2825-2852. DOI:10.1029/JB086iB04p02825 | |
| Eaton D W, Darbyshire F, Evans R L, et al. 2009. The elusive lithosphere-asthenosphere boundary (LAB) beneath cratons. Lithos, 109(1-2): 1-22. DOI:10.1016/j.lithos.2008.05.009 | |
| Ekström G, Nettles M, Dziewoński A M. 2012. The global CMT project 2004-2010:centroid-moment tensors for 13, 017 earthquakes. Phys. Earth Planet. Inter., 200-201: 1-9. DOI:10.1016/j.pepi.2012.04.002 | |
| Fischer K M, Ford H A, Abt D L, et al. 2010. The lithosphere-asthenosphere boundary. Annu. Rev. Earth Planet. Sci., 38(1): 551-575. DOI:10.1146/annurev-earth-040809-152438 | |
| Flanagan M P, Shearer P M. 1998. Topography on the 410 km seismic velocity discontinuity near subduction zones from stacking of sS, sP, and pP precursors. J. Geophys. Res., 103(B9): 21165-21182. DOI:10.1029/98jb00595 | |
| Fukao Y, Obayashi M. 2013. Subducted slabs stagnant above, penetrating through, and trapped below the 660 km discontinuity. J. Geophys. Res., 118(11): 5920-5938. DOI:10.1002/2013JB010466 | |
| Gudmundsson ó, Sambridge M. 1998. A regionalized upper mantle (RUM) seismic model. J. Geophys. Res., 103(B4): 7121-7136. DOI:10.1029/97jb02488 | |
| Gutenberg B. 1959. Physics of the Earth's Interior. New York: Academic Press. | |
| He L J. 2014. Numerical modeling of convective erosion and peridotite-melt interaction in big mantle wedge:implications for the destruction of the North China Craton. J. Geophys. Res., 119(4): 3662-3677. DOI:10.1002/2013jb010657 | |
| Heit B, Sodoudi F, Yuan X H, et al. 2007. An S receiver function analysis of the lithospheric structure in South America. Geophys. Res. Lett., 34(14): L14307. DOI:10.1029/2007gl030317 | |
| Helffrich G. 2000. Topography of the transition zone seismic discontinuities. Rev. Geophys., 38(1): 141-158. DOI:10.1029/1999RG000060 | |
| Huang J L, Zhao D P. 2006. High-resolution mantle tomography of China and surrounding regions. J. Geophys. Res., 111(B9): B09305. DOI:10.1029/2005JB004066 | |
| Jiang Z Y, Zang S X, Zhou Y Z. 2002. Topographies of seismic velocity discontinuities and penetrations of subducting slabs beneath the Sea of Okhotsk. Chin. Sci. Bull., 47(24): 2034-2041. DOI:10.1360/02tb9441 | |
| Kaneshima S. 2016. Seismic scatterers in the mid-lower mantle. Phys. Earth Planet. Inter., 257: 105-114. DOI:10.1016/j.pepi.2016.05.004 | |
| Karato S I. 2012. On the origin of the asthenosphere. Earth Planet. Sci. Lett., 321-322: 95-103. DOI:10.1016/j.epsl.2012.01.001 | |
| Karato S I, Jung H. 1998. Water, partial melting and the origin of the seismic low velocity and high attenuation zone in the upper mantle. Earth Planet. Sci. Lett., 157(3-4): 193-207. DOI:10.1016/S0012-821X(98)00034-X | |
| Kawamoto T, Yoshikawa M, Kumagai Y, et al. 2013. Mantle wedge infiltrated with saline fluids from dehydration and decarbonation of subducting slab. Proc. Natl. Acad. Sci. USA, 110(24): 9663-9668. DOI:10.1073/pnas.1302040110 | |
| Kendrick E, Bevis M, Smalley R Jr, et al. 2003. The Nazca-South America Euler vector and its rate of change. J. South Am. Earth Sci., 16(2): 125-131. DOI:10.1016/S0895-9811(03)00028-2 | |
| Kennett B L N, Engdahl E R. 1991. Traveltimes for global earthquake location and phase identification. Geophys. J. Int., 105(2): 429-465. DOI:10.1111/j.1365-246X.1991.tb06724.x | |
| Laske G, Masters G, Ma Z, et al. 2012. CRUST1.0:An updated global model of Earth's crust. EGU General Assembly, 14:3743, http://igppweb.ucsd.edu/~gabi/crust1.html. | |
| Li C, Van Der Hilst R D, Engdahl E R, et al. 2008a. A new global model for P wave speed variations in Earth's mantle. Geochem. Geophys. Geosyst., 9(5): Q05018. DOI:10.1029/2007GC001806 | |
| Li J, Chen Q F, Vanacore E, et al. 2008b. Topography of the 660 km discontinuity beneath northeast China:implications for a retrograde motion of the subducting Pacific slab. Geophys. Res. Lett., 35(1): L01302. DOI:10.1029/2007GL031658 | |
| McFadden P L, Drummond B J, Kravis S. 1986. The Nth-root stack:theory, applications, and examples. Geophysics, 51(10): 1879-1892. DOI:10.1190/1.1442045 | |
| Niu F L, Kawakatsu H, Fukao Y. 2003. Seismic evidence for a chemical heterogeneity in the midmantle:a strong and slightly dipping seismic reflector beneath the Mariana subduction zone. J. Geophys. Res., 108(B9): 2419. DOI:10.1029/2002jb002384 | |
| Obayashi M, Yoshimitsu J, Nolet G, et al. 2013. Finite frequency whole mantle P wave tomography:improvement of subducted slab images. Geophys. Res. Lett., 40(21): 5652-5657. DOI:10.1002/2013gl057401 | |
| Ohtani E. 2005. Water in the mantle. Elements., 1(1): 25-30. DOI:10.2113/gselements.1.1.25 | |
| Ohtani E, Zhao D. 2009. The role of water in the deep upper mantle and transition zone:dehydration of stagnant slabs and its effects on the big mantle wedge. Russ. Geol. Geophys., 50(12): 1073-1078. DOI:10.1016/j.rgg.2009.11.006 | |
| Pardo-Casas F, Molnar P. 1987. Relative motion of the Nazca (Farallon) and South American plates since late Cretaceous time. Tectonics, 6(3): 233-248. DOI:10.1029/TC006i003p00233 | |
| Pasyanos M E, Masters T G, Laske G, et al. 2014. LITHO1.0:an updated crust and lithospheric model of the Earth. J. Geophys. Res., 119(3): 2153-2173. DOI:10.1002/2013JB010626 | |
| Phillips K, Clayton R W. 2014. Structure of the subduction transition region from seismic array data in southern Peru. Geophys. J. Int., 196(3): 1889-1905. DOI:10.1093/gji/ggt504 | |
| Phillips K, Clayton R W, Davis P, et al. 2012. Structure of the subduction system in southern Peru from seismic array data. J. Geophys. Res., 117(B11): B11306. DOI:10.1029/2012jb009540 | |
| Qin M Z, Zhang Y S, Liu X Z, et al. 2016. On "410" discontinuity depth of the Tonga-Fiji subduction zone by the sP precursor recorded by Gansu seismic network. Acta Seismologica Sinica, 38(1): 53-58. DOI:10.11939/jass.2016.01.005 | |
| Rawlinson N, Sambridge M. 2004. Wave front evolution in strongly heterogeneous layered media using the fast marching method. Geophys. J. Int., 156(3): 631-647. DOI:10.1111/j.1365-246X.2004.02153.x | |
| Ritsema J, Deuss A, Van Heijst H J, et al. 2011. S40RTS:a degree-40 shear-velocity model for the mantle from new Rayleigh wave dispersion, teleseismic traveltime and normal-mode splitting function measurements. Geophys. J. Int., 184(3): 1223-1236. DOI:10.1111/j.1365-246X.2010.04884.x | |
| Ritsema J, Van Heijst H J, Woodhouse J H. 2004. Global transition zone tomography. J. Geophys. Res., 109(B2): B02302. DOI:10.1029/2003jb002610 | |
| Romanowicz B. 2009. The thickness of tectonic plates. Science, 324(5926): 474-476. DOI:10.1126/science.1172879 | |
| Rost S, Thomas C. 2002. Array seismology:mehods and applications. Rev. Geophys., 40(3): 2-1. DOI:10.1029/2000rg000100 | |
| Rost S, Thomas C. 2009. Improving seismic resolution through array processing techniques. Surv. Geophys., 30(4): 271-299. DOI:10.1007/s10712-009-9070-6 | |
| Schmerr N, Garnero E J. 2007. Upper mantle discontinuity topography from thermal and chemical heterogeneity. Science, 318(5850): 623-626. DOI:10.1126/science.1145962 | |
| Stern R J. 2002. Subduction zones. Rev. Geophys., 40(4): 3-1. DOI:10.1029/2001RG000108 | |
| Sui Y, Zhou Y Z, Wang X R. 2015. The effects of stagnant slabs on the topography of 410 km discontinuity beneath the Pamir-Hindu Kush. Chinese J. Geophys., 58(1): 125-133. DOI:10.6038/cig20150110 | |
| Uyeda S, Kanamori H. 1979. Back-arc opening and the mode of subduction. J. Geophys. Res., 84(B3): 1049-1061. DOI:10.1029/JB084iB03p01049 | |
| Vinnik L, Niu F L, Kawakatsu H. 1998. Broadband converted phases from midmantle discontinuities. Earth, Planets and Space, 50(11-12): 987-997. DOI:10.1186/bf03352193 | |
| Wang X R, Li G H, Cui H H, et al. 2015. Constraining the discontinuity structure of the upper mantle beneath the Tonga-Fiji subduction zone based on secondary phases. Progress in Geophysics, 30(5): 2089-2099. DOI:10.6038/pg20150512 | |
| Wei R Q, Li W Y. 2015. Thermal-rheological bottom boundary of continental lithosphere:case studies on cratons of Kaapvaal, Fennoscandia, and Slave. J. Univ. Chin. Acad. Sci., 32(1): 74-81. | |
| Wessel P, Smith W H F. 1998. New, improved version of generic mapping tools released. EOS, Trans. Amer. Geophys. Union., 79(47): 579. DOI:10.1029/98EO00426 | |
| Xie C X, Zhou Y Z, Wang Z J, et al. 2012. Evidence of SdP conversion phases for the 300 km discontinuity beneath Tonga-Fiji region. Chinese J. Geophys., 55(5): 1591-1600. DOI:10.6038/j.issn.0001-5733.2012.05.017 | |
| Yang Z T, He X B. 2015. Oceanic crust in the mid-mantle beneath west-central Pacific subduction zones:evidence from S-to-P converted waveforms. Geophys. J. Int., 203(1): 541-547. DOI:10.1093/gji/ggv314 | |
| Yuan X H, Sobolev S V, Kind R, et al. 2000. Subduction and collision processes in the central Andes constrained by converted seismic phases. Nature, 408(6815): 958-961. DOI:10.1038/35050073 | |
| Zang S X, Zhou Y Z. 2002. The method of N-th root slant stack and its application in study of mantle discontinuities. Chinese J. Geophys., 45(3): 420-429. DOI:10.3321/j.issn:0001-5733.2002.03.012 | |
| Zang S X, Zhou Y Z, Jiang Z Y. 2003. Mantle discontinuities beneath Izu-Bonin and the implications. Science in China Series D:Earth Sciences, 46(12): 1201-1211. DOI:10.1360/02yd0059 | |
| Zang S X, Zhou Y Z, Ning J Y, et al. 2006. Multiple discontinuities near 660 km beneath Tonga area. Geophys. Res. Lett., 33(20): L20312. DOI:10.1029/2006GL027262 | |
| Zheng Y F, Chen Y X, Dai L Q, et al. 2015. Developing plate tectonics theory from oceanic subduction zones to collisional orogens. Science China Earth Sciences, 58(7): 1045-1069. DOI:10.1007/s11430-015-5097-3 | |
| Zheng Y C, Lay T, Flanagan M P, et al. 2007. Pervasive seismic wave reflectivity and metasomatism of the Tonga mantle wedge. Science, 316(5826): 855-859. DOI:10.1126/science.1138074 | |
| Zhou Y Z, Sui Y. 2010. On the velocity interfaces in the lower mantle beneath South America. Chinese J. Geophys., 53(1): 86-93. DOI:10.3969/j.issn.0001-5733.2010.01.009 | |
| Zhou Y Z, Wang Z J. 2011. On the difference of mid-mantle multiple velocity structure beneath Izu-Bonin and Tonga areas. Science China Earth Science, 41(7): 936-944. | |
| Zhou Y Z, Yu X W, Yang H, et al. 2012. Multiplicity of the 660-km discontinuity beneath the Izu-Bonin area. Phys. Earth Planet. Inter., 198-199: 51-60. DOI:10.1016/j.pepi.2012.03.003 | |
| Zhou Y Z, Zang S X. 2001. Mantle discontinuities beneath the stations MDJ and HIA and its implications. Chinese J. Geophys., 44(6): 761-773. DOI:10.3321/j.issn:0001-5733.2001.06.005 | |
| 崔辉辉, 高雅健, 周元泽. 2017. 伊豆-小笠原地区岩石圈软流圈边界地震学证据. 科学通报, 62(7): 711–720. DOI:10.1360/N972016-00889 | |
| 蒋志勇, 臧绍先, 周元泽. 2003. 鄂霍次克海下间断面的起伏及俯冲带的穿透. 科学通报, 48(4): 320–327. | |
| 秦满忠, 张元生, 刘旭宙, 等. 2016. 利用甘肃地震台网记录的sP前驱波研究汤加-斐济俯冲区"410"间断面深度. 地震学报, 38(1): 53–58. DOI:10.11939/jass.2016.01.005 | |
| 眭怡, 周元泽, 王晓冉. 2015. 帕米尔-兴都库什深俯冲残留体对410 km间断面起伏形态的影响. 地球物理学报, 58(1): 125–133. DOI:10.6038/cig20150110 | |
| 王晓冉, 李国辉, 崔辉辉, 等. 2015. 基于次生震相的汤加-斐济地区上地幔间断面结构研究. 地球物理学进展, 30(5): 2089–2099. DOI:10.6038/pg20150512 | |
| 魏荣强, 李午阳. 2015. 大陆岩石圈的热-流变底边界——以Kaapvaal、Fennoscandia和Slave克拉通为例. 中国科学院大学学报, 32(1): 74–81. | |
| 谢彩霞, 周元泽, 王卓君, 等. 2012. 汤加-斐济地区300 km间断面的SdP转换波证据. 地球物理学报, 55(5). DOI:10.6038/j.issn.0001-5733.2012.05.017 | |
| 臧绍先, 周元泽. 2002. N次根倾斜叠加方法在间断面研究中的应用. 地球物理学报, 45(3): 407–415. DOI:10.3321/j.issn:0001-5733.2002.03.012 | |
| 臧绍先, 周元泽, 蒋志勇. 2003. 伊豆-小笠原地区地幔间断面的起伏及其意义. 中国科学:D辑, 33(3): 193–201. | |
| 郑永飞, 陈伊翔, 戴立群, 等. 2015. 发展板块构造理论:从洋壳俯冲带到碰撞造山带. 中国科学:地球科学, 45(6): 711–735. DOI:10.1007/s11430-015-5097-3 | |
| 周元泽, 眭怡. 2010. 南美地区下地幔速度界面结构研究. 地球物理学报, 53(1): 86–93. DOI:10.3969/j.issn.0001-5733.2010.01.009 | |
| 周元泽, 王卓君. 2011. 伊豆-小笠原和汤加地区中地幔多层速度结构差异性研究. 中国科学:地球科学, 41(7): 936–944. | |
| 周元泽, 臧绍先. 2001. 牡丹江和海拉尔台下方地幔间断面结构及推论. 地球物理学报, 44(6): 761–773. DOI:10.3321/j.issn:0001-5733.2001.06.005 | |