 2017, Vol. 60


2. 北京大学地球与空间科学学院, 北京 100871
2. School of Earth and Space Sciences, Peking University, Beijing 100871, China
由印度板块及欧亚板块陆陆碰撞形成的青藏高原以其独特的地质学及地球物理学特征吸引了全世界科研工作者的目光:它不仅是探索陆-陆碰撞带大陆动力学过程和机制的天然实验室, 还是检验大陆漂移和板块构造理论的理想地区之一(Yin and Harrison, 2000).前人对于青藏高原的动力学机制提出了一些动力学模型以解释青藏高原的隆升(Argand, 1924; Dewey and Burke, 1973; Tapponnier et al., 2001; Clark and Royden, 2000).“缩短增厚说”认为印度板块与欧亚板块碰撞后, 印度板块向前推覆, 欧亚岩石圈产生水平方向上的缩短及垂向上的增厚(Dewey and Burke, 1973; England and McKenzie, 1982);“块体挤出模型”认为青藏高原地壳内物质沿着几条深大断裂从高原内部向外部挤出(Tapponnier et al., 1982, 2001);近些年来越来越多的证据支持“下地壳流模型”, 该假说认为高原中下地壳存在低黏性软弱层的管道流, 板块碰撞造成壳内物质流动挤出(Royden, 1996; Clark and Royden, 2000).
以蛇绿混杂岩为主要成分的构造缝合带将青藏高原分为多个次一级构造单元, 祁连地块位于青藏高原的东北缘, 是青藏高原向欧亚大陆内部扩展的前缘部位, 北临阿拉善块体、东接鄂尔多斯块体(图 1).以祁连块体为代表的青藏高原东北缘长期受印度与欧亚板块碰撞挤压作用, 晚新生代到现今的构造变形十分强烈, 块体内部发育大量NWW-SEE向的走滑断层(邓启东等, 2002).

|
图 1 研究区主要构造带及台站分布 蓝色三角代表流动台站位置;橘色圆环代表主要城市; 黑色细实线为省界;棕色实线为主要构造缝合带;NQS:北祁连缝合带;SQS:南祁连缝合带;AMS:阿尼玛卿缝合带. Fig. 1 Map showing the major tectonic belts and distribution of seismic stations The locations of temporary stations are showed by blue triangles. Orange circles represent main cities. Black line represent provincial boundaries and brown line indicate the main tectonic sutures. NQS: North Qilian Suture. SQS: South Qilian Suture. AMS: Animaqing Suture. |
讨论青藏高原东北缘地区的变形模式对于判断青藏高原隆升、扩展的动力学机制具有关键揭示作用.地震各向异性可以反映过去或现今地球内部演化过程的应变状态以及地球内部的变形特征, 是揭示岩石圈变形及壳幔相互作用的有效方法之一(Silver, 1996; Savage, 1999).
前人在青藏高原东北缘及临近地区利用XKS震相(含SKS、SKKS、PKS)开展了大量地震各向异性的研究工作, 这对具有超厚地壳的青藏高原具有较好的适用性(常利军等, 2008, 2015; 王琼等, 2013;Li et al., 2011b; Zhang et al., 2012; Ye et al., 2016), 得到相关研究区域地震各向异性特征, 重点讨论了青藏高原东北缘的壳幔变形机制.XKS分裂研究可以揭示台站下方岩石圈及软流圈的各向异性性质, 关于地壳的各向异性特征更多地还是用地表GPS观测数据代替或者利用浅地表构造进行约束, 在研究区地壳结构复杂的情况下, GPS测量与上地幔的观测进行直接比较不太合适, 因此增加对地壳特性的观测很有必要(高原等, 2010).相对XKS研究来说, 关于该地区地壳各向异性的研究开展的并不多, 有学者利用近场S波进行剪切波的分裂计算(张辉等, 2012;郭桂红等, 2015).由于近场S波路径较浅, 难以达到中下地壳, 得到的各向异性参数主要体现中上地壳的各向异性, 而无法得到下地壳的各向异性特征.区别于近场S直达波震相, 接收函数方法可以有效地压制其他干扰震相, 获取清晰、易于识别的Ps震相, 得到的各向异性参数反映的是整个地壳的各向异性特征(Wang et al., 2016; Shen et al., 2015).
本次研究将利用提取到的接收函数Moho转换波(Ps震相)进行剪切波分裂计算, 得到各向异性参数性质, 利用其他类型的观测资料(GPS、XKS)的综合对比、分析, 对研究区的变形模式及动力学过程进行详细的探讨.
2 数据与方法我们在这里选取中国地震科学探测台阵项目二期(ChinaArray Ⅱ)位于研究区域的81个流动地震台(图 1)2013年10月至2014年12月的地震观测数据.通过对地震目录进行事件的挑选, 选取震级5.5级以上、震中距30°~90°的地震事件.对地震数据去倾斜、去均值和滤波处理(0.05~2 Hz), 利用朱露培教授的时间域反褶积方法提取出接收函数(Zhu and Kanamori, 2000), 对于提取出的接收函数, 挑选其中质量好、Ps震相清晰的R、T分量作为备用.
Teanby等(2004)在Silver and Chan的方法(Silver and Chan, 1991)基础上, 利用网格搜索方法代替传统的手动选择分析窗口, 对多个各向异性参数对进行聚类分析, 挑选其中最佳的分裂参数作为各向异性参数.该方法不仅节省人力并且得到的结果稳定、可靠、误差小.此方法经过不断地完善与升级, 现今已应用于全球其他地区的各向异性研究中, 并且取得了很好的结果(Savage et al., 2010;Wessel, 2010; 张广成等, 2013;强正阳等, 2016).
针对挑选出来符合我们要求的接收函数对, 首先在Ps震相附近挑选一个合适的分析窗口, 这个窗口会根据参数文件中的预设值在窗口的前后进行固定步长的扩展, 产生新的搜索窗口, 假设我们设置初始窗口前递进N个窗口、初始后面递进M个窗口, 则程序将会产生N×M个窗口, 这样做的目的是为了能确保涵盖Ps震相完整的周期.对于每一个新的窗口都会通过分裂计算得到一个各向异性参数对, 并且利用各向异性参数对R、T分量接收函数质点轨迹进行校正, 质点的合运动轨迹在校正前是呈椭圆的, 校正后是直线.通过检验分析窗口校正后的两个波形分量的相似度及质点运动协方差矩阵第二特征值, 确定N×M个参数对中最合适的分裂结果.图 2是某个针对某个台站的某个事件的具体操作例子.

|
图 2 Ps震相各向异性分裂计算示例 (a)接收函数的径向分量和切向分量; (b)经过各向异性校正后的接收函数;(c)所有分析窗口的各向异性解, 其中平缓稳定且误差最小为最优解;(d)收敛于95%置信区间的稳定解;(e)快、慢波波形分析及分裂校正前后的质点运动轨迹;(f)位于置信区间内的每个窗口对应的各向异性参数.(c)、(d)、(f)中最优解都用十字标记. Fig. 2 A example of shear-wave splitting analysis (a) The radial and tangential components of receiver functions; (b) The receiver functions after correction; (c) All measurements of φ and δt in all windows, the best solution of all measurements is smooth and has least error; (d) The misfit contour surface, on which the thick line shows the range of solution with 95% confidence level; (e) Fast and slow components of the shear-wave before and after splitting and the particle motion; (f) The clusters and solutions from each window with 95% confidence level, all points should be concentrated. The best solution is pointed by cross in (c), (d) and (f). |
一个台有多个分裂结果, 我们根据以下几个标准筛选结果:(1) 经过旋转的接收函数切向分量上能量达到最小(图 2b);(2) 快、慢波的波形是相关的(图 2e);(3) 接收函数R、T分量合运动轨迹由分裂前的椭圆形态到旋转后的直线形态(图 2e);(4) 误差等值线的收敛程度(图 2d);(5) 稳定的计算结果(图 2c、2f).
3 剪切波分裂结果本次研究将前面所提到的所有81个台的分裂结果进行严格的人工筛选, 确保挑选的都是高质量的分裂结果.在所有的81个台中获得了其中58个台的共计130个事件结果, 23个台呈现空值或者出现多个无规律各向异性方向, 对于这样的结果都统一舍弃, 认为未获得可靠各向异性分裂参数.
58个台中有23个台挑选得到了多个高质量的分裂结果, 其中又有4个台的分裂结果显示两个明显差异的快波偏振方向, 对于这四个台进行两个快波偏振方向分别统计;19个台的多个分裂结果显示一个快波优势方向;对于多个分裂结果的台站, 将所有分裂结果均值作为台站下方地壳各向异性结果, 并计算多个结果的标准差作为误差列入表 1.
|
|
表 1 研究区台站下方Ps震相剪切波分裂结果 Table 1 The measurements of Ps splitting parameters for stations beneath study area |
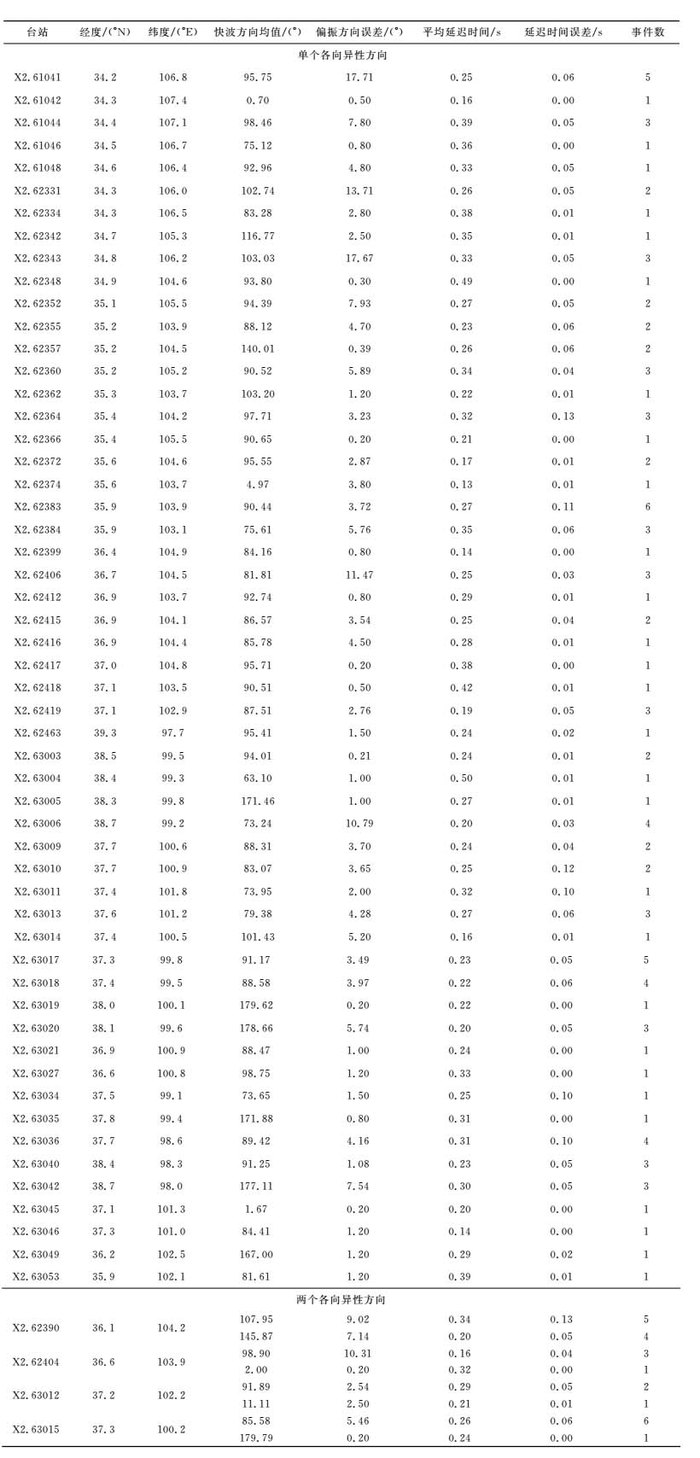
28个台只得到了单个良好的分裂结果, 将单个结果代表台站下方的地壳各向异性结果, 延迟时间的误差、快波方向的误差作为延迟时间、快波优势方向的误差列入表 1.
由于挑选结果的过程中对于质量要求很高, 因此保留下的结果相对于原始接收函数对的数目来说较少, 但是后方位角的覆盖还是令人满意的, 如图 3所示, 除了研究区北边的事件的后方位角覆盖较少, 在其他的几个方位都有事件的分布.

|
图 3 挑选的地震事件后方位角分布黑色十字代表事件分布, 星代表研究区. Fig. 3 The distributions of back azimuth for selected eventsBlack crosses show the events, and star represents the study area. |
将所有的结果按照10°间隔投影到等面积玫瑰图上(图 4), 将所有结果的快波偏振方向一起统计, 可得各向异性的平均快波偏振方向为N94°E±33°.从图 4中可以看到一个最主要的快波偏振方向是近E-W的方向, NWW向的事件数目略占优势;另外, 在近N-S的方向上还有一个小的集中趋势, 但事件的总数相对来说不多, 呈现一个N-S方向的偏振方向.统计结果显示平均值的误差较大, 将两部分的结果分别进行统计, N-S向各向异性方向的平均值为N177°E±8°, E-W向的各向异性平均结果是N93°E±15°.从各向异性的延迟时间上来看, 最大的结果为0.575 s, 最小的结果为0.115 s, 平均延迟时间为0.27±0.09 s.

|
图 4 所有事件的快剪切波偏振方向等面积投影玫瑰图 蓝色为投影的玫瑰图;红色直线代表两个平均快波偏振方向. Fig. 4 Equal-area project rose diagram of fast shear-wave polarization of all selected events Blue set diagram represents rose diagrams; and the red line show two average fast directions. |
本文计算得到的地壳各向异性的平均值为0.27 s, 地壳各向异性的优势方向在E-W、NEE-SWW与NWW-SEE向上都有分布.
前人利用XKS震相计算上地幔的各向异性(常利军等, 2008, 2015; Li et al., 2011b; Zhang et al., 2012; Ye et al., 2016), 在青藏高原东北缘的主体地区各向异性的主要优势方向为NW-SE、NWW-SEE和NNW-SSE向, 延迟时间为0.4~1.6 s, 在西宁附近地区的结果符合一个双层各向异性模型(Li et al., 2011b; Ye et al., 2016):下层的NW-SE向模型、上层的NEE-SWW向模型, 上层的优势方向与我们所得到地壳各向异性优势方向相近.
前人利用近场S波剪切波计算地壳各向异性(张辉等, 2012;郭桂红等, 2015), 各向异性的延迟时间尺度约为1~3 ms·km-1, 在这里我们假设地壳的平均厚度为50 km, 则地壳各向异性的延迟时间不会超过0.15 s, 符合一般上地壳各向异性的延迟时间尺度大小, 小于我们所得到的结果;从各向异性方向上来看, 地壳各向异性的优势方向呈现分区特征:祁连山—河西走廊构造区的快波偏振方向为NE方向, 与我们所得到的NEE-SWW方向相近, 甘东南地区的优势方向为NWW-SEE方向, 也与我们得到的结果具有一定的相似性.
Wang等(2016)利用接收函数计算地壳各向异性.从方向上来看, 12个台站呈现的主体优势方向为NW-SE、NWW-SEE方向, 其中有8个台站位于我们研究区的东南部, 与我们计算得到结果相近, 还有4个台并不在我们的台站覆盖范围内;从各向异性延迟时间上来看, 尺度范围为0.36~1.06 s, 远大于我们所得结果, 与前人利用XKS震相所得上地幔各向异性结果相近.
4.1 地壳各向异性的来源前人利用接收函数、人工地震测深等多种手段对青藏高原东北缘的地壳厚度有了一个大概的认识, 研究区的Moho深度变化起伏较大, 西北部地壳厚度较大, 东南部地壳厚度较小, 总体上介于40~55 km之间(李永华等, 2006; 刘启明等, 2014; Li et al., 2006; Zhang et al., 2013; Liu et al., 2014; Li et al., 2015).50 km厚度的地壳并不都是具有各向异性, 当剪切波的传播路径经过地壳中的各向异性层时才会发生剪切波分裂的现象.
一般认为, 上地壳的各向异性主要来自于浅部地表裂隙内的填充物质(Crampin, 1994), 并且尺度很小.我们计算得到的各向异性延迟时间为0.27 s, 相对于一般地壳内裂隙形成的各向异性偏大.根据一般简单计算各向异性层厚度的公式(Silver and Chen, 1988), 我们假设地壳内的各向异性层存在4%的各向异性度, 剪切波波速假设3.6 km·s-1, 0.27 s的延迟时间对应的各向异性层的厚度为24.3 km, 这个厚度的各向异性层已经无法用上地壳裂隙的各向异性解释, 因此, 该地区的中下地壳各向异性需要被充分地考虑.
随着深度的增加, 中下地壳开始发生塑性变形, 深部岩石的造物矿物的晶格重新定向排布, 导致壳内构造软弱层具有各向异性.地壳中的主要造岩矿物如白云母、黑云母、角闪石和长石在一定的温度压力条件下都可以具有很强的各向异性(杨彧等, 2010).很多研究指出, 在青藏高原东北缘部分地区的地壳是相对热而软的(Liu et al., 2006), 并且青藏高原下地壳流模型北部的下地壳流通道很可能经过这一地区(Clark and Royden, 2000), 这些都为该地区中下地壳各向异性提供了可能性.此外, 实验证实, 只要地壳深部岩石发生低度部分熔融, 并且熔体适度定向, 由熔体导致的各向异性强度便接近甚至超过由LPO产生的各向异性程度(杨彧等, 2010).
4.2 研究区东南部的耦合变形耦合变形也称简单连贯变形, 指的是地壳和岩石圈地幔在碰撞变形过程中是耦合在一起的, 预示板块强烈地耦合于地幔(王椿镛等, 2007).我们将前人XKS分裂结果、地壳各向异性结果、GPS速度场放到综合分析图上(图 5);可以看到, 位于研究区东南部的台站的各向异性结果较为一致, 基本都呈现近NWW-SEE的快波方向, 与本地区的XKS分裂的快波方向、欧亚参考系下的GPS速度场方向一致;与印度板块向欧亚板块俯冲的方向呈现一个近垂直的关系;该地区还发育大量NW-SE或NWW-SEE向的走滑断裂带(袁道阳等, 2006).从以上结果来看, 研究区东南部是一个耦合变形的过程, 前人通过SKS分裂结果和GPS速度场联合分析结果表明在青藏高原东缘地区可能是强壳幔耦合型的(王椿镛等, 2007;Wang et al., 2008), 这与我们利用地壳各向异性结果分析得到的结论相同.

|
图 5 研究区台站下方各向异性综合分析 每个台站的快波偏振方向及大小用粗短棒表示, 红色粗短棒表示只有一个快波优势方向, 紫色粗短棒表示两个快波优势方向;黑色圆点代表没有获得结果或者未见各向异性结果的台站;蓝色及紫色细短棒表示前人的XKS分裂结果(Wüstefeld et al., 2009;常利军等, 2015);绿色箭头为欧亚参考系下的GPS速度(Wang et al., 2001; Gan et al., 2007; Niu et al., 2005);黑色箭头指示欧亚大陆的绝对板块运动方向(Gripp and Gordon, 2002);黄色点线内为可见花岗岩出露地区;以黑色虚线区分结果, 将研究区各向异性分别讨论. Fig. 5 Comprehensive analysis diagram of anisotropy beneath seismic stations Average splitting measurements of Ps-wave are plotted with shot thick bars, together with measurements of XKS-wave which are plotted with blue and purple shot thin lines (Wüstefeld et al., 2009; Chang et al., 2015). Thin green arrows stand for GPS velocity vectors (Wang et al., 2001; Niu et al., 2005; Gan et al., 2006), and the big black arrow shows the APM of Eurasian plate (Gripp and Gordon, 2002). Granite can be found in the area surrounded by yellow dash line. The mechanism of crustal anisotropy can be separated in two part marked by black dash line. |
甘东南地区位于陆陆俯冲的前沿, 近青藏高原的东缘地区, 岩石圈地幔、地壳遭受到了NE-SW或NEE-SWW方向上的挤压作用, 岩石圈地幔和地壳在挤压应力的作用下发生连贯变形, 岩石圈和地壳中的各向异性矿物晶格对称轴倾向于分布在NW-SE或NWW-SEE向的面里, 造成如图 5中所展示的快波偏振方向.
4.3 研究区中、北部的解耦作用本文在研究区中部(图 5)呈现的快波优势方向为NEE-SWW或近E-W向, 与前人利用XKS震相得到的该地区双层各向异性模型的上层优势方向相近;同时与该地区欧亚参考系下的GPS速度场方向一致(图 6), 而该地区的XKS快波优势方向依然是NW-SE向.呈现的结果不具备垂直连贯变形的特征, 上地幔岩石圈和地壳具有一定的解耦作用.

|
图 6 地壳各向异性方向与GPS速度方向夹角分布 Fig. 6 Distribution of angles between fast polarization directions and GPS velocity vectors |
前人研究表明青藏高原东北缘的中下地壳有低速层存在(Li et al., 2006; Bao et al., 2013; Zhang et al., 2013; Ye et al., 2015), 青藏高原东北缘地区的区域主压应变优势方向为NE-SW向(朱爽和杨博, 2014), 地壳的最大主应力方向由中北部的NE-SW向转变为中南部的E-W向(Heidbach et al., 2010), 地壳各向异性的方向与该地区地壳最大主压应力方向一致性较强(图 7), 圈层的差异性可能是因为研究区中部的中下地壳层发生部分熔融, 在受地壳应力影响的地壳塑性管道流的作用下, 中下地壳矿物重新发生定向排列, 从而产生NEE-SWW向的各向异性方向.此外, 在青藏高原南部地区的XKS剪切波分裂也显示与我们类似的结果, 指示青藏高原中下地壳存在塑性地壳流动影响了地壳的各向异性方向, 从而产生了NE-SW向的快波方向(Gao and Liu, 2009);在青藏高原西部的XKS分裂及接收函数研究表明藏西地区具有双层地震各向异性, 其中上层各向异性主要来源于地壳流机制导致的矿物晶格定向排列(Wu et al., 2015).

|
图 7 地壳各向异性方向与地壳应力方向夹角分布 Fig. 7 Distribution of angles between fast polarization directions and crustal stress vectors |
另外, 在研究区的西北部出现数个比较特殊的快波优势方向结果.从青海省地质图可以看到, 从E100°往西的地区地表可见大规模的二长花岗岩出露, 这部分的异常各向异性方向很可能是由于花岗岩熔体内矿物在复杂地质条件下未按固定方向排列所致.
5 结论我们利用Ps震相的剪切波分裂计算方法, 得到了位于青藏高原东北缘的地壳各向异性结果, 揭示了该地区的地球动力学意义.结果表明, 研究区地壳各向异性主要来源于中下地壳, 地壳各向异性方向主体分布于E-W、NEE-SWW、NWW-SEE向.与前人所得到XKS分裂、GPS速度场的方向对比后的结果表明研究区的动力学机制具有差异性:甘肃东南部地区在青藏高原向欧亚大陆增生的过程中存在一个耦合的连贯变形过程, 表现为地壳各向异性、XKS各向异性、GPS速度场三者的近平行关系, 且该地区发育大量NW、NWW向的走滑断层;位于西宁—青海湖附近的中、北祁连山地区的地壳各向异性方向与GPS速度场方向一致, XKS方向与两者存在一定的夹角, 该地区在变形过程更为复杂:上地幔岩石圈依然是NW-SE向的各向异性, 但在青藏高原下地壳塑性管道流的影响下, 中下地壳组份发生NEE-SWW向的定向排列, 产生剪切波快波偏振方向.部分地区出现的特殊各向异性方向可能是由于地壳组分熔体未定向排列所致.
致谢感谢所有参与中国地震科学探测台阵(ChinaArray)项目的规划者和实施者.感谢中国地震局地球物理研究所科学探测台阵数据中心为本研究提供的数据支持.最后, 感谢李永华研究员对本文提出建设性的意见.感谢两位匿名审稿人对本文所提出的意见.文章大部分图件使用GMT软件绘制(Wessel and Smith, 1998).
| Argand E. 1922. La tectonique de l'Asie. Conférence faite á Bruxelles, le 10 août 1922.//Congrès Géologique International (XIIIe session)-Belgique. 171-372. | |
| Bao X W, Song X D, Xu M J, et al. 2013. Crust and upper mantle structure of the North China Craton and the NE Tibetan Plateau and its tectonic implications. Earth Planet. Sci. Lett., 369-370: 129-137. DOI:10.1016/j.epsl.2013.03.015 | |
| Chang L J, Wang C Y, Ding Z F, et al. 2008. Seismic anisotropy of upper mantle in the northeastern margin of the Tibetan Plateau. Chinese J. Geophys., 51(2): 431-438. | |
| Chang L J, Ding Z F, Wang C Y. 2015. Upper mantle anisotropy beneath the southern segment of North-South tectonic belt, China. Chinese J. Geophys., 58(11): 4052-4067. DOI:10.6038/cjg20151114 | |
| Clark M K, Royden L H. 2000. Topographic ooze: Building the eastern margin of Tibet by lower crustal flow. Geology, 28(8): 703-706. DOI:10.1130/0091-7613(2000)28<703:TOBTEM>2.0.CO;2 | |
| Crampin S. 1994. The fracture criticality of crustal rocks. Geophys. J. Int., 118(2): 428-438. DOI:10.1111/j.1365-246X.1994.tb03974.x | |
| Deng Q D, Zhang P Z, Ran Y K, et al. 2003. Basic characteristics of active tectonics of China. Sci. China (Ser. D), 46(4): 356-372. | |
| Dewey J F, Burke K C A. 1973. Tibetan, Variscan, and Precambrian basement reactivation: products of continental collision. J. Geol., 81(6): 683-692. DOI:10.1086/627920 | |
| England P, McKenzie D. 1982. A thin viscous sheet model for continental deformation. Geophys. J. Int., 70(2): 295-321. DOI:10.1111/j.1365-246X.1982.tb04969.x | |
| Gan W J, Zhang P Z, Shen Z K, et al. 2007. Present-day crustal motion within the Tibetan Plateau inferred from GPS measurements. J. Geophys. Res., 112(B8): B08416. | |
| Gao S S, Liu K H. 2009. Significant seismic anisotropy beneath the southern Lhasa Terrane, Tibetan Plateau. Geochem., Geophys., Geosyst., 10(2): Q02008. | |
| Gao Y, Wu J, Yi G X, et al. 2010. Crust-mantle coupling in North China: Preliminary analysis from seismic anisotropy. Chinese Sci. Bull., 55(31): 3599-3605. DOI:10.1007/s11434-010-4135-y | |
| Gripp A E, Gordon R G. 2002. Young tracks of hotspots and current plate velocities. Geophys. J. Int., 150(2): 321-361. DOI:10.1046/j.1365-246X.2002.01627.x | |
| Guo G H, Zhang Z, Cheng J W, et al. 2015. Seismic anisotropy in the crust in northeast margin of Tibetan Plateau and tectonic implication. Chinese J. Geophys., 58(11): 4092-4105. DOI:10.6038/cjg20151117 | |
| Heidbach O, Tingay M, Barth A, et al. 2010. Global crustal stress pattern based on the World Stress Map database release 2008. Tectonophysics, 482(1-4): 3-15. DOI:10.1016/j.tecto.2009.07.023 | |
| Li J, Wang X J, Niu F L. 2011a. Seismic anisotropy and implications for mantle deformation beneath the NE margin of the Tibet plateau and Ordos plateau. Phys. Earth Planet. Int., 189(3-4): 157-170. DOI:10.1016/j.pepi.2011.08.009 | |
| Li S L, Mooney W D, Fan J C. 2006. Crustal structure of mainland China from deep seismic sounding data. Tectonophysics, 420(1-2): 239-252. DOI:10.1016/j.tecto.2006.01.026 | |
| Li X F, Santosh M, Cheng S H, et al. 2015. Crustal structure and composition beneath the northeastern Tibetan plateau from receiver function analysis. Phys. Earth Planet. Int., 249: 51-58. DOI:10.1016/j.pepi.2015.10.001 | |
| Li Y H, Wu Q J, An Z H, et al. 2006. The Poisson ratio and crustal structure across the NE Tibetan Plateau determined from receiver functions. Chinese J. Geophys., 49(5): 1359-1368. | |
| Li Y H, Wu Q J, Zhang F X, et al. 2011b. Seismic anisotropy of the Northeastern Tibetan Plateau from shear wave splitting analysis. Earth Planet. Sci. Lett., 304(1-2): 147-157. DOI:10.1016/j.epsl.2011.01.026 | |
| Liu M, Mooney W D, Li S, et al. 2006. Crustal structure of the northeastern margin of the Tibetan plateau from the Songpan-Ganzi terrane to the Ordos basin. Tectonophysics, 420(1-2): 253-266. DOI:10.1016/j.tecto.2006.01.025 | |
| Liu Q M, Zhao J M, Lu F, et al. 2014. Crustal structure of northeastern margin of the Tibetan Plateau by receiver function inversion. Sci. China: Earth Sci., 57(4): 741-750. DOI:10.1007/s11430-013-4772-5 | |
| Niu Z J, Wang M, Sun H R, et al. 2005. Contemporary velocity field of crustal movement of Chinese mainland from Global Positioning system measurements. Chinese Science Bulletin, 50(9): 939-941. DOI:10.1007/BF02897392 | |
| Qiang Z Y, Wu Q J, Li Y H, et al. 2016. Crustal anisotropy beneath central-south Mongolia and its dynamic implications. Chinese J. Geophys., 59(5): 1616-1628. DOI:10.6038/cjg20160507 | |
| Royden L. 1996. Coupling and decoupling of crust and mantle in convergent orogens: Implications for strain partitioning in the crust. J. Geophys. Res. Solid Earth, 101(B8): 17679-17705. DOI:10.1029/96JB00951 | |
| Savage M K. 1999. Seismic anisotropy and mantle deformation: What have we learned from shear wave splitting?. Rev. Geophy., 37(1): 65-106. DOI:10.1029/98RG02075 | |
| Savage M K, Wessel A, Teanby N A, et al. 2010. Automatic measurement of shear wave splitting and applications to time varying anisotropy at Mount Ruapehu volcano, New Zealand. J. Geophys. Res. Atmos., 115(B12): B123211-70. | |
| Shen X Z, Yuan X H, Ren J S. 2015. Anisotropic low-velocity lower crust beneath the northeastern margin of Tibetan Plateau: Evidence for crustal channel flow. Geochem., Geophy., Geosyst, 16(12): 4223-4236. DOI:10.1002/2015GC005952 | |
| Silver P G, Chan W W. 1988. Implications for continental structure and evolution from seismic anisotropy. Nature, 335(6185): 34-39. DOI:10.1038/335034a0 | |
| Silver P G, Chan W W. 1991. Shear wave splitting and subcontinental mantle deformation. J. Geophys. Res.: Solid Earth, 96(B10): 16429-16454. DOI:10.1029/91JB00899 | |
| Silver P G. 1996. Seismic anisotropy beneath the continents: Probing the depths of geology. Ann. Rev. Earth Planet. Sci., 24(1): 385-432. DOI:10.1146/annurev.earth.24.1.385 | |
| Tapponnier P, Peltzer G, Le Dain A Y, et al. 1982. Propagating extrusion tectonics in Asia: New insights from simple experiments with plasticine. Geology, 10(12): 611-616. DOI:10.1130/0091-7613(1982)10<611:PETIAN>2.0.CO;2 | |
| Tapponnier P, Xu Z Q, Roger F, et al. 2001. Oblique stepwise rise and growth of the Tibet plateau. Science, 294(5547): 1671-1677. DOI:10.1126/science.105978 | |
| Teanby N A, Kendall J M, Baan M V D. 2004. Automation of shear-wave splitting measurements using cluster analysis. Bull. Seismol. Soc. Am., 94(2): 453-463. DOI:10.1785/0120030123 | |
| Wüstefeld A, Bokelmann G, Barruol G, et al. 2009. Identifying global seismic anisotropy patterns by correlating shear-wave splitting and surface-wave data. Phys. Earth Planet. Int., 176(3-4): 198-212. DOI:10.1016/j.pepi.2009.05.006 | |
| Wang C Y, Chang L J, Lü Z Y, et al. 2007. Seismic anisotropy of upper mantle in eastern Tibetan Plateau and related crust-mantle coupling pattern. Science in China Series D: Earth Sciences, 50(8): 1150-1160. DOI:10.1007/s11430-007-0053-5 | |
| Wang C Y, Flesch L M, Silver P G, et al. 2008. Evidence for mechanically coupled lithosphere in central Asia and resulting implications. Geology, 36(5): 363-366. DOI:10.1130/G24450A.1 | |
| Wang Q, Zhang P Z, Freymueller J T, et al. 2001. Present-day crustal deformation in China constrained by global positioning system measurements. Science, 294(5542): 574-577. DOI:10.1126/science.1063647 | |
| Wang Q, Gao Y, Shi Y T, et al. 2013. Seismic anisotropy in the uppermost mantle beneath the northeastern margin of Qinghai-Tibet plateau: evidence from shear wave splitting of SKS, PKS and SKKS. Chinese J. Geophys., 56(3): 892-905. DOI:10.6038/cjg20130318 | |
| Wang Q, Niu F L, Gao Y, et al. 2016. Crustal structure and deformation beneath the NE margin of the Tibetan plateau constrained by teleseismic receiver function data. Geophys. J. Int., 204(1): 167-179. | |
| Wessel A. 2010. Automatic shear wave splitting measurements at Mt. Ruapehu Volcano, New Zealand[Master thesis]. Victoria University of Wellington. | |
| Wessel P, Smith W H F. 1998. New, improved version of Generic Mapping Tools released. EOS, Trans. Amer. Geophys. Union, 79(47): 579. DOI:10.1029/98EO00426 | |
| Wu J, Zhang Z J, Kong F S, et al. 2015. Complex seismic anisotropy beneath western Tibet and its geodynamic implications. Earth Planet. Sci. Lett., 413: 167-175. DOI:10.1016/j.epsl.2015.01.002 | |
| Yang Y, Chen J Y, Yang X S, et al. 2010. Does alignment of melt enhance seismic anisotropy beneath Tibet?. Seismology and Geology, 32(1): 59-69. | |
| Ye Z, Gao R, Li Q S, et al. 2015. Seismic evidence for the North China plate underthrusting beneath northeastern Tibet and its implications for plateau growth. Earth Planet. Sci. Lett., 426: 109-117. DOI:10.1016/j.epsl.2015.06.024 | |
| Ye Z, Li Q S, Gao R, et al. 2016. Anisotropic regime across northeastern Tibet and its geodynamic implications. Tectonophysics, 671: 1-8. DOI:10.1016/j.tecto.2016.01.011 | |
| Yin A, Harrison T M. 2000. Geologic evolution of the Himalayan-Tibetan orogen. Ann. Rev. Earth Planet. Sci., 28(1): 211-280. DOI:10.1146/annurev.earth.28.1.211 | |
| Yuan D Y, He W G, Liu X F, et al. 2006. The characteristics of seismogenic structure of middle-strong earthquakes in recent 10 years, Gansu Province. Northwestern Seismological Journal, 28(3): 235-241. | |
| Zhang G C, Wu Q J, Li Y H, et al. 2013. An investigation on crustal anisotropy of Northeast China using Moho Ps converted phase. Acta Seismologica Sinica, 35(4): 485-497. | |
| Zhang H, Gao Y, Shi Y T, et al. 2012. Tectonic stress analysis based on the crustal seismic anisotropy in the northeastern margin of Tibetan plateau. Chinese J. Geophys., 55(1): 95-104. DOI:10.6038/j.issn.0001-5733.2012.01.009 | |
| Zhang H S, Teng J W, Tian X B, et al. 2012. Lithospheric thickness and upper-mantle deformation beneath the NE Tibetan Plateau inferred from S receiver functions and SKS splitting measurements. Geophys. J. Int., 191(3): 1285-1294. | |
| Zhang Z J, Bai Z M, Klemperer S L, et al. 2013. Crustal structure across northeastern Tibet from wide-angle seismic profiling: Constraints on the Caledonian Qilian orogeny and its reactivation. Tectonophysics, 606: 140-159. DOI:10.1016/j.tecto.2013.02.040 | |
| Zhu L, Kanamori H. 2000. Moho depth variation in southern California from teleseismic receiver functions. Journal of Geophysical Research: Solid Earth, 105(B2): 2969-2980. DOI:10.1029/1999JB900322 | |
| Zhu S, Yang B. 2014. Analysis of recent horizontal deformation in the northeastern margin of the Qinghai-Tibetan plateau. Journal of Geodesy and Geodynamics, 34(3): 81-85. | |
| 常利军, 王椿镛, 丁志峰, 等. 2008. 青藏高原东北缘上地幔各向异性研究. 地球物理学报, 51(2): 431–438. | |
| 常利军, 丁志峰, 王椿镛. 2015. 南北构造带南段上地幔各向异性特征. 地球物理学报, 58(11): 4052–4067. DOI:10.6038/cjg20151114 | |
| 邓起东, 张培震, 冉勇康, 等. 2002. 中国活动构造基本特征. 中国科学:地球科学, 32(12): 1020–1030. | |
| 高原, 吴晶, 易桂喜, 等. 2010. 从壳幔地震各向异性初探华北地区壳幔耦合关系. 科学通报, 55(29): 2837–2843. | |
| 郭桂红, 张智, 程建武, 等. 2015. 青藏高原东北缘地壳各向异性的构造含义. 地球物理学报, 58(11): 4092–4105. DOI:10.6038/cjg20151117 | |
| 李永华, 吴庆举, 安张辉, 等. 2006. 青藏高原东北缘地壳S波速度结构与泊松比及其意义. 地球物理学报, 49(5): 1359–1368. | |
| 强正阳, 吴庆举, 李永华, 等. 2016. 蒙古中南部地区地壳各向异性及其动力学意义. 地球物理学报, 59(5): 1616–1628. DOI:10.6038/cjg20160507 | |
| 王椿镛, 常利军, 吕智勇, 等. 2007. 青藏高原东部上地幔各向异性及相关的壳幔耦合型式. 中国科学:地球科学, 37(4): 495–503. | |
| 王琼, 高原, 石玉涛, 等. 2013. 青藏高原东北缘上地幔地震各向异性:来自SKS、PKS和SKKS震相分裂的证据. 地球物理学报, 56(3): 892–905. DOI:10.6038/cjg20130318 | |
| 杨彧, 陈建业, 杨晓松, 等. 2010. 部分熔融强化了青藏高原地壳的各向异性?. 地震地质, 32(1): 59–69. | |
| 袁道阳, 何文贵, 刘小凤, 等. 2006. 10余年来甘肃省中强地震的发震构造特征. 西北地震学报, 28(3): 235–241. | |
| 张广成, 吴庆举, 李永华, 等. 2013. 利用莫霍面Ps震相研究中国东北地区地壳各向异性. 地震学报, 35(4): 485–497. | |
| 张辉, 高原, 石玉涛, 等. 2012. 基于地壳介质各向异性分析青藏高原东北缘构造应力特征. 地球物理学报, 55(1): 95–104. DOI:10.6038/j.issn.0001-5733.2012.01.009 | |
| 朱爽, 杨博. 2014. 青藏高原东北缘近期水平形变场分析. 大地测量与地球动力学, 34(3): 81–85. | |