 2017, Vol. 60


2. 中国地震局地震预测研究所(地震预测重点研究室), 北京 100036
2. Key Laboratory of Earthquake Prediction, Institute of Earthquake Science, China Earthquake Administration, Beijing 100036, China
约50 Ma年前,印度板块与欧亚板块的碰撞造就了青藏高原的隆起,碰撞以来两个板块间的构造缩短量达到2600 km左右,地壳变形严重(Tapponnier et al., 2001),是我国现代构造活动和地震活动最强烈的地区.青藏块体在向北东方向运动时受到坚硬的鄂尔多斯块体和阿拉善块体的刚性阻力,两大板块碰撞作用由近南北方向向北东、东方向转换,东流物质在青藏高原东北缘汇聚.由于其特殊的地理位置和地质构造作用,青藏高原东北缘成为了中国大陆东西及南北构造结合部位和重要的构造转换区域(张国伟等, 2004;嘉世旭和张先康, 2008),包含了南北地震带北端的大部分区域,是研究青藏高原地壳构造运动和块体之间相互作用的理想区域.
对于青藏高原东北缘地壳和上地幔结构,国内外已有众多人工地震测深结果(周民都等, 1997;李松林等, 2002;王有学等, 2005;滕吉文等, 2008;Liu et al., 2006; 嘉世旭和张先康, 2008; 张先康等, 2008; 刘明军等, 2008; Zhang et al., 2013; 王海燕等, 2014;Wang et al., 2013, 2014; 郭文斌等, 2016; 林吉焱和段永红, 2016)和远震接收函数研究(郭飚等, 2004; 陈九辉等, 2005; 李永华等, 2006; Shen et al., 2011; Pan and Niu, 2011; Zhang et al., 2012; 刘启民等, 2014; 张洪双等, 2015; Shen et al., 2015; Wang et al., 2016, 2017),也有少量近震走时成像结果(丁志峰等, 1999; 周民都等, 2006; Liang and Song, 2006; Xu and Song, 2010)、噪声和面波成像结果(Zheng et al., 2010a; Li et al., 2014; 余大新等, 2014)以及波形反演结果(李少华等, 2012).这些研究揭示了该地区地壳上地幔结构的基本特征,发现了地壳增厚和下地壳的低速异常,然而对于青藏高原东北缘相关的深部构造模型尚未有一致的认识,可能原因之一是成像分辨率的精度不足以识别在地壳和上地幔深处的细节(王椿镛等, 2016).采用更高分辨率的成像方法和利用更密集的地震台阵观测有助于我们进一步了解青藏高原东北缘的地壳结构特征和深部构造信息,进而更清晰地认识青藏高原东北缘地壳加厚方式及其生长变形机制.
双差层析成像方法(Zhang and Thurber, 2003, 2006)结合双差定位方法(Waldhauser and Ellsworth, 2000)和传统走时层析成像方法,通过相近地震的走时差反演震源附近的速度结构和震源位置,利用地震到台站之间的绝对走时反演震源区外的速度结构,因而能获取震源区更精细的速度结构和更准确的地震定位结果(Zhang and Thurber, 2003, 2006; Pesicek et al., 2010; 李海鸥等, 2011; Allam and Ben-Zion, 2012; 王长在等, 2013; 邓文泽等, 2014; Dixit et al., 2014; 王小娜等, 2015).以上研究主要基于双差成像方法研究小尺度断裂带结构特征,本文尝试利用区域尺度的双差成像方法研究青藏高原东北缘及其邻区的地壳精细结构特征,试图为青藏高原东北缘深部相关的动力学模型提供更多约束.
2 数据与方法 2.1 数据本文收集了由中国地震台网中心提供的青藏高原东北缘及其邻区(33°N —42°N,96°E —108°E)2009年1月至2017年2月的初至Pg、Sg波震相报告资料(图 1).原始数据共计39971个地震事件,其中最小震级为0,最大震级为6.4,地震活动性如图 2所示,4级以上地震共计128次, 重定位前4级以上地震震源深度分布集中在5~30 km.初始震相报告中地震事件走时残差(震相报告中单个地震事件所有观测震相的理论到时和实际到时的残差,其大小反映了震源空间参数解的精确度)均方根、Pg和Sg震相走时残差分布如图 3所示.为了获取更精确的震源位置和成像结果,本文采用区域尺度双差层析成像方法联合反演地震震源和三维速度结构.反演过程中依据初始数据中Pg和Sg震相走时残差的分布,将Pg波权重设为1,Sg波权重设为0.5.剔除初始数据中存在明显异常(虚线以外)的走时信息后,通过和达法拟合Sg和Pg走时数据,发现研究区域VP/VS平均值约为1.70(图 4),对应的平均泊松比值为0.235,低于泊松介质的平均值和大陆地壳的平均值.大陆地壳主要由酸性岩(v≤0.26)、中性岩(0.26<v≤0.28) 和铁镁质基性岩(0.28<v≤0.30)3个组分按比例复合而成,泊松比由低到高代表岩石从长英质到镁铁质的变化(Christensen, 1996; 姚志祥等, 2014),较低的波速比表明研究区域地壳可能为整体呈酸性的长英质地壳.依据初始数据显示的研究区地震分布特点和射线覆盖路径,选取如图 5所示节点进行双差层析成像反演,具体参数设定如下:事件对与台站的最大距离为1000 km,事件对之间的最小间距和最大间距分别为0.1 km和50 km,每个事件的最大邻居数为50,每个事件对所需要的震相数的最小值和最大值分别为8和50.满足条件的地震事件共计29491个,震相数据498056条.

|
图 1 青藏高原东北缘地形和构造背景 主要块体包括柴达木地块、祁连地块、河西走廊、阿拉善地块、鄂尔多斯地块.主要断裂有F1:海原断裂, F2:香山北麓断裂, F3:龙首山断裂, F4:祁连山北缘断裂, F5:马衔山断裂.子图中紫色矩形框为青藏高原东北缘区域(数据收集区域), 主图中黑色矩形框代表主要研究区域. Fig. 1 Topography and tectonic setting of northeastern Tibetan plateau Main blocks are Qaidam basin, Qilian orogeny, Hexi corridor, Alxa block and Ordos block. Major faults are F1: Haiyuan fault, F2: Xiangshanbeilu fault, F3: Longshoushan fault, F4: North Qilian fault, F5: Maxianshan fault. Purple and black rectangles represent northeastern Tibetan plateau region (data collection area) and study area, respectively. |

|
图 2 研究区地震随时间的分布和4级以上地震的深度分布 黄色柱状图代表地震个数,蓝色圆圈代表 4级以上地震. Fig. 2 Temporal distribution of earthquakes and depths of M>4 earthquakes Event number represented by yellow bar and blue circles show the depth of events which magnitude are above 4. |

|
图 3 原始数据中地震事件走时残差均方根(a)、Pg走时残差(b)、Sg走时残差(c)分布 Fig. 3 Root Mean Square of travel-time residual of events in catalog data (a), residual of Pg (b) and Sg (c) phase |

|
图 4 P波(a)、S波(b)时距曲线以及通过和达法拟合得到的波速比(c) 剔除虚线以外的震相数据以保证数据质量. Fig. 4 Time-distance curve of P (a) and S (b) wave as well as VP/VS (c) calculated by Wadachi Method Data outside the dashed line were removed to ensure the data quality. |

|
图 5 重定位前研究区P波(左)、S波(右)射线路径(深度投影、水平投影)和反演节点 红色圆点、黄色加号、蓝色三角、紫色实线、红色实线和黑色实线分别代表地震事件、反演节点、台站、块体边界、断层和射线路径. Fig. 5 Ray path of P (left) and S (right) wave and its vertical projection as well as horizontal projection and grid nodes before relocation Events, inversion nodes, stations, block boundaries, faults and ray paths are represented by red circle, yellow plus sign, blue triangle, purple solid line, red solid line and black solid line, respectively. |
双差层析成像(TomoDD)方法由双差定位方法(HypoDD)发展而来,是双差定位方法的推广应用.在双差定位过程中,假定相邻事件到同一台站具有相似的路径,但是当相邻事件之间距离大于速度变化的尺度时,由速度不均匀性引起的路径差异会随震源位置明显变化(王伟平,2016),尽管Waldhauser和Ellsworth(2000)通过引入距离权重因子减小路径偏差造成的定位误差,双差定位结果仍会受到影响.而双差层析成像方法引入绝对到时数据,考虑介质速度结构的空间变化,减小了双差定位中由于假设台站到事件对之间速度恒定引起的误差,对地震对的距离没有要求,因此得到的定位结果更加精确(王长在等, 2013).在实际反演过程中,TomoDD先给绝对到时数据较大权重来反演整体的速度结构,再给地震目录相对走时差数据较大权重,来更好地约束震源区结构.对于小尺度问题,双差成像方法假设平坦地球模型应用伪弯曲射线追踪算法寻找事件和台站之间的地震射线,而对于较大尺度问题,双差成像方法利用有限差分算法并考虑地球曲率,网格参数化方法既可以是基本的规则矩形剖分,也可以是自适应网格剖分(Zhang and Thurber, 2006).本文利用区域尺度双差层析成像方法通过“节点法”进行模型参数化, 采用球状介质中的“伪弯曲法”进行射线追踪和正演计算走时数据, 反演过程中借助阻尼最小二乘法, 使由双差走时数据残差和绝对走时数据残差(其中既包括权重为1.0的Pg波走时残差,也包括权重为0.5的Sg波走时残差,为了方便起见,后文简称总走时残差)的2范数系统构成的目标函数最小化, 同时反演VP和VS速度结构,从而获取最优的震源位置和三维速度结构.
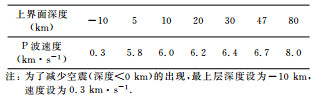
2.3 初始模型选取层析成像反演结果往往依赖初始模型,因此选择合适的初始模型尤为重要.依据地震的空间分布和射线路径的分布特征本文分别选取Zhang等(2013)在青藏高原东北缘利用人工震源得到的宽角反射剖面资料结果、Xu和Song(2010)联合反演青藏高原东缘P波速度和莫霍面深度所采用的初始速度模型、李少华等(2012)利用波形反演获取的甘肃东南部地壳速度结构作为初始模型进行反演效果测试.结果显示初始模型为人工震源宽角反射剖面得到的速度模型(Zhang et al., 2013)时,总走时残差(均方根、均值、方差)最小,震源位置空间误差均值最小,因此本文将其作为初始模型,具体参数如表 1所示, 纵横波波速比初始值设为1.70(图 4).
|
|
表 1 双差成像所采用的初始速度模型 Table 1 Initial velocity model used in TomoDD |
对于阻尼最小二乘问题,双差层析成像方法采用LSQR(least square QR factorization)算法, 以总走时残差2范数为目标函数进行迭代求解(Zhang and Thurber, 2003).阻尼因子及平滑权重的大小控制反演结果的稳定性,因此在反演之前必须对不同的平滑权重和阻尼参数进行权衡分析(Eberhart-Phillips, 1986;王小娜等, 2015;Ma et al., 2016).其中TomoDD中光滑因子是用来约束慢度的变化量,因此选择慢度变化量的2范数和总走时残差的2范数进行光滑因子的权衡分析(图 6),而阻尼参数同时约束了地震位置和慢度的变化量,故选取地震位置和慢度变化量的2范数和总走时残差的2范数进行阻尼参数的权衡分析(图 7).通过权衡分析结果,利用L曲线法(Hansen, 1992;Hansen and O′Leary, 1993)选择最佳的光滑因子40和阻尼参数500.

|
图 6 利用L曲线法选择最佳的平滑因子 横坐标代表慢度变化量归一化范数,纵坐标代表总走时残差的归一化范数. Fig. 6 Best parameter of smooth was selected by L curve method The horizontal axis represents the normalized norm of slowness variation, the vertical axis represents the normalized norm of overall travel-time residual. |

|
图 7 利用L曲线法选择最佳的阻尼参数 横坐标代表地震位置和慢度变化量归一化范数,纵坐标代表总走时残差的归一化范数. Fig. 7 Best parameter of damp was selected by L curve method The horizontal axis represents the normalized norm of slowness and earthquake location variations, the vertical axis represents the normalized norm of overall travel-time residual. |
LSQR算法中解收敛要求的迭代次数很大程度上取决于问题的尺度(Paige and Saunders, 1982).由于联合反演时,速度结构的收敛速度快于震源位置的收敛速度,因此在每次联合反演之后需增加一次单独定位反演.为了获取实际反演需要的迭代次数,本文测试了迭代次数与总走时残差均方根、总走时残差方差变化的关系,其中迭代的截断值设为7倍标准差(下次迭代过程中去除残差大于7倍标准差的走时数据),测试结果如图 8所示,迭代次数为10次时,总走时残差不再明显下降.

|
图 8 总走时残差的方差、均方根与迭代次数的关系 五角星、圆点和星号分别代表初始数据残差、联合反演残差和单独反演地震位置残差. Fig. 8 Overall travel-time residual varies with iteration Residual of initial data, joint inversion and single inversion of location represented by pentagram, dots and asterisks, respectively. |
在实际数据反演之前,采用棋盘格测试(Spakman et al., 1993)的方法对解的质量进行分析.棋盘格测试方法能够检验反演方法在实际数据和网格模型下整个研究区内的反演分辨率,是地震层析成像研究中评价反演结果质量的常用手段.其具体步骤如下:首先利用理论棋盘模型计算理论走时来模拟实际观测数据,随后通过模拟数据反演模型参数,最后评价反演结果对理论模型的恢复程度.本文检测板测试中以1°×1°网格和5%正负异常相间的棋盘格速度模型作为理论模型正演计算理论走时,利用理论走时数据和实际反演的初始速度模型联合反演速度结构和震源位置.棋盘测试结果如图 9所示,红色矩形框区域(即图 1中黑色矩形框)各深度范围棋盘速度模型均能较完整恢复.为了获取可靠的地壳波速结构,只选择红色矩形框内的成像结果进行解释.

|
图 9 不同深度剖面棋盘格检测板测试结果 黑色小点和白色三角分别代表地震和台站位置,仅讨论红色矩形框内的实际数据反演结果. Fig. 9 Checkerboard test results of each depth black dots represent events location and white triangle represent station location, real data inversion results discussed only in the red rectangle area. |
与双差定位原理类似,双差层析成像过程中利用地震事件对的相对走时差数据来提高震源相对位置的精度.重新定位后,满足双差成像条件的地震空间分布如图 10所示.重定位前后地震深度分布变化明显,定位前地震深度集中分布在5~10 km,而定位后地震均匀分布在5~25 km深度,与杨智娴等(2003)利用双差定位方法研究我国中西部地区地震深度分布的结果一致.重定位后总走时残差均方根由0.8506降低为0.4590(图 8b),通过对理论到时和观测到时残差的理论估计,震源位置的估算误差如图 11所示.

|
图 10 双差成像定位前后地震的空间分布变化(上)与深度变化(下) Fig. 10 Spatial (above) and depth (below) variations before and after TomoDD relocation |

|
图 11 双差成像重定位后定位误差分布 Fig. 11 Relocation error |
因原始数据中震相的走时残差不同,实际反演过程中分别赋予Pg和Sg震相权重为1和0.5来同时反演P、S波速度,并利用VP/VS计算研究区介质的泊松比值,不同深度剖面P波、S波速度结构和泊松比的分布如图 12所示.人工地震测深剖面研究表明青藏高原东北缘地壳内部构造在不同的地质构造块体差异明显(张先康等,2008),为了更清晰地认识青藏高原与周围块体之间的相互作用,本文将研究区划分为5个不同构造单元(鄂尔多斯地块西部、阿拉善地块、河西走廊、祁连地块、海原断裂弧形构造区)分别进行讨论.

|
图 12 不同深度剖面VP(左)、VS(中)和泊松比(右)分布 蓝色立方体代表台站(Z=0 km), 黑色小点代表地震(Z=5~30 km). Fig. 12 VP (left), VS (middle) and Poisson ratio (right) distribution at each depth profile Blue cubes on Z=0 km profile represent station and black dots on Z=5~30 km profiles represent events. |
鄂尔多斯地块西部区域地震主要集中发生在地块西南边界区域, 鄂尔多斯盆地基底深度约为5~6 km(林吉焱和段永红, 2016),地壳厚度平均约为42 km(Pan and Niu, 2011).双差层析成像结果显示沉积层(Z=5 km)整体呈现低P、S波速度,反映了沉积盆地的特征,表明结晶基底较深,这与人工地震勘探的结果(王帅军等, 2014)一致,可能原因之一是鄂尔多斯盆地西南缘奥陶系海相地层沉积厚度大(张月巧等,2013),而较低的介质泊松比值则表明该沉积盆地相对较为完整.上地壳(10 km)结构则呈现横向变化特征,中部区域介质的VP和泊松比明显高于南北两侧.中下地壳(Z=20~30 km)的结构分布与浅层不尽相同,表现出高地震波速度和相对较高的泊松比值均匀分布,整体速度随深度增加而增加,体现壳内介质未被破坏的稳定古大陆地壳结构.滕吉文等(2008)曾提出鄂尔多斯地壳双层结构,上下之间存在明显的折射界面,上层速度低,纵向变化梯度大,下层速度高,噪声成像同样发现了类似结果(Zheng et al., 2010a),结合以上研究结果,笔者认为鄂尔多斯地壳如果存在双层结构,该折射界面可能位于10~20 km深度之间.
3.2.2 阿拉善地块阿拉善地块内部地震活动较弱,地震主要发生在与河西走廊交汇的南边界上,沉积盖层厚度约为4~5 km(郭文斌等,2016),地壳厚度平均约为47 km (姚志祥等,2014).沉积层(Z=5 km)结构与鄂尔多斯地块相似,均呈现明显的低VP和低VS分布,与该区域较厚的沉积盖层相对应,块体边界泊松比值高于块体内部的分布特征可能与相邻地块的相互作用有关.地壳整体(Z=10~30 km)结构横向变化明显,地震波速呈现西高东低的分布特征.Xu和Song(2010)通过联合反演地壳P波速度、Pn波速度和Moho面深度也发现阿拉善地块东侧区域P波速度较低的特征.研究发现刚性的阿拉善块体受到西南部祁连造山带向北东推挤应力的作用在新生代发生了构造抬升,抬升主要发生在块体的周缘造山带内,并伴随山前盆地的沉积凹陷作用(高洪雷等, 2013).阿拉善地块地壳结构的横向变化特征反映该地区并非单一、完整的地壳结构,结合地块西南边缘强烈的地震活动,推测在青藏高原向东北的推挤作用下,其内部可能经历了破坏活动.
3.2.3 祁连地块祁连造山带位于青藏高原正向碰撞部位,遭受了强烈的挤压,地壳平均厚度大于青藏高原东北缘区域其他块体,约58~62 km(王椿镛等, 2016).因此祁连地块是研究青藏高原东北缘碰撞变形动力边界和深部过程的最佳地带(高锐等, 2001).人工地震勘探结果表明祁连造山带沉积层厚度和P波平均速度从南至北逐渐升高(Zhang et al., 2013), 其中北祁连基底埋深约1 km,中祁连基底埋深约1~3 km,南祁连基底埋深3.5~4.5 km(郭文斌等, 2016).反演结果显示浅层(Z=5 km)地震波速南低北高,在总体上与沉积岩层厚度南深北浅的特征呈现较好的一致性,值得注意的是P波速度和泊松比不仅呈现南北的差异分布,同时也呈现东西方向的差异分布,该地区布格重力异常同样呈现西低东高的分布特征(王椿镛等, 2016),中下地壳普遍存在高导层(金胜等, 2012).此外祁连地块发育的众多褶皱系构造,表明祁连地块与周围块体的浅层均存在较为强烈的挤压变形作用.上中地壳(10~30 km)结构呈现明显的分区特征,地震波速由西南至东北逐渐增大,靠近青藏高原的祁连地块西南侧呈现显著的低波速特征.接收函数研究发现祁连地块地壳泊松比值与地壳厚度呈反相关关系,推测地壳中长英质组分的增加而铁镁质组分随着地壳增厚而减少,但由于台站数量有限,并未证实其可靠性(李永华等, 2006).中地壳(Z=30 km)明显的低泊松比分布特征表明祁连地块巨厚的地壳可能对应较低的泊松比,长英质组分增加导致的地壳增厚可能主要出现在中地壳(30 km)或者更深层.巨厚的地壳和显著的低速高导特征表明祁连地块可能是青藏高原东北缘区域地壳缩短变形最强烈的地区.
3.2.4 河西走廊河西走廊是地壳较厚的祁连山构造带与地壳较薄的阿拉善地块的过渡区域, 地壳厚度45 km左右(李永华等, 2006),沉积盖层厚度约2~5 km,基底及沉积盖层结构、地表岩性具有明显的过渡带特征(郭文斌等, 2016).本文成像结果显示该地区浅层(Z=5 km)地震波速高于周围地块,表明沉积层厚度较浅,该地区泊松比较低,地震活动非常强烈.上中地壳(10~20 km)呈现较高的地震波速和较低的泊松比分布特征,且与东北部阿拉善地块和西南部祁连地块一致,大量地震集中发生在龙首山断裂两侧.下地壳(Z=30 km)结构横向变化明显,断裂两侧地震活动减小,河西走廊西北侧地震波速较低,泊松比值较高,而靠近阿拉善地块的河西走廊东侧区域泊松比较低,与祁连地块相近,接收函数研究结果(李永华等, 2006)同样显示河西走廊西北侧(肃南台、山丹台、河西堡台)为高波速比特征.因此,河西走廊浅层(Z < 20 km)地震多发的原因可能受龙首山断裂和块体挤压作用共同影响,而中下地壳(Z>20 km)的横向变化特征和低泊松比介质的分布特征可能主要受祁连地块和阿拉善地块的相互作用控制.
3.2.5 海原断裂弧形构造区海原断裂弧形构造区是位于青藏块体、阿拉善地块和鄂尔多斯地块之间的活动构造带,发育了几条巨大的北西西向左旋走滑断裂(邓起东等, 1989).重定位后地震主要沿断裂呈弧状展布,海原断裂位于高速与低速的过渡带,断裂两侧地震波速纵向差异较小,横向差异较大,东北波速较低,西南波速较高,横向差异从沉积层(Z=5 km)至下地壳(Z=30 km)持续可见.断裂两侧强烈的横向变化特征表明其地壳结构复杂,可能存在破坏变形,具有孕育强震的可能.断裂两侧的泊松比分布在纵向上同样存在差异,上地壳(Z=5~10 km)泊松比值较为正常,中下地壳(Z=20~30 km)断裂两侧差异较大,其中Z=20 km处泊松比较低的区域地震活动明显增多.接收函数研究认为海原断裂附近Moho面模糊, 105°E附近可能存在一个秦岭与祁连分界线(刘启民等, 2014),海原断裂两侧泊松比和地壳厚度均发生了比较大的变化(Wang et al., 2016).综合以上研究结果,推测海原断裂两侧地震波速和介质的泊松比可能在整个地壳范围内均存在较为明显的横向差异,这种差异特征为强震的孕育提供了基础.
4 讨论与结论本文利用区域尺度双差层析成像方法获取了青藏高原东北缘及其邻区的地震位置信息和三维速度结构.双差层析成像后走时残差明显减小,地震深度分布有所改善,5 km内地震波速的分布与沉积层厚度的对应关系证明了反演结果的可靠性.
双差层析成像研究结果表明青藏高原东北缘区域地震主要发生在祁连造山带向阿拉善地块过渡的河西走廊地区的低泊松比区域,30 km以上地壳介质泊松比整体偏低, 成分以酸性的长英质矿物为主,发生部分熔融的可能性很小.在青藏高原东北缘与外围地块的强烈碰撞挤压作用下,不同地块地壳速度结构差异明显.鄂尔多斯地块西部具有较厚的沉积盖层,中下地壳波速较高,地块内部速度结构较为稳定,破坏程度较低;阿拉善地块同样具有较厚的沉积盖层,地震主要发生在与河西走廊交汇的南边界上,地壳结构横向变化明显,在青藏块体向东北的挤压作用下其内部可能经历了破坏活动;巨厚的地壳和显著的低速高导特征表明祁连地块可能是青藏高原东北缘区域地壳缩短变形最强烈的地区,地壳增厚主要发生在30 km深度左右或者更深处;河西走廊过渡带地壳结构横向变化明显,地震活动最为强烈,可能受龙首山断裂深部活动和两侧块体挤压作用的共同影响;海原断裂两侧地震波速和介质的泊松比存在明显的横向差异,这种差异特征为强震的孕育提供了基础.
致谢感谢中国地震台网中心提供的震相数据,感谢中国科学与技术大学张海江教授和郭浩博士研究生提供的TomoDD程序,本文使用了GMT软件(Wessel et al., 2011)进行制图.
| Allam A A, Ben-Zion Y. 2012. Seismic velocity structures in the southern California plate-boundary environment from double-difference tomography. Geophys. J. Int., 190(2): 1181-1196. DOI:10.1111/j.1365-246X.2012.05544.x | |
| Chen J H, Liu Q Y, Li S C, et al. 2005. Crust and upper mantle S-wave velocity structure across Northeastern Tibetan Plateau and Ordos block. Chinese J. Geophys., 48(2): 333-342. DOI:10.3321/j.issn:0001-5733.2005.02.015 | |
| Christensen N I. 1996. Poisson's ratio and crustal seismology. J. Geophys. Res., 101(B2): 3139-3156. DOI:10.1029/95JB03446 | |
| Deng Q D, Zhang W Q, Zhang P Z, et al. 1989. Haiyuan strike-slip fault zone and its compressional structures of the end. Seismology and Geology, 11(1): 1-14. | |
| Deng W Z, Chen J H, Guo B, et al. 2014. Fine velocity structure of the Longmenshan fault zone by double-difference tomography. Chinese J. Geophys., 57(4): 1101-1110. DOI:10.6038/cjg20140408 | |
| Ding Z F, He Z Q, Sun W G, et al. 1999. 3-D Crust and upper mantle velocity structure in eastern Tibetan plateau and its surrounding areas. Chinese J. Geophys., 42(2): 197-205. DOI:10.3321/j.issn:0001-5733.1999.02.007 | |
| Dixit M M, Kumar S, Catchings R D, et al. 2014. Seismicity, faulting, and structure of the Koyna-Warna seismic region, Western India from local earthquake tomography and hypocenter locations. J. Geophys. Res., 119(8): 6372-6398. DOI:10.1002/2014JB010950 | |
| Eberhart-Phillips D. 1986. Three-dimensional velocity structure in the northern California Coast Ranges from inversion of local earthquake arrival times. Bull. Seismol. Soc. Am., 76(4): 1025-1052. | |
| Gao H L, He J G, Zhang S, et al. 2013. Study on crustal stability of Alashan area. World Nuclear Geoscience, 30(4): 237-244. DOI:10.3969/j.issn.1672-0636.2013.04.009 | |
| Gao R, Li P W, Li Q S, et al. 2001. Deep process of the collision and deformation on the northern margin of the Tibetan Plateau: Revelation from investigation of the deep seismic profiles. Science in China Series D: Earth Sciences, 44(S1): 71-78. DOI:10.1007/BF02911973 | |
| Guo B, Liu Q Y, Chen J H, et al. 2004. Seismic tomographic imaging of the crust and upper mantle beneath the Northeastern edge of the Qinghai-Xizang plateau and the Ordos area. Chinese J. Geophys., 47(5): 790-797. DOI:10.3321/j.issn:0001-5733.2004.05.009 | |
| Guo W B, Jia S X, Duan Y H, et al. 2016. A study on the basement tectonic units in the northeast margin of Tibetan plateau-the result of Maduo-Gonghe-Yabrai refraction profile. Chinese J. Geophys., 59(10): 3627-3636. DOI:10.6038/cjg20161010 | |
| Hansen P C. 1992. Analysis of discrete ill-posed problems by means of the L-curve. SIAM Rev., 34(4): 561-580. DOI:10.1137/1034115 | |
| Hansen P C, O'Leary D P. 1993. The use of the L-curve in the regularization of discrete ill-posed problems. SIAM J. Sci. Comput., 14(6): 1487-1503. DOI:10.1137/0914086 | |
| Jia S X, Zhang X K. 2008. Study on the crust phases of deep seismic sounding experiments and fine crust structures in the northeast margin of Tibetan plateau. Chinese J. Geophys., 51(5): 1431-1443. DOI:10.3321/j.issn:0001-5733.2008.05.016 | |
| Jin S, Zhang L T, Jin Y J, et al. 2012. Crustal electrical structure along the Hezuo-Dajing profile across the Northeastern Margin of the Tibetan Plateau. Chinese J. Geophys., 55(12): 3979-3990. DOI:10.6038/j.issn.0001-5733.2012.12.010 | |
| Li H O, Xu X W, Ma W T. 2011. Double-difference tomography in Tianzhu-Gulang region and discussion on seismotectonics of 1927 Gulang M8.0 earthquake. Acta Seismologica Sinica, 32(2): 156-164. DOI:10.3969/j.issn.0253-3782.2011.02.004 | |
| Li S H, Wang Y B, Liang Z B, et al. 2012. Crustal structure in southeastern Gansu from regional seismic waveform inversion. Chinese J. Geophys., 55(4): 1186-1197. DOI:10.6038/j.issn.0001-5733.2012.04.015 | |
| Li S L, Zhang X K, Zhang C K, et al. 2002. A preliminary study on the crustal velocity structure of Maqin-Lanzhou-Jingbian by means of deep seismic sounding profile. Chinese J. Geophys., 45(2): 210-217. DOI:10.3321/j.issn:0001-5733.2002.02.007 | |
| Li X F, Li H Y, Shen Y, et al. 2014. Crustal velocity structure of the northeastern Tibetan Plateau from ambient noise surface-wave tomography and its tectonic implications. Bull. Seismol. Soc. Am., 104(3): 1045-1055. DOI:10.1785/0120130019 | |
| Li Y H, Wu Q J, An Z H, et al. 2006. The Poisson ratio and crustal structure across the NE Tibetan Plateau determined from receiver functions. Chinese J. Geophys., 49(5): 1359-1368. DOI:10.3321/j.issn:0001-5733.2006.05.015 | |
| Liang C T, Song X D. 2006. A low velocity belt beneath northern and eastern Tibetan Plateau from Pn tomography. Geophys. Res. Lett., 33(22): L22306. DOI:10.1029/2006GL027926 | |
| Lin J Y, Duan Y H. 2016. Upper crustal structure of Haiyuan tectonic zone and its surrounding areas. Acta Seismologica Sinica, 38(2): 179-187. DOI:10.11939/jass.2016.02.003 | |
| Liu M J, Mooney W D, Li S L, et al. 2006. Crustal structure of the northeastern margin of the Tibetan plateau from the Songpan-Ganzi terrane to the Ordos basin. Tectonophysics, 420(1-2): 253-266. DOI:10.1016/j.tecto.2006.01.025 | |
| Liu M J, Li S L, Fang S M, et al. 2008. Study on crustal composition and geodynamics using seismic velocities in the northeastern margin of the Tibetan Plateau. Chinese J. Geophys., 51(2): 412-430. DOI:10.3321/j.issn:0001-5733.2008.02.014 | |
| Liu Q M, Zhao J M, Lu F, et al. 2014. Crustal structure of northeastern margin of the Tibetan Plateau by receiver function inversion. Science China Earth Sciences, 57(4): 741-750. DOI:10.1007/s11430-013-4772-5 | |
| Ma X, Westman E C, Fahrman B P, et al. 2016. Imaging of temporal stress redistribution due to triggered seismicity at a deep nickel mine. Geomechanics for Energy and the Environment, 5: 55-64. DOI:10.1016/j.gete.2016.01.001 | |
| Paige C C, Saunders M A. 1982. Algorithm 583: LSQR: Sparse linear equations and least squares problems. ACM Trans. Math. Softw, 8(2): 195-209. DOI:10.1145/355993.356000 | |
| Pan S Z, Niu F L. 2011. Large contrasts in crustal structure and composition between the Ordos plateau and the NE Tibetan plateau from receiver function analysis. Earth Planet. Sci. Lett., 303(3-4): 291-298. DOI:10.1016/j.epsl.2011.01.007 | |
| Pesicek J D, Thurber C H, Zhang H, et al. 2010. Teleseismic double-difference relocation of earthquakes along the Sumatra-Andaman subduction zone using a 3-D model. J. Geophys. Res., 115(B10). DOI:10.1029/2010JB007443 | |
| Shen X Z, Mei X P, Zhang Y S. 2011. The crustal and upper-mantle structures beneath the Northeastern Margin of Tibet. Bull. Seismol. Soc. Am., 101(6): 2782-2795. DOI:10.1785/0120100112 | |
| Shen X Z, Yuan X H, Liu M. 2015. Is the Asian lithosphere underthrusting beneath northeastern Tibetan Plateau? Insights from seismic receiver functions. Earth Planet. Sci. Lett., 428: 172-180. DOI:10.1016/j.epsl.2015.07.041 | |
| Spakman W, van der Lee S, van der Hilst R. 1993. Travel-time tomography of the European-Mediterranean mantle down to 1400 km. Phys. Earth Planet. Int., 79(1-2): 3-74. DOI:10.1016/0031-9201(93)90142-V | |
| Tapponnier P, Xu Z Q, Roger F, et al. 2001. Oblique stepwise rise and growth of the Tibet plateau. Science, 294(5547): 1671-1677. DOI:10.1126/science.105978 | |
| Teng J W, Wang F Y, Zhao W Z, et al. 2008. Velocity distribution of upper crust, undulation of sedimentary formation and crystalline basement beneath the Ordos basin in North China. Chinese J. Geophys., 51(6): 1753-1766. DOI:10.3321/j.issn:0001-5733.2008.06.016 | |
| Waldhauser F, Ellsworth W L. 2000. A double-difference earthquake location algorithm: Method and application to the northern Hayward fault, California. Bull. Seismol. Soc. Am., 90(6): 1353-1368. DOI:10.1785/0120000006 | |
| Wang C Y, Li Y H, Lou H. 2016. Issues on crustal and upper-mantle structures associated with geodynamics in the northeastern Tibetan Plateau. Chin. Sci. Bull., 61(20): 2239-2263. DOI:10.1360/N972016-00160 | |
| Wang C Z, Wu J P, Fang L H, et al. 2013. The relationship between wave velocity structure around Yushu earthquake source region and the distribution of aftershocks. Chinese J. Geophys., 56(12): 4072-4083. DOI:10.6038/cjg20131212 | |
| Wang H Y, Gao R, Zeng L S, et al. 2014. Crustal structure and Moho geometry of the northeastern Tibetan plateau as revealed by SinoProbe-02 deep seismic-reflection profiling. Tectonophysics, 636: 32-39. DOI:10.1016/j.tecto.2014.08.010 | |
| Wang H Y, Gao R, Li Q S, et al. 2014. Deep seismic reflection profiling in the Songpan-west Qinling-Linxia basin of the Qinghai-Tibet plateau: Data acquisition, data processing and preliminary interpretations. Chinese J. Geophys., 57(5): 1451-1461. DOI:10.6038/cjg20140510 | |
| Wang Q, Niu F L, Gao Y, et al. 2016. Crustal structure and deformation beneath the NE margin of the Tibetan plateau constrained by teleseismic receiver function data. Geophys. J. Int., 204(1): 167-179. DOI:10.1093/gji/ggv420 | |
| Wang S J, Wang F Y, Zhang J S, et al. 2014. The P-wave velocity structure of the lithosphere of the North China Craton-Results from the Wendeng-Alxa Left Banner deep seismic sounding profile. Science China Earth Sciences, 57(9): 2053-2063. DOI:10.1007/s11430-014-4903-7 | |
| Wang W L, Wu J P, Fang L H, et al. 2017. Sedimentary and crust thicknesses and Poisson's ratios for the NE Tibetan Plateau and its adjacent regions based on dense seismic arrays. Earth Planet. Sci. Lett., 462: 76-85. DOI:10.1016/j.epsl.2016.12.040 | |
| Wang W P. 2016. The application of double-difference tomography method in the intersection zone of Xianshuihe fault, Anninghe fault and Longmenshan fault [Master's thesis] (in Chinese). Beijing: Institute of Geophysics, China Earthquake Administration, 27-28. | |
| Wang X N, Yu X W, Zhang W B. 2015. 3D P-wave velocity structure of the crust and relocation of earthquakes in the Lushan source area. Chinese J. Geophys., 58(4): 1179-1193. DOI:10.6038/cjg20150408 | |
| Wang Y X, Mooney W D, Han G H, et al. 2005. Crustal P-wave velocity structure from Altyn Tagh to Longmen mountains along the Taiwan-Altay geoscience transect. Chinese J. Geophys., 48(1): 98-106. DOI:10.3321/j.issn:0001-5733.2005.01.015 | |
| Wang Y X, Mooney W D, Yuan X C, et al. 2013. Crustal structure of the northeastern Tibetan Plateau from the Southern Tarim Basin to the Sichuan Basin, China. Tectonophysics, 584: 191-208. DOI:10.1016/j.tecto.2012.09.003 | |
| Wessel P, Smith W H, Scharroo R, et al. 2011. The generic mapping tools (GMT) version 5. //AGU Fall Meeting. Washington: American Geophysical Union, 329. | |
| Xu Z J, Song X D. 2010. Joint inversion for crustal and Pn velocities and Moho depth in Eastern Margin of the Tibetan Plateau. Tectonophysics, 491(1-4): 185-193. DOI:10.1016/j.tecto.2009.11.022 | |
| Yang Z X, Chen Y T, Zheng Y J, et al. 2003. Accurate relocation of earthquakes in central-western China using the double-difference earthquake location algorithm. Science in China Series D: Earth Sciences, 46(S2): 181-188. | |
| Yao Z X, Wang C Y, Zeng R S, et al. 2014. Crustal structure in western Qinling tectonic belt and its adjacent regions deduced from receiver functions. Acta Seismologica Sinica, 36(1): 1-19. DOI:10.3969/j.issn.0253-3782.2014.01.001 | |
| Yu D X, Li Y H, Wu Q J, et al. 2014. S-wave velocity structure of the northeastern Tibetan Plateau from joint inversion of Rayleigh wave phase and group velocities. Chinese J. Geophys., 57(3): 800-811. DOI:10.6038/cjg20140310 | |
| Zhang G W, Guo A L, Yao A P. 2004. Western Qinling-Songpan continental tectonic node in China's continental tectonics. Earth Science Frontiers, 11(3): 23-32. | |
| Zhang H J, Thurber C H. 2003. Double-difference tomography: The method and its application to the Hayward Fault, California. Bull. Seismol. Soc. Am., 93(5): 1875-1889. DOI:10.1785/0120020190 | |
| Zhang H J, Thurber C. 2006. Development and applications of double-difference seismic tomography. Pure Appl. Geophys., 163(2-3): 373-403. DOI:10.1007/s00024-005-0021-y | |
| Zhang H S, Teng J W, Tian X B, et al. 2012. Lithospheric thickness and upper-mantle deformation beneath the NE Tibetan Plateau inferred from S receiver functions and SKS splitting measurements. Geophys. J. Int., 191(3): 1285-1294. DOI:10.1111/j.1365-246X.2012.05667.X | |
| Zhang H S, Gao R, Tian X B, et al. 2015. Crustal S wave velocity beneath the northeastern Tibetan plateau inferred from teleseismic P wave receiver functions. Chinese J. Geophys., 58(11): 3982-3992. DOI:10.6038/cjg20151108 | |
| Zhang X K, Jia S X, Zhao J R, et al. 2008. Crustal structures beneath West Qinling-East Kunlun orogen and its adjacent area-Results of wide-angle seismic reflection and refraction experiment. Chinese J. Geophys., 51(2): 439-450. | |
| Zhang Y Q, Guo Y R, Hou W, et al. 2013. Geochemical characteristics and exploration potential of the Middle-Upper Ordovician source rocks on the western and southern margin of Ordos Basin. Natural Gas Geoscience, 24(5): 894-904. | |
| Zhang Z J, Bai Z M, Klemperer S L, et al. 2013. Crustal structure across northeastern Tibet from wide-angle seismic profiling: Constraints on the Caledonian Qilian orogeny and its reactivation. Tectonophysics, 606: 140-159. DOI:10.1016/j.tecto.2013.02.040 | |
| Zheng T Y, Zhao L, Zhu R X. 2010b. New evidence from seismic imaging for subduction during assembly of the North China craton: Reply. Geology, 38(4): e207. DOI:10.1130/G30801Y.1 | |
| Zheng Y, Yang Y J, Ritzwoller M H, et al. 2010a. Crustal structure of the northeastern Tibetan plateau, the Ordos block and the Sichuan basin from ambient noise tomography. Earthq. Sci., 23(5): 465-476. DOI:10.1007/s11589-010-0745-3 | |
| Zhou M D, Zhao H Y, Ma Q Z, et al. 1997. The relationship between crust structure and earthquakes in the northeast verge of Qinghai-Xizang plateau and its neighborhood. Northwestern Seismological Journal, 19(1): 58-63. | |
| Zhou M D, Zhang Y S, Shi Y L, et al. 2006. Three-dimensional crustal velocity structure in the northeastern margin of the Qinghai-Tibetan plateau. Progress in Geophysics, 21(1): 127-134. DOI:10.3969/j.issn.1004-2903.2006.01.019 | |
| 陈九辉, 刘启元, 李顺成, 等. 2005. 青藏高原东北缘—鄂尔多斯地块地壳上地幔S波速度结构. 地球物理学报, 48(2): 333–342. DOI:10.3321/j.issn:0001-5733.2005.02.015 | |
| 邓起东, 张维岐, 张培震, 等. 1989. 海原走滑断裂带及其尾端挤压构造. 地震地质, 11(1): 1–14. | |
| 邓文泽, 陈九辉, 郭飚, 等. 2014. 龙门山断裂带精细速度结构的双差层析成像研究. 地球物理学报, 57(4): 1101–1110. DOI:10.6038/cjg20140408 | |
| 丁志峰, 何正勤, 孙为国, 等. 1999. 青藏高原东部及其边缘地区的地壳上地幔三维速度结构. 地球物理学报, 42(2): 197–205. DOI:10.3321/j.issn:0001-5733.1999.02.007 | |
| 高洪雷, 何建国, 张松, 等. 2013. 阿拉善地区地壳稳定性研究. 世界核地质科学, 30(4): 237–244. DOI:10.3969/j.issn.1672-0636.2013.04.009 | |
| 高锐, 李朋武, 李秋生, 等. 2001. 青藏高原北缘碰撞变形的深部过程——深地震探测成果之启示. 中国科学(D辑), 31(S): 66–71. | |
| 郭飚, 刘启元, 陈九辉, 等. 2004. 青藏高原东北缘——鄂尔多斯地壳上地幔地震层析成像研究. 地球物理学报, 47(5): 790–797. DOI:10.3321/j.issn:0001-5733.2004.05.009 | |
| 郭文斌, 嘉世旭, 段永红, 等. 2016. 青藏高原东北缘基底结构研究——玛多—共和—雅布赖剖面上地壳地震折射探测. 地球物理学报, 59(10): 3627–3636. DOI:10.6038/cjg20161010 | |
| 嘉世旭, 张先康. 2008. 青藏高原东北缘深地震测深震相研究与地壳细结构. 地球物理学报, 51(5): 1431–1443. DOI:10.3321/j.issn:0001-5733.2008.05.016 | |
| 金胜, 张乐天, 金永吉, 等. 2012. 青藏高原东北缘合作——大井剖面地壳电性结构研究. 地球物理学报, 55(12): 3979–3990. DOI:10.6038/j.issn.0001-5733.2012.12.010 | |
| 李海鸥, 徐锡伟, 马文涛. 2011. 天祝—古浪地区双差地震层析成像与古浪地震构造探讨. 地震学报, 33(2): 156–164. DOI:10.3969/j.issn.0253-3782.2011.02.004 | |
| 李少华, 王彦宾, 梁子斌, 等. 2012. 甘肃东南部地壳速度结构的区域地震波形反演. 地球物理学报, 55(4): 1186–1197. DOI:10.6038/j.issn.0001-5733.2012.04.015 | |
| 李松林, 张先康, 张成科, 等. 2002. 玛沁—兰州—靖边地震测深剖面地壳速度结构的初步研究. 地球物理学报, 45(2): 210–217. DOI:10.3321/j.issn:0001-5733.2002.02.007 | |
| 李永华, 吴庆举, 安张辉, 等. 2006. 青藏高原东北缘地壳S波速度结构与泊松比及其意义. 地球物理学报, 49(5): 1359–1368. DOI:10.3321/j.issn:0001-5733.2006.05.015 | |
| 林吉焱, 段永红. 2016. 海原构造区及其周缘上部地壳结构研究. 地震学报, 38(2): 179–187. DOI:10.11939/jass.2016.02.003 | |
| 刘明军, 李松林, 方盛明, 等. 2008. 利用地震波速研究青藏高原东北缘地壳组成及其动力学. 地球物理学报, 51(2): 412–430. DOI:10.3321/j.issn:0001-5733.2008.02.014 | |
| 刘启民, 赵俊猛, 卢芳, 等. 2014. 用接收函数方法反演青藏高原东北缘地壳结构. 中国科学:地球科学, 44(4): 668–679. | |
| 滕吉文, 王夫运, 赵文智, 等. 2008. 鄂尔多斯盆地上地壳速度分布与沉积建造和结晶基底起伏的构造研究. 地球物理学报, 51(6): 1753–1766. DOI:10.3321/j.issn:0001-5733.2008.06.016 | |
| 王椿镛, 李永华, 楼海. 2016. 与青藏高原东北部地球动力学相关的深部构造问题. 科学通报, 61(20): 2239–2263. DOI:10.1360/N972016-00160 | |
| 王长在, 吴建平, 房立华, 等. 2013. 玉树地震震源区速度结构与余震分布的关系. 地球物理学报, 56(12): 4072–4083. DOI:10.6038/cjg20131212 | |
| 王海燕, 高锐, 李秋生, 等. 2014. 青藏高原松潘—西秦岭—临夏盆地深地震反射剖面——采集、处理与初步解释. 地球物理学报, 57(5): 1451–1461. DOI:10.6038/cjg20140510 | |
| 王帅军, 王夫运, 张建狮, 等. 2014. 华北克拉通岩石圈二维P波速度结构特征——文登—阿拉善左旗深地震测深剖面结果. 中国科学:地球科学, 44(12): 2697–2708. | |
| 王伟平. 2016. 鲜水河、安宁河和龙门山断裂带交汇区双差层析成像研究[硕士论文]. 北京: 中国地震局地球物理研究所, 27-28. | |
| 王小娜, 于湘伟, 章文波. 2015. 芦山震区地壳三维P波速度精细结构及地震重定位研究. 地球物理学报, 58(4): 1179–1193. DOI:10.6038/cjg20150408 | |
| 王有学, MooneyW D, 韩果花, 等. 2005. 台湾—阿尔泰地学断面阿尔金—龙门山剖面的地壳纵波速度结构. 地球物理学报, 48(1): 98–106. DOI:10.3321/j.issn:0001-5733.2005.01.015 | |
| 杨智娴, 陈运泰, 郑月军, 等. 2003. 双差地震定位法在我国中西部地区地震精确定位中的应用. 中国科学(D缉), 33(S): 129–134. | |
| 姚志祥, 王椿镛, 曾融生, 等. 2014. 利用接收函数方法研究西秦岭构造带及其邻区地壳结构. 地震学报, 36(1): 1–19. DOI:10.3969/j.issn.0253-3782.2014.01.001 | |
| 余大新, 李永华, 吴庆举, 等. 2014. 利用Rayleigh波相速度和群速度联合反演青藏高原东北缘S波速度结构. 地球物理学报, 57(3): 800–811. DOI:10.6038/cjg20140310 | |
| 张国伟, 郭安林, 姚安平. 2004. 中国大陆构造中的西秦岭—松潘大陆构造结. 地学前缘, 11(3): 23–32. | |
| 张洪双, 高锐, 田小波, 等. 2015. 青藏高原东北缘地壳S波速度结构及其动力学含义——远震接收函数提供的证据. 地球物理学报, 58(11): 3982–3992. DOI:10.6038/cjg20151108 | |
| 张先康, 嘉世旭, 赵金仁, 等. 2008. 西秦岭—东昆仑及邻近地区地壳结构——深地震宽角反射/折射剖面结果. 地球物理学报, 51(2): 439–450. | |
| 张月巧, 郭彦如, 侯伟, 等. 2013. 鄂尔多斯盆地西南缘中上奥陶统烃源岩特征及勘探潜力. 天然气地球科学, 24(5): 894–904. | |
| 周民都, 赵和云, 马钦忠, 等. 1997. 青藏高原东北缘及其邻区的地壳结构与地震关系初探. 西北地震学报, 19(1): 58–63. | |
| 周民都, 张元生, 石雅鏐, 等. 2006. 青藏高原东北缘地壳三维速度结构. 地球物理学进展, 21(1): 127–134. DOI:10.3969/j.issn.1004-2903.2006.01.019 | |