 2017, Vol. 60


2. 中国地震局地壳应力研究所(地壳动力学重点实验室), 北京 100085;
3. 北京交通大学土木建筑工程学院, 北京 100044
2. Key Laboratory of Crustal Dynamics, Institute of Crustal Dynamics, China Earthquake Administration, Beijing 100085, China;
3. Beijing Jiaotong University, Beijing 100044, China
构造应力场在地球动力学研究中具有重要意义,其时空变化是导致地壳形变、破裂、褶皱等地质现象发生的直接动因.构造应力场特征的研究为深入了解地震机理、构造变形及地震与应力的相互作用提供了重要的参考.青藏高原是全球构造活动最剧烈的地区之一,也是我国一级应力分区——西部构造应力区的主要组成部分,其独特的构造和地球物理环境使其成为大陆动力学研究的天然实验室(郑勇,2005).其地壳岩石层变形运动、岩石圈结构、应力-应变场、地质构造、演化和隆升过程以及动力学机制一直是地球科学家们研究的热点(Magni et al., 2016;Lu et al., 2016;Xu et al., 2016;Zuza and Yin, 2016;Chevalier et al., 2016;Ye et al., 2016;Sternai et al., 2016;Mao et al., 2016;Ding et al., 2016;洪磊,2016;叶卓,2016;石耀霖等,2015;葛伟鹏等,2015;郭桂红等,2015;陈顺云等,2014;杨树新,2013;Zhao et al., 2011;张东宁等,2007;卢占武等,2006;徐纪人等,2006;张晓亮等,2004;马润勇等,2004).近年来许多学者对青藏高原及周缘构造应力场的东西地质构造差异、地壳形变特征、壳幔结构、区域应力场特征、地壳介质的各向异性特征等进行了研究(肖龙等,2005;尉晓玮,2006;张冬菊,2006;李永华等,2006;张辉,2007;刘鸣,2010;孙长青等,2014;石玉涛,2014;郭祥云等,2014;肖卓,2015;Eva et al., 2015;Guo et al., 2015;Zhu et al., 2016;Chen et al., 2016;Kumar et al., 2015;Shi et al., 2016;Zuza and Yin, 2016).
地应力测量是反映地应力场最直接的方法,然而限于实测地应力资料的收集和整理工作量大,目前利用实测资料对应力场进行的研究较少.李方全等(1988)、曾秋生(1989)、赵德安等(2007)、景锋等(2007)、王艳华等(2012)根据地应力测量资料讨论了地壳上部地应力与深度的关系;朱焕春和陶振宇(1994)、蔡美峰(2000)、景锋等(2008)按岩浆岩、沉积岩和变质岩分类,研究了地应力与深度的关系,发现三大类岩石的地应力分布规律存在差异,其主要与岩石地质成因相关,显示出地应力随岩石杨氏模量增高而增大;谢富仁等(2004)汇集了各种实测资料,提供了一幅反映我国现代构造应力场基本轮廓和变化特征的基础图件;杨树新等(2012)采用等深度段分组归纳的方法解决了实测地应力数据样本数量沿深度分布不均匀的问题,按构造区块给出了中国大陆与各研究区地壳浅层测量深度范围内应力量值、方位特征.
前人对青藏高原地区浅层构造应力场量值特征的研究更是微乎其微.Yao等(2010)研究了水平最大、最小应力随深度变化的分布统计特征,并通过将研究区内实测地应力值扣除重力影响的方法,分析了构造应力随深度变化的统计特征以及各区内的构造应力方位特征.米琦(2015)给出了青藏高原东南缘地区总体及各研究子区水平构造应力的方位特征与量值范围.本文依托“中国大陆地壳应力环境基础数据库”,应用最新数据,借鉴Yang等(2014)的方法,给出两种模式估算构造应力的结果,针对青藏高原及周缘地区展开对地壳浅层构造应力场量值特征的研究,并与前人利用其他资料成果研究的构造应力场特征进行了对比.本文对构造应力场量值特征的分析为深部构造应力特征提供了参考价值.
2 地应力数据 2.1 数据收集我国自20世纪60年代开始,就开展了原地应力测量工作及相应的地应力场研究工作,相继开展了应力解除、水压致裂、声发射等原地应力测量方法和压容式、压磁式、体积式应力应变观测技术,同时发展了震源机制解、地震矩张量、活动断层滑动反演、钻孔崩落等构造应力场研究方法,积累了大量基础资料和研究成果,并在科学研究、防震减灾和经济建设中起到了重要作用.中国地震局地壳应力研究所建立了开放式的“中国大陆地壳应力环境基础数据库”,收集、整理和发布了全国地壳应力基础环境数据和研究成果,并且数据在持续更新,目前该数据库已整合到了世界应力图中.其中,应力解除、水压致裂是国际岩石力学学会推荐使用的原地应力测量方法,不但能测出地应力方向,还可测出应力量值,是一笔珍贵的地应力测量资料.笔者近几年一直负责应力解除、水压致裂数据的更新,每年年初都从上一年度公开发表论文中收集这两类数据,经整理后纳入到“中国大陆地壳应力环境基础数据库”.
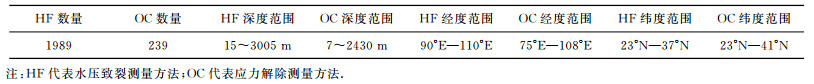
目前,该库共收录了1119个钻孔的水压致裂原地应力测量数据4272条,其中常规平面应力测量有973个钻孔的数据,多孔交汇法水压致裂三维应力测量有81个钻孔的数据,只给出梯度信息而无具体测段数值的应力测量有65个钻孔的数据.应力解除数据有786个钻孔(条)的数据,其中平面应力测量258条,三维应力测量528条.本文研究区具体数据情况见表 1.
|
|
表 1 研究区数据情况表 Table 1 The data in this paper |
青藏高原南起喜马拉雅山脉南缘,北至昆仑山、阿尔金山和祁连山北缘,西至帕米尔高原和喀喇昆仑山脉,东及东北部与秦岭山脉西段和黄土高原相接(张镱锂等,2002).
南北地震带作为中国大陆地应力场一级分区的边界,其构造应力场的研究对理解大陆强震机理、构造变形和地震应力的相互作用具有重要意义,遂本文选取青藏高原及周缘研究区的地理空间范围为21°N —40°N,73°E —110°E.
研究区子区的划分按张培震等(2003)在研究中国大陆强震活动时定义的“活动地块”.其对中国大陆及邻区进行了2级分区,其中6个Ⅰ级活动地块区分别是青藏地块、西域地块、华南地块、滇缅地块、华北地块和东北地块,本文使用了该研究成果.南北地震带以构造方向可分北、中、南三段,北段在阿拉善地块东界与贺兰山之间,中段为北东向龙门山逆冲推覆构造带,南段边界为西域板块逆时针旋转构造就位与中朝、扬子板块拼合碰撞所形成的缝合线(葛肖虹,2010).其中,滇缅地块与南北地震带南段基本重合,本文合并为一个子区进行研究,最终在本文的研究区内有7个子区,分别为西域地块、青藏地块、南北地震带北段、南北地震带中段、南北地震带南段、华北地块、华南地块,鉴于数据分布情况(图 1),本文的重点研究子区为4个:青藏地块、南北地震带北段、南北地震带中段、南北地震带南段.

|
图 1 各研究区地应力数据分布 Fig. 1 The distribution of in-situ stress measurement data in each research region |
为使研究结果更能反映研究区地应力整体特征,我们对实测数据进行优化处理:(1) 去掉水平应力量值、主应力信息和深度不完整的数据;(2) 剔除检验主应力方向交角结果为小于85°或大于105°的数据;(3) 筛掉偏离拟合线最多的5%的异常数据,如图 2所示,筛选后,水压致裂数据有1775条,深度范围是15~2117 m;应力解除数据有152条,深度范围是7~790 m.

|
图 2 实测应力随深度变化与数据优化示意图 Fig. 2 Measured stresses variation with depth and data optimization |
本文采用杨树新等(2012)的解决办法,按相等的深度段将数据分组,按组计算数据的平均深度、平均量值,用各组的平均深度、平均量值回归分析地应力随深度变化规律.该方法克服了前人关于实测地应力随深度变化的统计回归研究中,数据样本数量沿深度分布不均匀的问题,即由于浅部的数据多,深部数据少,统计回归的结果必然更多反映了浅部特征,而有可能更能代表区域地应力特征的深部数据由于数量较少而被淹没,从而在统计回归的结果中没有合理体现,使得统计回归的结果可能出现偏差.青藏高原及其周缘最大水平应力σH(单位:MPa)、最小水平应力σh(单位:MPa)随深度D(单位:km)变化规律如图 3所示,比较直接分析结果(图 2)与采用10 m等深度段分组归纳方法的分析结果(图 3),从随深度分布图与回归方程可以看到,等深度段分组归纳后的回归线与深部数据吻合得更好,σH、σh与D的相关系数R都达到0.9以上,可信度提高.

|
图 3 实测应力σH、σh随深度变化与回归方程 Fig. 3 Measured stresses variation with depth and regression equations |
岩石圈上部弹性部分的应力场是重力、大尺度力源(板块边界力、地球动力学过程产生的力、地壳介质非均匀)、局部力源(地形、地壳介质弹性性质和强度的各向异性、侵入过程、人工开挖)叠加的结果(Zoback et al., 1989).影响地应力场的因素主要与地球现今的各运动过程相关:如板块边界受压、地幔热对流、地球内应力、地心引力、地球旋转、岩浆浸入和地壳非均匀扩容等,另外,温度不均、水压梯度、地表剥蚀或其他物理化学变化等也可引起相应的应力场(杨保存等,2009).实测地应力就是这些因素综合作用的反映,其主要影响因素是自重和地质构造作用(郭怀志等,1983).Zang等(2010)同样认为影响实测应力的众多因素中只有重力和构造应力能达到较高量级,实测应力可以看成重力与构造应力的叠加.因此本文假定实测应力主要是自重和地质构造作用的反映.
1912年,瑞士地质学家海姆(Heim)假定地应力是一种静水压力状态,即地壳中任意点的应力在各个方向上均相等,且等于单位面积上覆岩层的重量,即

|
(1) |
式中,γ为上覆岩层的容重,D为埋深.
1926年,苏联学者金尼克(A. H. Gennik)修正了海姆的静水压力假设,认为地壳中各点的垂直应力等于上覆岩层的重量,而侧向应力(水平应力)是泊松效应的结果,其值应为γD乘以一个修正系数,他根据弹性力学理论,认为这个系数等于
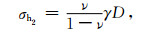
|
(2) |
式中,ν为上覆岩层的泊松比.
20世纪20年代,我国地质学家李四光指出:“在构造应力的作用仅影响地壳上层一定厚度的情况下,水平应力分量的重要性远远超过垂直应力分量” (蔡美峰,2000).
本文尝试采用实测地应力值扣除重力作用的方法,分析青藏高原及其周缘地壳浅部构造应力量值特征,认为σh1是垂直应力对水平应力的最大影响,σh2是垂直应力对水平应力的最小影响.通过上述估算方法给出研究区的最大水平构造应力σT(单位:MPa)、最小水平构造应力σt(单位:MPa)量值范围为

|
(3) |

|
(4) |
其中,

|
(5) |

|
(6) |

|
(7) |

|
(8) |
在具体分析计算中,取ν=0.25、γ=27 kN·m-3.
4 构造应力量值估算结果 4.1 水平构造应力随深度变化按上述方法得到的研究区及各块体的最大、最小水平构造应力随深度变化规律如表 2所示.
|
|
表 2 水平构造应力随深度估算值 Table 2 Regression equations of horizontal tectonic stress |
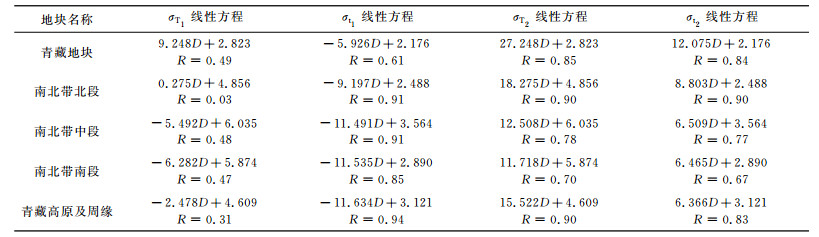
岩石力学与地球物理研究结果均表明,在地壳浅层随深度增加地壳强度增大,青藏高原地区受印度板块的挤压作用,地壳浅层挤压构造作用总体特征应该是随深度增大.估算结果显示(表 2),除青藏地块的σT1(水平应力量值大,扣除重力作用后,构造应力仍然随深度增大)和南北带北段的σT1(梯度虽为正,但很小,且相关系数很低)外,σT1和σt1梯度值均为负值,表明两者均随深度减小,这与前述研究结果相违.因此按海姆假说扣除重力影响显然是夸大了其作用.最大水平构造应力σT不应该小于其地表值.本文取其地表值为σT的下限,图 3给出了水平构造应力随深度变化的估算范围.
青藏高原及周缘水平构造应力σT、σt估算范围如下:

|
(9) |

|
(10) |
σT、σt地表值为4.6 MPa、3.1 MPa左右,σT2和σt2随深度增大分别以15.5 MPa·km-1、6.4 MPa·km-1的梯度增大.
各研究区σT1、σT2的地表值(D=0 km)相同,由高到低排序依次为南北带中段6.0 MPa、南北带南段5.9 MPa、南北带北段4.9 MPa、青藏地块2.8 MPa. σT2梯度值均为正,表明σT2均随深度增大,梯度值从大到小排列依次是青藏块体27.2 MPa·km-1、南北带北段18.3 MPa·km-1、南北带中段12.5 MPa·km-1、南北带南段11.7 MPa·km-1.
地表值与梯度值反映了在测量深度范围内构造作用随深度变化的特点.σT1地表值大,梯度值较小,反映出靠近地表水平构造作用较强;地表值小,梯度值大,反映出靠近地表水平构造作用较弱,但随深度加深构造作用快速增大.如青藏地块σT1地表值只有2.8 MPa,梯度值达到27.2 MPa·km-1,反映出青藏块体“浅弱深强”的水平构造作用特征,这与地球物理、活动构造研究结果相吻合(Tapponnier and Molnar, 1977;阚荣举等,1977;邓起东等,1979;许忠淮等,1989;许忠淮和石耀霖,2003).
4.2 水平构造差应力值随深度变化由水平构造应力估算方法可知,重力作用对于σH、σh的贡献是相同的,因此水平构造差应力σT-σt与水平差应力σH-σh也是相同的,青藏高原及其周缘与各地块水平构造差应力值随深度变化如图 5所示.

|
图 4 水平构造应力随深度分布 (a)青藏高原及其周缘; (b)青藏地块; (c)南北带北段; (d)南北带中段; (e)南北带南段. Fig. 4 Horizontal tectonic stresses variation with depth (a) Qinghai-Tibet Plateau and its adjacent region; (b) Qinghai-Tibet Block; (c) North section of N-S seismic belt; (d) Middle section of N-S seismic belt; (e) South section of N-S seismic belt. |

|
图 5 水平构造差应力σT-σt随深度分布 (a)青藏高原及其周缘;(b)青藏地块;(c)南北带北段; (d)南北带中段; (e)南北带南段. Fig. 5 Differential horizontal tectonic stress (σT-σt) variation with depth (a) Qinghai-Tibet Plateau and its adjacent region; (b) Qinghai-Tibet Block; (c) North section of N-S seismic belt; (d) Middle section of N-S seismic belt; (e) South section of N-S seismic belt. |
青藏高原及其周缘研究区内水平构造差应力σT-σt在地表为2.5 MPa,随深度增大以7.2 MPa·km-1的梯度增大:

|
(11) |
其他各研究区σT-σt地表值(D=0 km)由高到低排列依次为南北带南段3.3 MPa、南北带北段2.6 MPa、南北带中段2.5 MPa、青藏地块0.5 MPa;随深度变化的梯度值从大到小排列依次是青藏地块15.3 MPa·km-1、南北带北段9.8 MPa·km-1、南北带中段7.0 MPa·km-1、南北带南段5.6 MPa·km-1.
在地壳浅部,差应力σT-σt随深度以恒定的梯度增大,可能是由于岩石的弹性模量、强度随深度增大所致.
4.3 水平构造应力量值特征为评估各活动地块、地震带在测量深度范围内水平构造作用的强弱,取D=1 km时σT2与σT-σt的回归值进行比较,见图 1.各研究区水平构造应力σT、σt随埋深均呈线性增大,D=1 km时σT2的回归值从大到小排列依次是:青藏地块30.1 MPa、南北带北段23.1 MPa、南北带中段18.5 MPa和南北带南段17.6 MPa.各研究区最大水平构造差应力σT-σt随埋深均呈线性增大,D=1 km时的回归值由大到小排列依次是:青藏地块15.8 MPa、南北带北段12.4 MPa、南北带中段9.6 MPa和南北带南段8.9 MPa.
总体来看,印度板块北东向推挤作用使青藏地块的量值明显高于南北地震带的量值,并沿着北东向传递到南北地震带北段,而其向东的传递作用较弱,各地块的GPS观测结果表明(张培震等,2003),青藏地块北东向运动受到东北地块与华北地块阻挡,致使南北地震带北段运动减弱,应力集中,使其构造应力量值仅低于青藏地块而高于南北地震带中段和南段.
4.4 青藏高原构造应力量值特征揭示的成因机制、动力学背景与意义垂直应力σv(单位:MPa)一般按上覆岩体重量估算,即σv=2.7D.由图 4可知各研究区测量深度范围内σT和σt随深度变化量值基本大于σv(其中南北地震带北段只在D<0.92 km范围内满足),即σT>σt>σv,由此可知,影响研究区地应力的最主要因素是水平构造作用.
印度板块对青藏地块的推挤作用向NE传递,受扬子地块和鄂尔多斯地块的阻挡作用,表现出各研究区σT、σt、σT-σt的梯度以及在D=1 km处的量值从大到小的排列顺序都是青藏地块>南北带北段>南北带中段>南北带南段,表明印度板块对研究区的推挤起到主导作用.
本文由实测地应力数据揭示的青藏地块呈现出的“浅弱深强”特点可为深部构造特征提供参考,笔者认为这可能与印度板块小倾角下插到青藏高原下方的俯冲方式有关.
5 主要结论通过近2000条水压致裂与应力解除地应力测量数据,采用实测地应力扣除重力影响的方法,统计分析了青藏高原及其周缘地区及青藏地块、南北地震带各段现今地壳浅部构造应力量值特征.归纳如下:
(1) 青藏高原及其周缘研究区的总体特征如下:σH、σh随埋深均呈线性增大:

|

|
σT、σt随埋深均呈线性增大,估算的量值范围:

|
σT-σt随深度线性增大:

|
(2) 各研究区水平构造应力σT、σt、σT-σt随埋深均呈线性增大.σT和σT-σt的梯度值、D=1 km时σT2和σT-σt的回归值由高到低排列顺序均依次为青藏地块、南北带北段、南北带中段和南北带南段.最大水平构造应力强度、最大水平构造差应力量值均表现出青藏地块最高,南北地震带较低的特征.
(3) 受到印度板块北东方向的强烈碰撞作用控制,青藏地块呈现出明显的“浅弱深强”特点.南北地震带处于中国大陆西部和东部两个一级地应力场分区的结合部位,受到印度板块、太平洋板块、菲律宾板块综合作用,北段的挤压作用强度仅次于青藏板块;中段挤压作用强度弱于北段强于南段;南段的挤压作用强度最弱.
致谢由衷感谢两位匿名审稿专家对本文给予的中肯意见和建议.
| Cai M F. 2000. Principle and Techniques of In-situ Stress Measurement. Beijing: Science Press: 200-270. | |
| Chen S S, Shi R D, Yi G D, et al. 2016. Middle Triassic volcanic rocks in the northern Qiangtang (Central Tibet): Geochronology, Petrogenesis, and Tectonic Implications. Tectonophysics, 666: 90-102. DOI:10.1016/j.tecto.2015.10.017 | |
| Chen S Y, Ma J, Liu P X, et al. 2014. Exploring the current tectonic activity with satellite remote sensing thermal information: A case of the Wenchuan earthquake. Seismology and Geology, 36(3): 775-793. | |
| Chevalier M L, Leloup P H, Replumaz A, et al. 2016. Tectonic-Geomorphology of the Litang fault system, SE Tibetan Plateau, and implication for regional seismic hazard. Tectonophysics, 682: 278-292. DOI:10.1016/j.tecto.2016.05.039 | |
| Deng Q D, Zhang Y M, Xu G L, et al. 1979. On the tectonic stress field in China and its relation to plate movement. Seismology and Geology, 1(1): 11-22. | |
| Ding H X, Hou Q Y, Zhang Z M. 2016. Petrogenesis and tectonic significance of the eocene adakite-like rocks in western Yunnan, southeastern Tibetan Plateau. Lithos, 245: 161-173. DOI:10.1016/j.lithos.2015.09.024 | |
| Eva E, Malusà M G, Solarino S. 2015. A seismotectonic picture of the inner southern western alps based on the analysis of anomalously deep earthquakes. Tectonophysics, 661: 190-199. DOI:10.1016/j.tecto.2015.08.040 | |
| Ge W P, Yuan D Y, Shao Y X, et al. 2015. Regional crustal deformation, tectonic geomorphology and seismogenic tectonic model of the northwestern Tibetan Plateau: case studies of the 2008 and 2014 Yutian (Xinjiang) Ms7.3 earthquakes. China Earthquake Engineering Journal, 37(3): 710-723. | |
| Ge X H. 2010. The origin of the north-south seismic tectonic belt in China.//The Petrological and Geodynamics Conference in 2010 (in Chinese). Beijing, 448-449. | |
| Guo G H, Zhang Z, Cheng J W, et al. 2015. Seismic anisotropy in the crust in northeast margin of Tibetan Palteau and tectonic implication. Chinese J. Geophys., 58(11): 4092-4105. DOI:10.6038/cjg20151117 | |
| Guo H Z, Ma Q C, Xue X C, et al. 1983. The analytical method of the initial stress field for rock masses. Chinese Journal of Geotechnical Engineering, 5(3): 64-75. | |
| Guo X Y, Chen X Z, Wang S W, et al. 2014. Focal mechanism of small and moderate earthquakes and tectonic stress field in Sichuan-Yunan areas. China Earthquake Engineering Journal, 36(3): 599-607. | |
| Guo X Y, Rui G, Xiao X, et al. 2015. Longriba fault zone in eastern Tibet: An important tectonic boundary marking the westernmost edge of the Yangtze block. Tectonics, 34(5): 970-985. DOI:10.1002/2015TC003880 | |
| Hong L. 2016. Numerical simulation on modern tectonic stress field in the northeastern margin of Qinghai-Tibetan Plateau. Earthquake Research in Sichuan(1): 30-37. | |
| Jing F, Sheng Q, Zhang Y H, et al. 2007. Research on distribution rule of shallow crustal geostress in China mainland. Chinese Journal of Rock Mechanics and Engineering, 26(10): 2056-2062. | |
| Jing F, Sheng Q, Zhang Y H, et al. 2008. Statistical analysis of geostress distribution laws for different rocks. Rock and Soil Mechanics, 29(7): 1877-1883. | |
| Kan R J, Zhang S C, Yan F T, et al. 1977. Present tectonic stress field and its relation to the characteristics of recent tectonic activity in Southwestern China. Chinese J. Geophys., 20(2): 96-109. | |
| Kumar A, Mitra S, Suresh G. 2015. Seismotectonics of the eastern Himalayan and Indo-Burman plate boundary systems. Tectonics, 34(11): 2279-2295. DOI:10.1002/2015TC003979 | |
| Li F Q, Qi Y N. 1988. Variation of crustal stresses with depth in China. Chinese Journal of Rock Mechanics and Engineering, 7(4): 301-309. | |
| Li Y H, Wu Q J, An Z H, et al. 2006. The Poisson ratio and crustal structure across the NE Tibetan Plateau determined from receiver functions. Chinese J. Geophys., 49(5): 1359-1368. DOI:10.3321/j.issn:0001-5733.2006.05.015 | |
| Liu M. 2010. Eocene Tibetan Plateau and the current stress field between two study (in Chinese). Beijing: China University of Geosciences (Beijing). | |
| Lu R Q, He D F, Xu X W, et al. 2016. Crustal-scale tectonic wedging in the central Longmen Shan: Constraints on the uplift mechanism in the southeastern margin of the Tibetan Plateau. J. Asian Earth Sci., 117: 73-81. DOI:10.1016/j.jseaes.2015.11.019 | |
| Lu Z W, Gao R, Li Q S, et al. 2006. Deep geophysical probe and geodynamic study on the Qinghai-Tibet Plateau (1958—2004). Chinese J. Geophys., 49(3): 753-770. DOI:10.3321/j.issn:0001-5733.2006.03.019 | |
| Ma R Y, Peng J B, Xi X W, et al. 2004. Mechanism of progressive uplift to Qinghai-Tibet Plateau. Advance in Earth Sciences, 19(S1): 41-45. | |
| Magni V, Allen M B, Van Hunen J, et al. 2016. Numerical models of Indian plate underthrusting after slab break-off: Controls on Himalayan-Tibetan tectonics. EGU General Assembly Conference.Abstracts, 18: 1938. | |
| Mao L G, Xiao A C, Zhang H W, et al. 2016. Structural deformation pattern within the NW Qaidam basin in the Cenozoic era and its tectonic implications. Tectonophysics, 687: 78-93. DOI:10.1016/j.tecto.2016.09.008 | |
| Mi Q. 2015. Numerical simulation of crustal stress field at the southeast margin of the Tibetan Plateau (in Chinese). University of Chinese Academy of Sciences. | |
| Shi F, He H L, Densmore A L, et al. 2016. Active tectonics of the Ganzi-Yushu fault in the Southeastern Tibetan Plateau. Tectonophysics, 676: 112-124. DOI:10.1016/j.tecto.2016.03.036 | |
| Shi Y L, Dong P Y, Zhang H. 2015. One hundred earthquake sequences of Tibetan plateau and dynamics simulation for future trend of seismic activity.//2015 Chinese Earth Science Union Academic Essays (No.11). | |
| Shi Y T. 2014. A preliminary study on the numerical simulation of features of the seismic anisotropy and dielectric anisotropy in the southern section of north-south seismic belt (in Chinese). Beijing: China Earthquake Administration. | |
| Sternai P, Avouac J P, Jolivet L, et al. 2016. On the influence of the asthenospheric flow on the tectonics and topography at a collision-subduction transition zones: Comparison with the eastern Tibetan margin. J. Geodynam., 100: 184-197. DOI:10.1016/j.jog.2016.02.009 | |
| Sun C Q, Yan C H, Wu X P, et al. 2014. The effect of tidal triggering on seismic fault in eastern Tibetan plateau and its neighboring areas. Chinese J. Geophys., 57(7): 2054-2064. DOI:10.6038/cjg20140703 | |
| Tapponnier P, Molnar P. 1977. Active faulting and tectonics in China. J. Geophys. Res. Atmos., 82: 2905-2930. DOI:10.1029/JB082i020p02905 | |
| Wang Y H, Cui X F, Hu X P, et al. 2012. Study on the stress state in upper crust of China mainland based on in-situ stress measurements. Chinese J. Geophys., 55(9): 3016-3027. DOI:10.6038/j.issn.0001-5733.2012.09.020 | |
| Wei X W. 2006. The study of movement of the Qinghai-Tibet Plateau and the current tectonic stress field and its numerical simulation (in Chinese). Beijing: China University of Geosciences (Beijing). | |
| Xiao Z. 2015. Monitoring dynamic variations of underground media by repeating earthquakes and coda wave interferometry-application in the vicinity of Tibet Plateau (in Chinese). Institute of Earthquake Science, China Earthquake Administration. | |
| Xie F R, Cui X F, Zhao J T, et al. 2004. Regional division of the recent tectonic stress field in China and adjacent areas. Chinese J. Geophys., 47(4): 654-662. DOI:10.3321/j.issn:0001-5733.2004.04.016 | |
| Xu J R, Zhao Z X. 2006. Characteristics of the regional stress field and tectonic movement on the Qinghai-Tibet Plateau and in its surrounding areas. Geology in China, 33(2): 275-285. | |
| Xu J R, Zhao Z X. 2016. Extensional seismotectonic motion and its dynamics in the eastern margin of the Tibetan Plateau and its surroundings. Journal of Geology & Geophysics, 5: 234-241. | |
| Xu Z H, Wang S Y, Huang Y R, et al. 1989. The tectonic stress field of Chinese continent deduced from a great number of earthquake. Chinese J. Geophys., 32(6): 636-647. | |
| Xu Z H, Shi Y L. 2003. Lithospheric structure and continental geodynamics. Acta Seismologica Sinica., 25(5): 512-527. | |
| Yang B C, Qiu L. 2009. The Review of in-situ stress of rock mass and its measurement method. Science and Technology Information(6): 59-60:57. | |
| Yang S X, Yao R, Cui X F, et al. 2012. Analysis of the characteristics of measured stress in Chinese mainland and its active blocks and North-South seismic belt. Chinese J. Geophys., 55(12): 4207-4217. DOI:10.6038/j.issn.0001-5733.2012.12.032 | |
| Yang S X. 2013. Study on the distribution characteristics of crustal stress field in Chinese mainland (in Chinese). Beijing: Beijing Jiaotong University. | |
| Yang S X, Huang L Y, Xie F R, et al. 2014. Quantitative analysis of the shallow crustal tectonic stress field in China mainland based on in situ stress data. J. Asian Earth Sci., 85: 154-162. DOI:10.1016/j.jseaes.2014.01.022 | |
| Yao R, Yang S X, Lu Y Z, et al. 2010. Characteristics of tectonic stress in the east of Tibetan Plateau and its neighboring region inferred from in-situ stress measurement.//Xue, Fu R. Rock Stress and Earthquakes. London: CRC Press, 687-693. | |
| Ye Z, Li Q S, Gao R, et al. 2016. Anisotropic regime across northeastern Tibet and its geodynamic implications. Tectonophysics, 671: 1-8. DOI:10.1016/j.tecto.2016.01.011 | |
| Ye Z. 2016. A geodynamic study for the deep structure and plateau growth in northeastern Tibet (in Chinese). Beijing: Chinese Academy of Geological Sciences. | |
| Zang A, Stephansson O. 2010. Stress Field of the Earth's Crust. Netherlands: Springer: 63-65. | |
| Zeng Q. S. 1989. Present state of stress of crust in China. Bulletin of the Geomechanics(1): 197-207. | |
| Zhang D J. 2006. The study on stress and strain analysis of crustal deformation and tectonic activity at the northeast edge of Qinghai-Tibetan (in Chinese). Xi'an: Chang'an University. | |
| Zhang D N, Yuan S Y, Shen Z K. 2007. Numerical simulation of the recent crust movement and the fault activities in Tibetan Plateau. Chinese J. Geophys., 50(1): 153-162. DOI:10.3321/j.issn:0001-5733.2007.01.022 | |
| Zhang H. 2007. Study on characteristics of regional stress field in northeastern margin of the qinghai-tibet plateau based on the focal mechanism solutions of small earthquakes [Master thesis] (in Chinese). Lanzhou: Lanzhou Institute of Seismology. | |
| Zhang P Z, Deng Q D, Zhang G M, et al. 2003. Active tectonic blocks and strong earthquakes in the continent of China. Science in China (Series D), 46(S3): 13-24. | |
| Zhang X L, Jiang Z S, Wang S X, et al. 2004. Recent horizontal movement and seismogenic features of northeastern margin of Qinghai-Tibet block. Journal of Geodesy and Geodynamics, 24(4): 76-81. | |
| Zhang Y L, Li B Y, Zheng D. 2002. A discussion on the boundary and area of the Tibetan Plateau in China. Geophysical Research, 21(1): 1-8. | |
| Zhao D A, Chen Z M, Cai X L, et al. 2007. Analysis of distribution rule of geostress in China. Chinese Journal of Rock Mechanics and Engineering, 26(6): 1265-1271. | |
| Zhao W J, Kumar P, Mechie J, et al. 2011. Tibetan plate overriding the Asian plate in central and northern Tibet. Nat. Geosci., 4(12): 870-873. DOI:10.1038/ngeo1309 | |
| Zheng Y. 2005. Dynamic simulation of lithospheric evolution from the Tibetan Plateau and China mainland (in Chinese). Hefei: University of Science and Technology of China. | |
| Zhu D C, Chung S L, Niu Y. 2016. Recent advances on the tectonic and magmatic evolution of the greater Tibetan Plateau: A special issue in honor of Prof. Guitang Pan. Lithos, 245: 1-6. | |
| Zhu H C, Tao Z Y. 1994. Geostress distributions in different rocks. Acta Seismologic Sinica, 16(1): 49-63. | |
| Zoback M L, Zoback M D, Adams J, et al. 1989. Global patterns of tectonic stress. Nature, 341(6240): 291-298. DOI:10.1038/341291a0 | |
| Zuza A V, Yin A. 2016. Continental deformation accommodated by non-rigid passive bookshelf faulting: An example from the cenozoic tectonic development of northern Tibet. Tectonophysics, 677-678: 227-240. DOI:10.1016/j.tecto.2016.04.007 | |
| 蔡美峰. 2000. 地应力测量原理和技术. 科学出版社: : 200-270. | |
| 陈顺云, 马瑾, 刘培洵, 等. 2014. 利用卫星遥感热场信息探索现今构造活动:以汶川地震为例. 地震地质, 36(3): 775–793. | |
| 邓起东, 张裕明, 许桂林, 等. 1979. 中国构造应力场特征及其与板块运动的关系. 地震地质, 1(1): 11–22. | |
| 葛伟鹏, 袁道阳, 邵延秀, 等. 2015. 青藏高原西北部区域地壳形变、构造地貌与孕震构造模型研究——以2008年与2014年新疆于田7.3级地震为例. 地震工程学报, 37(3): 710–723. | |
| 葛肖虹. 2010. 我国南北地震构造带的由来. // 2010年全国岩石学与地球动力学研讨会论文集. 北京, 448-449. | |
| 郭桂红, 张智, 程建武, 等. 2015. 青藏高原东北缘地壳各向异性的构造含义. 地球物理学报, 58(11): 4092–4105. DOI:10.6038/cjg20151117 | |
| 郭怀志, 马启超, 薛玺成, 等. 1983. 岩体初始应力场的分析方法. 岩土工程学报, 5(3): 64–75. | |
| 郭祥云, 陈学忠, 王生文, 等. 2014. 川滇地区中小地震震源机制解及构造应力场的研究. 地震工程学报, 36(3): 599–607. | |
| 洪磊. 2016. 青藏高原东北缘现代构造应力场数值模拟. 四川地震(1): 30–37. | |
| 景锋, 盛谦, 张勇慧, 等. 2007. 中国大陆浅层地壳实测地应力分布规律研究. 岩石力学与工程学报, 26(10): 2056–2062. DOI:10.3321/j.issn:1000-6915.2007.10.014 | |
| 景锋, 盛谦, 张勇慧, 等. 2008. 不同地质成因岩石地应力分布规律的统计分析. 岩土力学, 29(7): 1877–1883. | |
| 阚荣举, 张四昌, 晏凤桐, 等. 1977. 我国西南地区现代构造应力场与现代构造活动特征的探讨. 地球物理学报, 20(2): 96–109. | |
| 李方全, 祁英男. 1988. 地壳应力随深度的变化规律. 岩石力学与工程学报, 7(4): 301–309. | |
| 李永华, 吴庆举, 安张辉, 等. 2006. 青藏高原东北缘地壳S波速度结构与泊松比及其意义. 地球物理学报, 49(5): 1359–1368. DOI:10.3321/j.issn:0001-5733.2006.05.015 | |
| 刘鸣. 2010. 西藏高原始新世与现今两期应力场的对比研究. 北京: 中国地质大学(北京). | |
| 卢占武, 高锐, 李秋生, 等. 2006. 中国青藏高原深部地球物理探测与地球动力学研究(1958—2004). 地球物理学报, 49(3): 753–770. DOI:10.3321/j.issn:0001-5733.2006.03.019 | |
| 马润勇, 彭建兵, 席先武, 等. 2004. 青藏高原的递进式隆升机制. 地球科学进展, 19(Sl): 41–45. | |
| 米琦. 2015. 青藏高原东南缘地壳应力场特征研究. 北京: 中国科学院大学. | |
| 石耀霖, 董培育, 张怀, 等. 2015. 青藏高原百年大地震序列和未来地震活动趋势的动力学模拟. //2015中国地球科学联合学术年会论文集(十一). | |
| 石玉涛. 2014. 南北地震带南段地震各向异性与介质各向异性特征数值模拟初步研究. 北京: 中国地震局地球物理研究所. | |
| 孙长青, 阎春恒, 吴小平, 等. 2014. 青藏高原东部及邻区地震断层面上的潮汐应力触发效应. 地球物理学报, 57(7): 2054–2064. DOI:10.6038/cjg20140703 | |
| 王艳华, 崔效锋, 胡幸平, 等. 2012. 基于原地应力测量数据的中国大陆地壳上部应力状态研究. 地球物理学报, 55(9): 3016–3027. DOI:10.6038/j.issn.0001-5733.2012.09.020 | |
| 尉晓玮. 2006. 青藏高原运动与现今构造应力场研究及数值模拟. 北京: 中国地质大学(北京). 82. | |
| 肖卓. 2015. 利用重复地震和尾波干涉技术监测地壳介质动态变化——以青藏高原周缘为例. 北京: 中国地震局地震预测研究所. | |
| 谢富仁, 崔效锋, 赵建涛, 等. 2004. 中国大陆及邻区现代构造应力场分区. 地球物理学报, 47(4): 654–662. DOI:10.3321/j.issn:0001-5733.2004.04.016 | |
| 徐纪人, 赵志新. 2006. 青藏高原及其周围地区区域应力场与构造运动特征. 中国地质, 33(2): 275–285. | |
| 许忠淮, 汪素云, 黄雨蕊, 等. 1989. 由大量的地震资料推断的我国大陆构造应力场. 地球物理学报, 32(6): 636–647. | |
| 许忠淮, 石耀霖. 2003. 岩石圈结构与大陆动力学. 地震学报, 25(5): 512–527. | |
| 杨保存, 邱林. 2009. 岩体地应力及其测量方法综述. 科技信息(6): 59–60, 57. | |
| 杨树新, 姚瑞, 崔效锋, 等. 2012. 中国大陆与各活动地块、南北地震带实测应力特征分析. 地球物理学报, 55(12): 4207–4217. DOI:10.6038/j.issn.0001-5733.2012.12.032 | |
| 杨树新. 2013. 中国陆域地壳应力场分布特征研究. 北京: 北京交通大学. | |
| 叶卓. 2016. 青藏高原东北缘深部结构及高原扩展之地球动力学研究. 北京: 中国地质科学院. | |
| 曾秋生. 1989. 中国现今地壳应力状态. 地质力学学报(1): 197–207. | |
| 张冬菊. 2006. 青藏东北缘地壳形变应力应变场分析与构造活动性研究. 西安: 长安大学. | |
| 张东宁, 袁松涌, 沈正康. 2007. 青藏高原现代地壳运动与活动断裂带关系的模拟实验. 地球物理学报, 50(1): 153–162. DOI:10.3321/j.issn:0001-5733.2007.01.022 | |
| 张辉. 2007. 青藏高原东北缘基于小震震源机制解的区域应力场特征研究. 兰州: 中国地震局兰州地震研究所. | |
| 张培震, 邓起东, 张国民, 等. 2003. 中国大陆的强震活动与活动地块. 中国科学:地球科学, 33(S1): 12–20. | |
| 张晓亮, 江在森, 王双绪, 等. 2004. 青藏块体东北缘地壳运动与孕震特征. 大地测量与地球动力学, 24(4): 76–81. | |
| 张镱锂, 李炳元, 郑度. 2002. 论青藏高原范围与面积. 地理研究, 21(1): 1–8. | |
| 赵德安, 陈志敏, 蔡小林, 等. 2007. 中国地应力场分布规律统计分析. 岩石力学与工程学报, 26(6): 1265–1271. | |
| 郑勇. 2005. 青藏高原及中国地区大陆地壳岩石层变形演化动力学数值模拟. 合肥: 中国科学技术大学. | |
| 朱焕春, 陶振宇. 1994. 不同岩石中地应力分布. 地震学报, 16(1): 49–63. | |