2. 中国科学院南海海洋研究所边缘海与大洋地质重点实验室, 广州 510301;
3. 雅砻江流域水电开发有限公司, 成都 610051
2. Key Laboratory of Ocean Marginal Sea Geology, South China Sea Institute of Oceanology, Chinese Academy of Sciences, Guangzhou 510301, China;
3. Yalong River Hydropower Development Company, Ltd., Chengdu 610051, China
印度板块和欧亚板块的内陆碰撞与汇聚,不仅导致青藏高原的隆升以及地壳的增厚,还将青藏高原范围内的物质整体向东南挤出,并在青藏高原的东缘形成了具有复杂的断裂系统、褶皱系统以及较高地震活动性的复杂构造带——南北地震带(图 1).在过去的几十年内,南北地震带范围内共计发生了十余次7级或7级以上的强震,造成了极为严重的、大范围的破坏作用.继1976年7.2级松潘-平武地震(SP)发生在龙门山断裂带附近的虎牙断裂后,2008年5月12日发生了灾难性的8.0级汶川地震(WC),其震中位于南北地震带中北部龙门山断裂带的中心区域,导致近90000人死亡.然而,在时隔不到5年和相距不到90 km的龙门山断裂带的南端又发生了7.0级芦山地震(LS).大量研究认为这两个强震可能与龙门山断裂带的逆冲结构及强烈的地壳形变有关,该断裂带是松潘-甘孜地块与四川前陆盆地发生强烈倾斜碰撞而产生剧烈造山运动的位置.另一方面,位于青藏高原东缘的鲜水河断裂带也是地震活跃的区域,如1955年7.4级炉霍地震(LH)和1973年7.1级康定地震(KD)均发生在该断裂上.同时,位于南北地震带南部区域的哀牢山-红河断裂带也是地震多发区域之一,如1970年7.1级通海地震(TH)就发生在该断裂带附近的曲江断裂上.综上所述,多个大地震发生在南北地震带上绝对不是偶然,这可能与南北地震带复杂的地质构造,如地壳形变、岩石温度与富含流体等因素密切相关(邓起东等,2003).为探明南北地震带的强震触发机制及孕震机理与地质构造和地壳形变的关系,我们通过长期的数据收集与数据处理,采用多参数联合反演的方法,得出了南北地震带地壳高分辨率的三维结构,为我们探讨和分析该区域的地壳形变,盆山耦合以及地震产生奠定了基础.

|
图 1 研究区域南北地震带的地形构造图 五角星和圆分别代表在1955年至2016年期间发生在南北地震带区域震级在7.0~7.5级和7.5级以上的地震.黑色实线表示研究区域的活动断层,黑色粗实线表示主要的板块边界(Deng et al., 2007).研究区域所在的位置如左上角图中矩形框所示.其中,SG代表松潘-甘孜块体,CD代表川滇块体,SB代表四川盆地,YC代表扬子克拉通板块. Fig. 1 Schematic illustration of topography and tectonics of North-South Seismic Zone Stars and circles stand for large earthquakes with magnitude greater than M7.0 and M7.5, respectively, since 1955. Black solid lines show active faults of the research area. Bold black solid lines indicate the main tectonic boundaries [Deng et al., 2007]. A square in the subplot in the left top corner shows the study region. SG, Songpan-Garzê Block; CD, Chuandian Block; SB, Sichuan Basin; YC, Yangtze Craton. |
近年来,地震台网的快速发展为我们能够通过地震层析成像获得南北地震带地壳精细结构提供了保障.自2000年以来,许多地球物理学家对南北地震带岩石圈及深部结构进行了层析成像反演,包括人工地震测深(Wang et al., 2007, Wang et al., 2009a; Liu et al., 2006)、近震及远震P波成像(Wang et al., 2003; Huang and Zhao, 2006; Wang et al., 2010; 吴建平等,2013)、接收函数(李永华等,2009;Xu et al., 2013; 郑晨等,2016)、Pn波成像(Liang and Song, 2006; 李飞等, 2011)、面波成像(黄忠贤等,2013; Li et al., 2014; 王琼等,2015)、背景噪声(Yao et al., 2006, 2008; Yang et al., 2010)以及SKS各向异性(常利军等,2006; 王琼等,2013),这些方法在南北地震带的成功运用,取得很多共识的同时也还有一些具有争论的科学问题有待进一步研究.本研究采用高密度的精细网格模型,对来自545个密集台站的大量P波与S波走时数据进行体波反演,获得了南北地震带地壳的三维精细结构,结合前人在地质学、大地构造等方面的研究成果(张家声等,2003; 汪一鹏等,2007; 王琼等,2014; 王椿镛等,2015; 徐小明等,2015),为研究和揭示该区域的强震触发机制和孕震机理与深部构造及地壳形变的内在联系提供了重要依据.
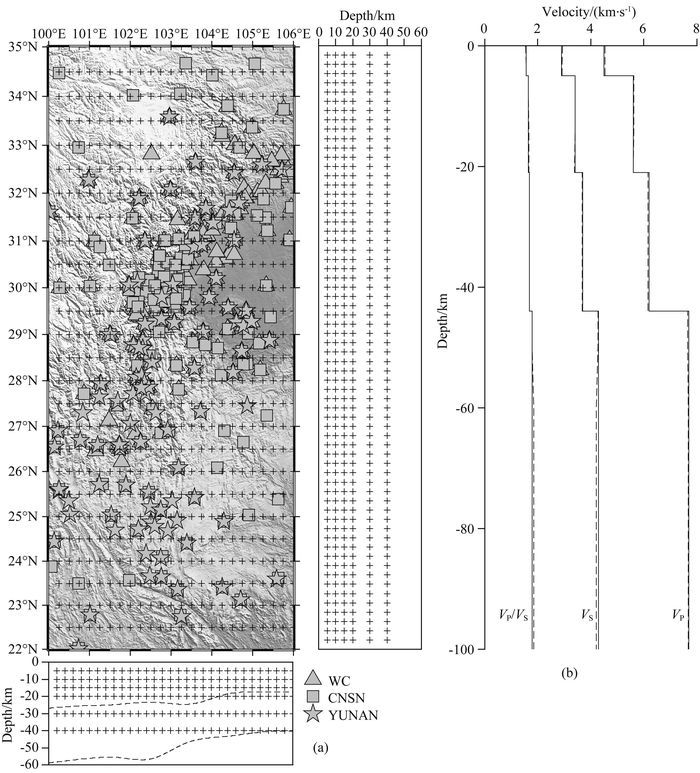
2 数据和方法为了获得南北地震带地壳的高分辨率速度结构,反演的综合数据集包括了在本研究区域(100°E—106°E,22°N—35°N)大量高质量的P波与S波走时数据.其中,综合数据集涉及的台站包括220个由四川地震局、云南地震局及中国地震局地球物理研究所(IGCEA)提供的固定台站,以及汶川和芦山地震后由四川地震局与项目组布置的85个临时台站.此外,综合数据集涉及的台站还包括中国国家测震台网(CNSN)分布在南北地震带范围内的240个台站,本研究采用的地震数据为发生在1999年11月至2016年1月范围内的震相数据.经过台站去重,总计545个台站信息被确定用于反演,台站分布如图 2a所示.
|
图 2 反演中所使用的台站、三维网格模型以及一维速度模型 (a)虚线表示康纳德面和莫霍面(Laske et al., 2013).三种灰色的图形表示研究区域内的台站分布,黑色十字符号表示反演的网格点; (b)虚线表示一维初始速度模型,实线表示反演得到的一维速度模型. Fig. 2 Distributions of seismic stations, 3-D grid models and 1-D initial velocity model in the inversion (a) Solid dashed lines represent Conrad and Moho (Laske et al., 2013). Three kinds of gray shapes represent seismic stations. Black crosses indicategrid nodes; (b) Dashed lines depict 1-D initial velocity model, while the solid ones show those inverted 1-D velocity model from combined dataset. |
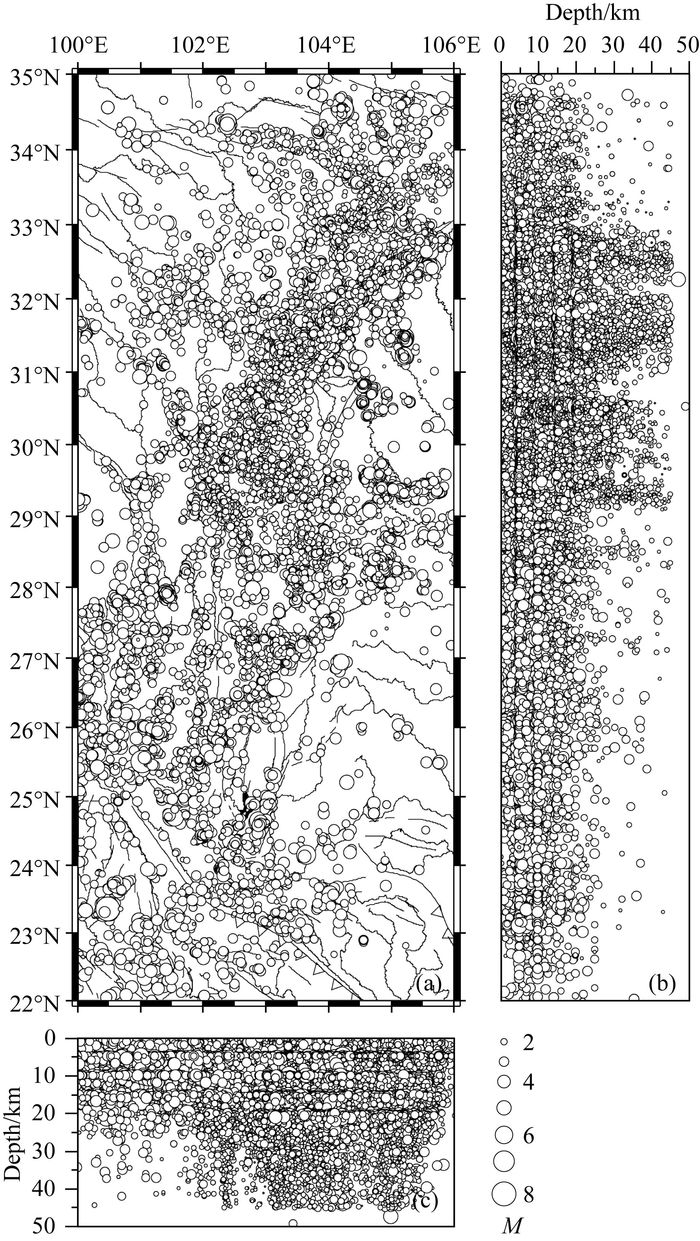
反演中实际使用的数据是在综合数据集的基础上经过严格筛选得到的.图 3给出了筛选后反演所涉及的地震事件在空间上的分布,其主要的筛选条件包括:(1) 对于综合数据集中包含数据或台站较少、台站分布较稀疏的子数据集,我们挑选被8个或8个以上台站记录的地震事件;(2) 对于那些包含数据及台站较多、台站分布较密集的子数据集,我们挑选被10个或10个以上台站记录的地震事件;(3) 所有地震的震级大于或等于2.0级.筛选后的地震总共包括57822条地震事件的808754条P波走时和766935条S波走时数据,地震事件分布如图 3所示.从图 3中可以看出,南北地震带区域震源深度大于25 km的地震几乎全部发生在龙门山断裂带,这与下地壳形变对龙门山断裂带的作用有着紧密联系.为了进一步保证数据的质量, 我们在反演过程中利用双差定位法对地震事件进行了重新定位(Waldhauser and Ellsworth, 2000; Wang and Zhao, 2006).而对于那些未被双差重新定位流程处理的地震,都通过传统的定位流程进行了定位处理(Zhao et al., 1996).
|
图 3 研究区域的地震分布图 白色的圈表示发生在研究区域内的地震分布,细线表示研究区域的断层.震级大小如右下角所示. Fig. 3 The earthquake distribution in the study area White opened circles denote earthquakes occurred in the study area, the black lines indicate the faults of the study area. Magnitude scale of the earthquakes is shown on lower right of the map. |
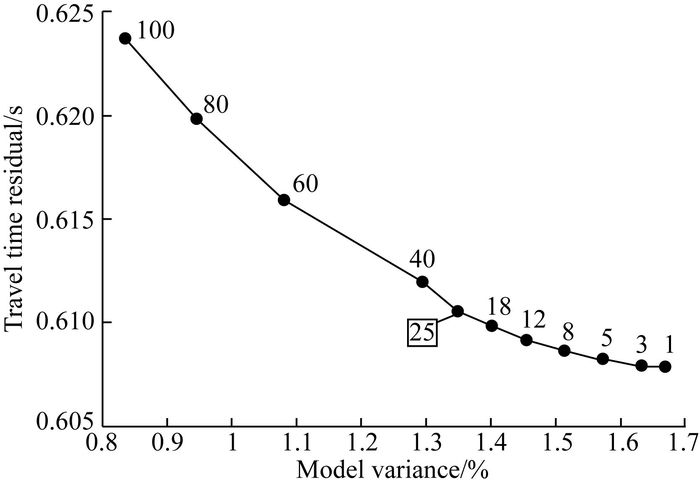
如图 2b所示,反演采用的一维初始速度模型参考了前人接收函数和地震层析成像研究结果(Xu et al., 2007; Wang et al., 2009a, 2010, 江为为等,2014),不仅考虑了不同深度的地层厚度的横向不均匀性,而且也考虑了地壳与地幔之间的速度不连续面——莫霍面的深度变化(图 2b).考虑到台站密度、数据密度以及射线覆盖密度对成像分辨率的影响,本研究选取的网格模型在经度方向上的水平间距为0.25°,在纬度方向上的水平间距为0.5°,垂向间距为5~10 km.本次层析成像反演计算采用了LSQR算法(Paige and Saunders, 1982), 阻尼因子的选择影响着结果的可靠性,最佳的LSQR反演结果能够使模型方差和数据走时残差方差最小,反演计算时,选取不同的阻尼因子会让反演后的模型方差与数据走时残差方差呈现此消彼长的变化.那么,要得到最佳的反演结果,就要选取合适的阻尼因子,往往通过模型方差和数据走时残差方差的折衷曲线来确定.图 4给出了本次反演的模型方差和数据走时残差方差的折衷曲线,根据该曲线,最后确定25是最为理想的阻尼因子.
|
图 4 阻尼因子折衷曲线 数字为阻尼因子值,25是最终选取的阻尼因子. Fig. 4 The tradeoff curve for the damping factor The numbers indicate the damping factors,and we select 25 as final damping factor. |
本研究采用了Zhao等(1992, 1996)提出的反演方法进行三维层析成像.相比于前人提出的反演方法(Jacob, 1970; Wesson, 1971; Julian and Gubbins, 1977; Pereyra et al., 1980),该方法主要基于LSQR算法(Paige and Saunders, 1982),通过将伪弯曲法(Thurber, 1983; Um and Thurber, 1987)与斯奈尔定律相结合,进而在很大程度上提升了三维射线追踪的精度,能够大大减小康纳德面、莫霍面等速度不连续面带来的误差,并具有良好的算法效率.基于以上初始模型及反演方法、我们对经过筛选的综合数据集进行反演,得到了分辨率较高的P波与S波速度结构,又在此基础上进一步计算得到了研究区域内的泊松比结构.
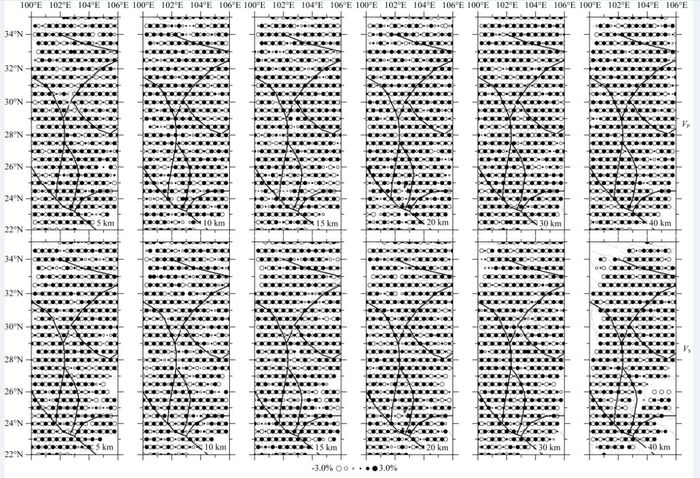
3 分辨率测试为保证反演图像中所展示的地壳三维结构的真实性和可靠性,在进行三维层析成像反演之前,我们进行了分辨率测试, 该方法是检测地震层析成像反演结果的可靠性和真实性的有效方法之一.在本研究中,我们分别针对P波和S波反演进行了棋盘分辨率测试(CRTs).棋盘分辨率测试采用的台站数、事件数、网格模型及射线路径都与实际反演的数据保持一致,以保证反演过程中各个参数设置的准确性.棋盘分辨率测试采用了与反演相同的网格,即在经度方向上的水平间距为0.25°,在纬度方向上的水平间距为0.5°,垂向间距为5~10 km.棋盘分辨率测试的结果如图 6所示,在南北地震带范围内,VP和VS绝大部分地区具有较高的分辨率,虽然有些地方的分辨率不高,这是由于台站和地震的分布引起的,但是这并不影响反演结果中所展示的地壳结构的真实性和可靠性(图 6).此外,我们得到了P波和S波的射线路径(图 5),发现射线在主要反演区域内覆盖良好,能够充分呈现出反演区域内的速度结构信息.以上表明,此次研究所使用的数据以及相关参数能够充分体现出南北地震带区域的速度异常.

|
图 5 纵波和横波的三维射线分布图白色矩形代表地震台站. Fig. 5 Distributions of ray-paths of P and S waves White squares indicate seismic stations. |
|
图 6 不同深度棋盘分辨率测试(CRTs)平面图.其中,在经度方向上的水平间距为0.25°,在纬度方向上的水平间距为0.5°.黑色细线实线代表研究区域的断层,黑色粗线代表板块边界 Fig. 6 Results of Checkboard Resolution Tests (CRTs). The grid spacing is 0.25° in longitudinal direction and that of 0.5° in latitude. Black solid lines show the faults and bold black solid lines indicate the main tectonic boundaries |
图 7给出了地壳P波、S波速度和泊松比参数在不同深度的水平切片.在上地壳0~15 km深度,高速异常主要分布在龙门山断裂带、松潘—甘孜地块,以及川滇菱形块体,而低速异常主要集中在四川前陆盆地,龙门山断裂带南北两侧形成了极其明显的速度异常差异.综合来看,四川前陆盆地在上地壳范围内表现出低速,高泊松比异常.与之相反的是,松潘—甘孜地块和川滇菱形地块表现出高速,低泊松比异常.我们认为,四川前陆盆地所表现出的低速,高泊松比异常特征与该区域存在的三叠纪到晚白垩纪堆积的沉积物及其高孔隙度有关,其厚度在局部可以达到10 km以上.而川滇菱形块体内分布的大范围高速、低泊松比异常是由来自青藏高原的富含铁镁成分的下地壳流不断挤压所造成的.地壳内部大量幔源物质的侵入大大增强了地壳介质的力学强度,并形成以攀枝花(101.8°E,26.05°N)为核心的坚硬块体,阻碍了青藏高原物质向南的运移,从而导致了北部地形的快速上升(吴建平等,2013).在0~20 km的中上地壳,哀牢山—红河断裂带表现为高速度、低泊松比异常,并且在该异常的东、西两侧均为低速度、高泊松比异常,形成明显的速度差异.这种特征与沿着衰老山—红河断裂带发育的变质岩有关.该区域存在长约900 km、宽10至20 km的变质岩带,由强变质的片麻岩和弱变质的片岩组成,起因于第三纪时期哀牢山—红河断裂带的左旋剪切作用(胥颐等,2013).在中下地壳20~40 km深度,龙门山断裂带、松潘—甘孜地块和川滇菱形地块在浅部所表现出的高速异常特征,逐渐被大范围、连续的低速异常特征所取代.其中,松潘甘孜地块西部靠近鲜水河断裂带附近的位置发现强烈的低速、高泊松比异常.前期相关大地电磁研究(Huang et al., 2009, Bai et al., 2010; Wang et al., 2012, 2015)表明,该位置表现出的低速、高泊松比异常与高电导率异常的分布一致.这样的低速、高泊松比、高电导率特征与存在流体的特征极为相似,意味着下地壳物质发生了流变,暗示下地壳流体的存在,相似的速度结构和泊松比结构也存在于40 km处.在龙门山地区,在反演图像中出现了一个“Y”字形的低速、高泊松比异常区域,该异常体在空间上与鲜水河断裂、龙门山断裂及安宁河断裂组成的Y形断裂系统相似,只是在位置上略微有所偏离.前人关于龙门山断裂带区域的上地壳的研究也得到了类似的深部结构特征(Huang et al., 2002; Wang et al., 2003; Lei and Zhao, 2009; Xu et al., 2010; Pei et al., 2010, Wang et al., 2010, 2011).从本研究得到的结果中整体来看,在南北断裂带范围内,下地壳中的强烈低速、高泊松比异常在空间上与东昆仑南缘断裂、鲜水河断裂、哀牢山—红河断裂以及龙门山断裂组成的主要断裂系统在空间上具有相似的几何特征.中下地壳中的高速、低泊松比异常集中在四川盆地范围内,以及小江断裂带东侧,我们认为这些异常特征与深部古老而稳定的扬子克拉通有关.同时在下地壳的鲜水河断裂带右侧,呈现出明显的低速、高泊松比异常,而在四川盆地呈现的高速、低泊松比异常区域停止,是地壳流体受到克拉通阻碍的有力证据.

|
图 7 速度和泊松比图像水平切片 (a) P波速度结构;(b)S波速度结构;(c)泊松比结构.图中红色实线代表了龙门山断裂的前山断裂、中央主断裂和后山断裂,白色粗线代表板块边界.白色的圈代表相应层上下5 km范围内的地震,紫色和绿色五角星表示南北地震带发生的主要强震.图中红色代表低速度和高泊松比异常,蓝色代表高速度低泊松比异常.地震震级标度、速度和泊松比扰动色标在图下方.其中,SG代表松潘—甘孜块体,CD代表川滇块体,SB代表四川盆地,YC代表扬子克拉通板块. Fig. 7 Plan views of seismic velocity and Poisson′s ratio perturbations (a) P-wave velocity; (b) S-wave velocity; (c) Poisson′s ratio perturbations. Red solid lines indicate the fore fault, central fault and rear fault along the Longmenshan fault, bold white solid lines indicate the main tectonic boundaries. Violet and green stars show the main large earthquakes in this region. White dots show the locations of earthquakes with 5 km thickness bound to each depth. Velocity perturbation and magnitude scales for large crustal earthquakes are shown in the bottom of the map. SG, Songpan-Garzê Block; CD, Chuandian Block; SB, Sichuan Basin; YC, Yangtze Craton. |
前人大量的研究表明,在青藏高原的中下地壳存在大范围的流体,在印度板块与欧亚板块的汇聚和挤压下发生向东的大规模运移,形成下地壳流或管道流(Royden et al., 1997; Bai et al., 2010; Wang et al., 2010, 2011, 2012; Wei et al., 2001).然而,反演结果显示,四川盆地深部表现为高速、低泊松比异常,反映了在四川盆地下方存在古老的、坚硬的岩石块体,并向西斜向挤入到龙门山断裂带下方.它的存在阻挡了下地壳流体继续向东发展,并将下地壳的流体分为两个部分.一部分来自下地壳的流体连同软流圈中的流体因受到挤压作用流入龙门山断裂带地壳的脆弱区域(Hubbard and Shaw, 2009; Wang et al., 2015).地壳中流体持续侵入导致岩石中流体应力的持续上升,进而抬升了青藏高原东南缘的地壳并使地形变得陡峭(Royden et al., 2008; Hubbard and Shaw, 2009; Wang et al., 2010, 2011, 2015).而剩余部分的流体则分别向东北方向、东南方向逃逸,分别对应东昆仑南缘断裂与鲜水河断裂以及小江断裂下方的低速、高泊松比异常.其中,向东南逃逸的流体受到坚硬的川滇菱形块体的阻挡,导致川滇菱形块体北部次级地块快速抬升.同时,由于印度板块向北运动的同时产生了向东挤压的分量,其岩石圈向缅甸板块下方俯冲并一直向南北地震带南段下方延伸,并推动川滇菱形地块向东快速滑移.然而,位于其南段中下地壳的高速、低泊松比、高力学强度块体阻碍了川滇菱形块体向南滑移,并在中上地壳低速、高泊松比异常区域产生了较大的形变,导致曲江—石屏断裂带在以走滑为主的同时兼具挤压逆冲的特征(吴建平等,2013).在图 8的A1B1剖面中可以清楚地看到在汶川地震和芦山地震中间存在一个地震空区(高原等,2013),这个地震空区表现为低速度、高泊松比异常,并且一直延伸到中、下地壳,我们认为此异常区域是由中下地壳向上挤压的流体,这种流体的物理特性正好阻碍了地震的发生.

|
图 8 芦山震源、汶川震源和松潘一平武震源范围15 km深度位置的地震成像和沿A1B1、A2B2、A3B3、A4B4的垂直剖面.LS表示芦山地震,WC表示汶川地震,SP表示松潘一平武地震.黑色实线代表活动断层.地表起伏在剖面的最顶部用灰色部分表示,上下两条黑色的虚线分别表示康纳德面和莫霍面,该数据来源于cmstl.O模型(Laske and Master, 1997).黑色的点代表沿着剖面2.5 km以内的地震.SG指松潘甘孜地块,CD指川滇地块,SB指四川盆地.XSHF指鲜水河断裂带,LMSF指龙门山断裂带,HYF指虎牙断裂 Fig. 8 Seismic image in the source areas of the Lushan, Wenchuan and Songpan-Pingwu earthquakes at the depths of 15km and vertical cross sections along the lines A1B1, A2B2, A3B3 and A4B4. LS, Lushan earthquake; WC, Wenchuan earthquake; SP, Songpan-Pingwu earthquake. Black solid lines show other active faults. The surface topography is shown on the top of each profile, and two black dashed lines in each section indicate Conrad surface and Moho surface that are derived from model 1.0 (Laske and Master, 1997). Black dots exhibit the earthquake that occurred within a 2.5 km-wide band along each profile. SG, Songpan-Garzě Block; CD, Chuandian Block; SB, Sichuan Basin. XSHF, Xianshuihe fault; LMSF, Longmenshan fault; HYF, Huya fault |
研究表明,地壳形变对强震的触发具有极其重要的贡献.图 8给出了南北地震带中北部龙门山地区的四条深度剖面.最近几年发生的2008年汶川8.0级特大地震和2013年芦山7.0级地震,与发生在1976年的7.2级松潘—平武地震在空间上几乎位于一条直线上.剖面A1B1穿过上述三个地震的震中,剖面A2B2、A3B3以及A4B4由南至北分别穿过芦山地震、汶川地震、松潘—平武地震的震中,并垂直于剖面A1B1.四个剖面的结果都显示,汶川地震、芦山地震以及松潘—平武地震均发生在高速度、低泊松比的块体内部.此外,大地电磁资料也显示,这些高速度、低泊松比块体同时具有较低的电导率,说明这些区域由坚硬的岩石组成,其岩石力学强度明显高于周边孕震层.在这些高速度、低泊松比区域下方中下地壳均分布着低速度、高泊松比异常,暗示这些强震的孕震区域下方存在大范围的流体,与前文中水平切片显示的结果一致.此外,从剖面A1B1,A2B2以及A3B3中可以看到在汶川地震和芦山地震中间存在着从莫霍面到康纳德面一直延伸到地表的一股低速度、高泊松比物质,与前人研究中提出的高电导分布区域一致(王绪本等,2009; Bai et al., 2010;Wang et al., 2014),这可能直接说明了龙门山断裂带的低速、高泊松比异常与下地壳流的侵入有关(刘静等,2008; 李勇等,2009; 刘启元等,2006; Wang et al., 2015).此外地球物理模拟表明,松潘—甘孜地块中地壳上部温度为700~800 ℃,下地壳的温度为1000 ℃.岩石物理学实验已经证明,这个温度虽然不能使干燥岩石发生完全的熔融,但却足以使含流体的岩石发生熔融或部分熔融(Hacker et al., 2000; Mechie et al., 2004; Jiménez-Munt et al., 2008).再者,龙门山断裂带范围内观测到了强热流,幅度为75 mW·m-2 (Rui et al., 1999; Pollack and Hockensmith, 1992),远高于全球范围内大陆地壳的平均地表热流值65 mW·m-2(汪集暘等, 2001).一般情况下,地壳中热量的流动都是伴随着流体的运移.温度与热流的分布情况也进一步证明了龙门山断裂带的低速、高泊松比异常与下地壳的流体侵入有关.1976年发生的松潘—平武地震与虎牙断裂的活动是密切相关的(唐荣昌和陆联康等,1981),并且从剖面A4B4可以看出,松潘—平武地震依然发生在高速度、低泊松比区域,可以推断造成此次地震的发生也可能是由流体侵入岩石导致的破裂所触发的.从强震发生的年代来看,强震似乎是在向着西南方向移动,这可能与龙门山断裂带南北方向的高速体对流体的阻挡作用有关,进而控制了强震在空间上的分布.
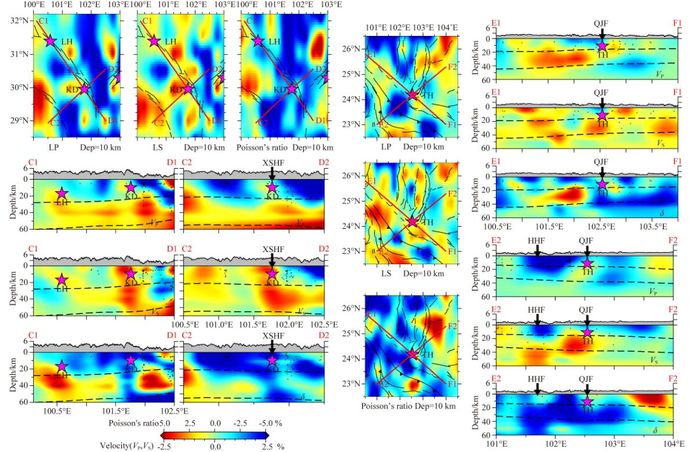
4.3 流体对强震触发的作用南北地震带是青藏高原下地壳流体活动的重要通道,下地壳分布着的大量流体对强震的触发同样具有较大的影响.在断层面上,坚硬的岩石之间具有强烈的耦合,例如龙门山断裂中间段和东北段,在汶川地震之前可能是耦合的.然而,流体的侵入能够在很大程度上弱化坚硬岩石之间的耦合,使其呈现出弱耦合的特征或发生解耦,例如龙门山断裂带西南段.流体侵入进而触发地震的主要因素有两个:(1) 侵入断裂带的流体就像扮演润滑剂的角色,能够显著地减小断层面之间摩擦力的同时增加剪切应力;(2) 流体还能够增加岩石的泊松比,使岩石骨架的岩石力学强度显著降低,进而更容易发生破裂.图 8给出的四个剖面显示,汶川地震、芦山地震和松潘—平武地震都发生在高速、低泊松比区域内,并且在上述三个地震的孕震区域下方都分布着大范围的低速度、高泊松比异常,暗示流体的存在或侵入.下地壳流的流体侵入到龙门山断裂带地壳孕震层,增加剪切应力的同时削弱了断层面之间的摩擦力以及岩石的岩石力学强度,进而触发了强震.根据本研究得到的层析成像结果,发生在1955年的康定地震是一个典型的由流体触发的地震,其震中位于鲜水河断裂.与上述发生的汶川地震、芦山地震和松潘—平武地震三个地震的震源区域有所不同的是,水平切片显示康定震源区域呈现出低速、低泊松比异常,区域东侧呈现高速、低泊松比异常,这与1995年日本神户地震的震源区域具有极为相似的速度和泊松比环境(Zhao et al., 1996).为了更好地展示震源区域的速度结构和泊松比变化情况,我们设置了两条深度剖面(如图 9):剖面C1D1沿鲜水河断裂方向穿过康定地震震中,剖面C2D2与其有一定夹角且同样穿过康定地震震中.剖面C1D1的结果显示,康定地震震源区域及其下方存在条状的低速、高泊松比异常.而邻近的孕震区域则表现出高速、低泊松比的特征,这表明周围是稳定的块体.我们认为,深部的低速、高泊松比异常代表下地壳流体存在,康定地震震源区域及其下方的柱状低速、高泊松比异常表示流体从下地壳沿鲜水河断裂上涌.条状低速、高泊松比异常可能暗示着中下地壳中沿鲜水河断裂带方向存在发育的变质岩.从空间结构上看,该变质岩的间隙为下地壳流流体的上涌提供了通道.康定地震震源周边浅部的P波低速异常、S波低速异常以及低泊松比的特征,暗示大量的流体侵入了岩石骨架使其达到饱和或邻近饱和的状态,形成了由易破裂的脆性岩石组成的孕震区.同样的情况也出现在剖面C2D2的结构中.在剖面的西南侧,浅部的P波低速异常与S波低速、低泊松比异常以及地震序列相对应,表明这非常有可能是一个由含水、脆性岩石组成的孕震区.不同的是,位于剖面C2D2东北段浅部的高速异常表现出低泊松比特征,表明该块体具有较高的岩石力学强度.以鲜水河断裂为分界,康定地震震源区域两侧岩石呈现出截然不同的刚性(脆性).而1973年发生的炉霍地震同样是发生在鲜水河断裂带上.在时间序列上,炉霍地震发生在康定地震之后的第18年.从剖面C1D1可以看出在康定地震的震源区同样表现出低速度、低泊松比异常,这与康定地震的震源区所表现的异常相似.在空间上,上涌的流体所产生的高泊松比异常在上地壳沿水平方向延伸(张超等,1986; 李忠东等,2016).由此推断,炉霍地震可能是流体上涌至康定地震震源区域的上地壳后在水平方向上扩散,并在炉霍地震震源区域内积累,进而再次以几乎同样的机制引起断层面的错动,进而触发附近地区的强震.
|
图 9 炉霍震源和康定震源范围10 km深度位置的地震成像,沿C1D1、C2D2的垂直剖面和通海震源范围10 km深度位置的地震成像,沿E1F1、E2F2的垂直剖面.KD表示康定地震,LH表示炉霍地震,XSHF指鲜水河断裂带,TH表示通海地震,HHF指哀牢山一红河断裂;QJF指曲江断裂.黑色实线代表活动断层.地表起伏在剖面的最顶部用灰色部分表示,上下两条黑色的虚线分别表示康纳德面和莫霍面,黑色的点代表沿着剖面2.5 km以内的地震 Fig. 9 Seismic images in the source areas of Luhuo and Kangding earthquake at the depths of 10 km and vertical cross sections along the lines C1D1 and C2D2. Seismic image in the source areas of Tonghai earthquake at the depths of 10 km and vertical cross sections along the lines E1F1 and E2F2. KD, Kangding earthquake; LH, Luhuo earthquake; XSHF, Xianshuihe fault; TH, Tonghai earthquake; HHF, Ailaoshan-Honghe fault; QJF, Qujiang fault. Black solid lines show active faults. The surface topography is shown on the top of each profile, and two black dashed lines in each section indicate Conrad surface and Moho surface. Black dots exhibit the earthquake that occurred within a 2.5 km-wide band along each profile |
位于南北地震带的安宁河断裂带,小江断裂带以及哀牢山—红河断裂带等一系列断裂带,也是南北地震带地震发生的主要区域之一.1970年1月5日发生的7.1级通海大地震,震源深度为11.3 km,位于哀牢山—红河断裂带附近的曲江断裂带上.从图 9中的剖面E1F1以及剖面E2F2可以看出,地震发生在高速、低泊松比与低速度、高泊松比之间,在震源上方表现为高速度、低泊松比异常,震源右下方表现为低速度、高泊松比.这些局部高速异常体的存在可能起到了障碍体的作用,有利于应变能的积累.在高低速异常体边缘区域介于脆性与韧性之间,当能量积累到一定程度后易发生脆性破裂(陈立军等,2000; 吴建平等,2013).从图 9中可以看出,来自西北方向和东南方向的低速度高泊松比流体向曲江断裂带挤压,使曲江断裂带上应变能的积累,最终发生脆性破裂,从而导致了通海地震.
5 结论本研究通过反演大量高质量的P波、S波地震数据,对南北地震带岩石圈结构进行了层析成像,获得了南北地震带岩石圈的精细结构,我们首次对发生在南北地震带不同年代的大地震的产生机制进行了剖析和比较.结果表明,地壳强烈变形和地壳中流体侵入到断裂带中对南北地震带的高地震活动性以及强震频发起到了关键性的作用.一方面,四川盆地以及川滇块体的坚硬岩石圈对来自青藏高原的下地壳流形成了障碍.在其影响下,流体流入地壳中使岩石中的流体压力持续增加,导致地壳发生剧烈的形变,进而触发地震.最近几年发生的汶川地震和芦山地震,以及1976年松潘—平武地震都是典型的例子.另一方面,流体的侵入降低了断层面之间的摩擦力,通过改变应力的状态使其发生错动.同时又使岩石的岩石力学强度发生大幅度衰减,使其脆性增加并且容易发生破裂,进而触发强震.发生在1955年的康定地震以及1973年的炉霍地震是流体触发地震的典型实例.而1970年发生的通海地震是流体的挤压导致应变能的积累,最后发生脆性破裂产生地震.这一系列的强震说明了南北地震带范围内大型断裂系统为下地壳中广泛存在的流体提供了良好的运移通道,这也证实了在青藏高原东南缘的中下地壳存在大面积的流体活动.同时,下地壳中古老而稳定的扬子克拉通结构在某种程度上也将流体“引入”地壳,下地壳流体与各个块体之间的相互作用导致了南北地震带地震的频繁发生.
致谢感谢四川省地震局、云南省地震局和国家地震局为本次研究工作提供地震波形和震相资料.感谢国家测震台网数据备份中心为本研究提供震相数据.感谢赵大鹏教授提供层析成像程序开展本次研究工作,感谢GMT(Generic Mapping Tools Graphics)团队提供的绘图软件.感谢黄雯丽和谭皓原协助处理数据以及调试反演程序.
| Bai D H, Unsworth M J, Meju M A, et al. 2010. Crustal deformation of the eastern Tibetan plateau revealed by magnetotelluric imaging. Nature Geosci, 3(5): 358-362. DOI:10.1038/ngeo830 | |
| Chang L J, Wang C Y, Ding Z F. 2006. A study on SKS splitting beneath the Yunnan region. Chinese Journal of Geophysics , 49(1): 197-204. | |
| Chen L J, Quan D H, Hu F X, et al. 2000. A study on focus in fluence region of Tonghai earthquake in 1970. South China Journal of Seismology , 20(3): 31-38. DOI:10.3969/j.issn.1001-8662.2000.03.005 | |
| Deng Q D, Zhang P Z, Ran Y K, et al. 2003. Active tectonics and earthquake activities in China. Earth Science Frontiers , 10(u08): 66-73. DOI:10.3221/j.issn:1005-2321.2003.z1.012 | |
| Gao Y, Wang Q, Zhao B, et al. 2013. A rupture blank zone in middle south part of Longmenshan Faults: Effect after Lushan MS7.0 earthquake of 20 April 2013 in Sichuan, China. Science China:Earth Science, 57(9): 2036-2044. DOI:10.1007/s11430-014-4827-2 | |
| Gao Y G, Li Y H. 2014. Crustal thickness and VP/VS in the Northeast China-North China region and its geological implication. Chinese Journal of Geophysics , 57(3): 847-857. DOI:10.6038/cjg20140314 | |
| Hacker B R, Gnos E, Ratschbacher L, et al. 2000. Hot and dry deep crustal xenoliths from Tibet. Science, 287(5462): 2463-2466. DOI:10.1126/science.287.5462.2463 | |
| He Z Q, Su W, Ye T L. 2004. Seismic tomography of Yunnan region using short-period surface wave phase velocity. Acta Seismologica Sinica , 26(6): 583-590. | |
| He Z Q, Ye T L, Su W. 2004. S-wave velocity structure of the middle and upper crust in the Yunnan region. Chinese Journal of Geophysics , 47(5): 838-844. | |
| Huang J L, Zhao D P, Zheng S H. 2002. Lithospheric structure and its relationship to seismic and volcanic activity in southwest China. Journal of Geophysical Research, 107(B10): ESE 13-1-ESE 13-14. DOI:10.1026/2000JB000137 | |
| Huang J L, Zhao D P. 2006. High-resolution mantle tomography of China and surrounding regions. Article. Journal of Geophysical Research, 111(B9): B09305. DOI:10.1029/2005JB004066 | |
| Huang R Q, Wang Z, Pei S P, et al. 2009. Crustal ductile flow and its contribution to tectonic stress in Southwest China. Tectonphysics, 473(3-4): 476-489. DOI:10.1016/j.tecto.2009.04.001 | |
| Huang Z X, Li H Y, Xu Y. 2013. Lithospheric S-wave velocity structure of the North-South Seismic Belt of China from surface wave tomography. Chinese Journal of Geophysics , 56(4): 1121-1131. DOI:10.6038/cjg20130408 | |
| Hubbard J, Shaw J H. 2009. Uplift of the Longmen Shan and Tibetan plateau, and the 2008 Wenchuan (M=7.9). Earthquake. Nature, 458(7235): 194-197. DOI:10.1038/nature07837 | |
| Jacob K H. 1970. Three-dimensional seismic ray tracing in a laterally heterogeneous spherical Earth. Journal of Geophysical Research, 75(32): 6675-6689. DOI:10.1029/JB075i032p06675 | |
| Jiang W W, Jiang D D, Xu Y, et al. 2014. Features of crust and lithosphere velocity structures along the north-south tectonic belt and adjacent regions in China. Chinese Journal of Geophysics , 57(12): 3944-3956. DOI:10.6038./cjg20141208 | |
| Jiménez-Munt I, Fernàndez M, Vergés J, et al. 2008. Lithosphere structure underneath the Tibetan Plateau inferred from elevation, gravity and geoid anomalies. Earth Planet. Sci. Lett., 267(1-2): 276-289. DOI:10.1016/j.epsl.2007.11.045 | |
| Julian B R, Gubbins D. 1977. Three-dimensional seismic ray tracing. Journal of Geophysics, 43: 95-113. | |
| Laske G, Masters G. 1997. A global digital map of sediment thickness. EOS Trans. AGU, 78: F483. | |
| Laske G, Masters G, Ma Z T, et al. 2013. Update on CRUST1.0-A 1-degree global model of Earth's crust. Geophysical Research Abstracts, 15: EGU 2013-2658. | |
| Lei J S, Zhao D P. 2009. Structural heterogeneity of the Longmenshan fault zone and the mechanism of the 2008 Wenchuan earthquake (Ms=7.0). Geochem. Geophys. Geosyst, 10(10): Q10010. DOI:10.1029/2009GC002590 | |
| Li F, Zhou S Y, Su Y J, et al. 2011. Study on Pn-wave velocity structure and anisotropy in the Sichuan-Yunnan and its adjacent areas. Chinese Journal of Geophysics , 54(1): 44-54. DOI:10.3969/j.issn.0001-5733.2011.01.006 | |
| Li Y, Huang R Q, Zhou R J, et al. 2009. Geological background of Longmen Shan seismic belt and surface ruptures in Wenchuan Earthquake. Journal of Engineering Geology , 17(1): 3-18. | |
| Li Y H, Wu Q J, Tian X B, et al. 2009. Crustal structure in the Yunnan region determined by modeling receiver function. Chinese Journal of Geophysics , 52(1): 67-80. | |
| Li Y H, Pan J T, Wu Q J, et al. 2014. Crustal and uppermost mantle structure of SE Tibetan plateau from Rayleigh-wave group-velocity measurements. Earthquake Science, 27(4): 411-419. DOI:10.1007/s11589-014-0090-z | |
| Li Z D, Gao Z J. 2016. Characteristics and distribution of earthquake relics at Luhuo and their scientific value. Acta Grologica Sichuan , 36(2): 213-216. | |
| Liang C T, Song X D. 2006. A low velocity belt beneath northern and eastern Tibetan Plateau from Pn tomography. Geophysical Research Letters, 33(22): L220306. DOI:10.1029/2006GL027926 | |
| Liu J, Zhang Z H, Wen L, et al. 2008. The MS8.0 Wenchuan earthquake co-seismic rupture and its tectonic implications——an out of sequence thrusting event witn slip partitioned on multiple faults. Acta Geologica Sinica , 82(12): 1707-1722. | |
| Liu M J, Mooney W D, Li S L, et al. 2006. Crustal structure of the northeastern margin of the Tibetan plateau from the Songpan-Garzê terran to the Ordos basin. Tectonophysics, 420(1-2): 253-266. DOI:10.1016/j.tecto.2006.01.025 | |
| Liu Q Y, Li Y, Chen J H, et al. 2009. Wenchuan MS8.0 earthquake: Preliminary study of the S-wave velocity structure of the crust and upper mantle. Chinese Journal of Geophysics , 52(2): 309-319. | |
| Luo W X, Hu X Y, Li D W, et al. 2012. Hypocentres spatial distribution and its tectonic significance in southern section of the North-South Seismic Belt, China. Journal of Jilin University (Earth Science Edition) , 42(6): 1944-1958. | |
| Mechie J, Sobolev S V, Ratschbacher L, et al. 2004. Precise temperature estimation in the Tibetan crust from seismic detection of the α-β quartz transition. Geology, 32(7): 601-604. DOI:10.1130/G20367.1 | |
| Paige C C, Saunders M A. 1982. LSQR: An algorithm for sparse linear equations and sparse least squares. ACM Transactions on Mathematical Software, 8(1): 43-71. DOI:10.1145/355984.355989 | |
| Pei S P, Su J R, Zhang H J, et al. 2010. Three-dimensional seismic velocity structure across the 2008 Wenchuan MS8.0 earthquake, Sichuan, China. Tectonophysics, 491(1-4): 211-217. DOI:10.1016/j.tecto.2009.08.039 | |
| Pereyra V, Lee W H K, Keller H B. 1980. Solving two-point seismic-ray tracing problems in a heterogeneous medium: Part1. A general adaptive finite difference method. Bulletin of the Seismological Society of America, 70(1): 79-99. | |
| Pollack D, Hockensmith C D. 1992. Carpenter farm: A middle fort ancient community in Franklin County, Kentucky.//Pollack D, Henderson A G eds. Current Archaeological Research in Kentucky. Frankfort: Kentucky Heritage Council, 151-186. | |
| Royden L H, Burchfiel B C, King R W, et al. 1997. Surface deformation and lower crustal flow in eastern Tibet. Science, 276(5313): 788-790. DOI:10.1126/science.276.5313.788 | |
| Royden L H, Burchfiel B C, van der Hilst R D. 2008. The geological evolution of the Tibetan Plateau. Science, 321(5862): 1054-1058. | |
| Rui Y, Huang T S, Mehrotra S. 1999. Constructing table-of-content for video. Multimedia Systems, 7(5): 359-368. DOI:10.1007/s005300050138 | |
| Shi Y T, Gao Y, Zhang Y J, et al. 2013. Shear-wave splitting in the crust in Eastern Songpan-Garzê block, Sichuan-Yunnan block and Western Sichuan Basin. Chinese Journal of Geophysics , 56(2): 481-494. DOI:10.6038/cjg20130212 | |
| Tai L X, Gao Y, Liu G, et al. 2015. Crustal seismic anisotropy in the southeastern margin of Tibetan Plateau by ChinArray data: Shear-wave splitting from temporary observations of the first phase. Chinese Journal of Geophysic , 58(11): 4079-4091. DOI:10.6038/cjg20151116 | |
| Tang R C, Lu L K. 1981. On the seismogeological characteristics of 1976 Songpan-Pingwu earthquakes. Seismology and Geology , 3(2): 41-47. | |
| Thurber C H. 1983. Earthquake locations and three-dimensional crustal structure in the Coyote Lake Area, central California. Journal of Geophysical Research, 88(B10): 8226-8236. DOI:10.1029/JB088iB10p08226 | |
| Um J, Thurber C. 1987. A fast algorithm for two-point seismic ray tracing. Bulletin of the Seismological Society of America, 77(3): 972-986. | |
| Waldhauser F, Ellsworth W L. 2000. A double-difference earthquake location algorithm: Method and application to the Northern Hayward Fault, California. Bulletin of the Seismological Society of America, 90(6): 1353-1368. DOI:10.1785/0120000006 | |
| Wang C Y, Lou H, Wu J P, et al. 2002. Seismological study on the crustal structure of Tengchong volcano-geothermal area. Acta Seismologica Sinica , 24(3): 231-242. | |
| Wang C Y, Chan W W, Mooney W D. 2003. Three-dimensional velocity structure of crust and upper mantle in southwestern China and its tectonic implications. Journal of Geophysical Research, 108(B09): 2442. DOI:10.1029/2002JB001973 | |
| Wang C Y, Han W B, Wu J P, et al. 2007. Crustal structure beneath the eastern margin of the Tibetan Plateau and its tectonic implications. Journal of Geophysical Research, 112(B7). DOI:10.1029/2005JB003873 | |
| Wang C Y, Lou H, Wang X L, et al. 2009a. Crustal structure in Xiaojiang fault zone and its vicinity. Earthquake Science, 22(4): 347-356. DOI:10.1007/s11589-009-0347-0 | |
| Wang C Y, Yang W C, Wu J P, et al. 2015. Study on the lithospheric structure and earthquakes in North-South Tectonic Belt. Chinese Journal of Geophysics , 58(11): 3867-3901. DOI:10.6038/cjg2015110 | |
| Wang J Y, Hu S B, Yang W C, et al. 2001. Geothermal measurement of pilot drilling in mainland China. Chinese Science Bulletin , 46(10): 847-850. | |
| Wang Q, Gao Y, Shi Y T, et al. 2013. Seismic anisotropy in the uppermost mantle beneath the northeastern margin of Qinghai-Tibet plateau: Evidence from shear wave splitting of SKS, PKS and SKKS. Chinese Journal of Geophysics , 56(3): 892-905. DOI:10.6038/cjg20130318 | |
| Wang Q, Gao Y. 2014. Rayleigh wave phase velocity tomography and strong earthquake activity on the southeastern front of the Tibetan Plateau. Science China: Earth Sciences, 4455(10): 2532-2542. | |
| Wang Q, Gao Y, Shi Y T, et al. 2015. Rayleigh wave azimuthal anisotropy on the southeastern front of the Tibetan Plateau from seismic ambient noise. Chinese Journal of Geophysics , 58(11): 4068-4078. DOI:10.6038/cjg20151115 | |
| Wang X B, Zhu Y T, Zhao X K, et al. 2009. Deep conductivity characteristics of the Longmenshan, Eastern Qinghai-Tibet Plateau. Chinese Journal of Geophysics , 52(2): 564-571. | |
| Wang X B, Zhang G, Fang H, et al. 2014a. Crust and upper mantle resistivity structure at middle section of Longmenshan, eastern Tibetan plateau. Tectonophysics, 619. | |
| Wang Y P, Ma J, Li C Y. 2007. The migration characteristics of strong earthquakes on the North-South Seismic Belt and its relation with the South Asia Seismic Belt. Seismology and Geology , 29(1): 1-14. | |
| Wang Z, Zhao D P. 2006. Suboceanic earthquake location and seismic structure in the Kanto district, central Japan. Earth and Planetary Science Letters, 241(3-4): 789-803. DOI:10.1016/j.epsl.2005.11.015 | |
| Wang Z, Fukao Y, Pei S P. 2009a. Structural control of rupturing of the MW7.9 2008 Wenchuan Earthquake. China.Earth and Planetary Science Letters, 279(1-2): 131-138. DOI:10.1016/j.epsl.2008.12.038 | |
| Wang Z, Zhao D P, Wang J. 2010. Deep structure and seismogenesis of the north-south seismic zone in southwest China. Journal of Geophysical Research, 115(B12): B12334. DOI:10.1029/2010JB007797 | |
| Wang Z, Wang J, Chen Z L, et al. 2011. Seismic imaging, crustal stress and GPS data analyses: Implications for the generation of the 2008 Wenchuan Earthquake (M7.9),. China. Gondwana Research, 19(1): 202-212. DOI:10.1016/j.gr.2010.05.004 | |
| Wang Z, Wang X B, Huang R Q, et al. 2012. Structural heterogeneities in southeast Tibet: Implications for regional flow in the lower crust and upper mantle. International Journal of Geophysics, 2012: 975497. DOI:10.1155/2012/975497 | |
| Wang Z, Huang R Q, Pei S P. 2014b. Crustal deformation along the Longmenshan fault zone and its implications for seismogenesis. Tectonophysics, 610: 128-137. DOI:10.1016/j.tecto.2013.11.004 | |
| Wang Z, Su J R, Liu C X, et al. 2015. New insights into the generation of the 2013 Lushan Earthquake (MS7.0), China. Journal of Geophysical Research, 120(5): 3507-3526. DOI:10.1002/2014JB011692 | |
| Wei W B, Unsworth M, Jones A, et al. 2001. Detection of widespread fluids in the Tibetan crust by Magnetotelluric studies. Science, 292(5517): 716-719. DOI:10.1126/science.1010580 | |
| Wesson R L. 1971. Travel-time inversion for laterally inhomogeneous crustal velocity models. Bulletin of the Seismological Society of America, 61(3): 729-746. | |
| Wu J P, Yang T, Wang W L, et al. 2013. Three dimensional P-wave velocity structure around Xiaojiang fault system and its tectonic implications. Chinese Journal of Geophysics , 56(7): 2257-2267. DOI:10.6038/cjg20130713 | |
| Xu L L, Rondenay S, van der Hilst R D. 2007. Structure of the crust beneath the southeastern Tibetan Plateau from teleseismic receiver functions. Phys. Earth Planet. Inter., 165(3-4): 176-193. DOI:10.1016/j.pepi.2007.09.002 | |
| Xu X M, Ding Z F, Shi D N, et al. 2013. Receiver function analysis of crustal structure beneath the eastern Tibetan plateau. Journal of Asian Earth Sciences, 73: 121-127. DOI:10.1016/j.jseaes.2013.04.018 | |
| Xu X M, Ding Z F, Ye Q D, et al. 2015. The crustal and upper mantle structure beneath the South-North Seismic Zone from the inversion of Love wave phase velocity. Chinese Journal of Geophysics , 58(11): 3928-3940. DOI:10.6038/cjg20151104 | |
| Xu X M, Ding Z F, Zhang F X. 2015. The teleseismic tomography study by P-wave traveltime data beneath the southern South-North Seismic Zone. Chinese Journal of Geophysics , 58(11): 4041-4051. DOI:10.6038/cjg20151113 | |
| Xu Y, Huang R Q, Li Z W, et al. 2009. S-wave velocity structure of the Longmen Shan and Wenchuan earthquake area. Chinese Journal of Geophysics , 52(2): 329-338. | |
| Xu Y, Li Z W, Huang R Q, et al. 2010. Seismic structure of the Longmen Shan region from S-wave tomography and its relationship with the Wenchuan MS8.0 earthquake on 12 May 2008, southwestern China. Geophys. Res. Lett., 37(2): L02304. DOI:10.1029/2009GL041835 | |
| Xu Y, Zhong D L, Liu J H. 2012. Constraints of deep structures on the crust-mantle decoupling in the western Yunnan and the magma activity in the Tengchong volcanic area. Progress in Geophys , 27(3): 846-855. DOI:10.6038/j.issn.1004-2903.2012.02.003 | |
| Xu Y, Yang X T, Liu J H. 2013. Tomographic study of crustal velocity structures in the Yunnan region southwest China. Chinese Journal of Geophysics , 56(6): 1904-1914. DOI:10.6038/cjg20130613 | |
| Yang Y J, Zheng Y, Chen J, et al. 2010. Rayleigh wave phase velocity maps of Tibet and the surrounding regions from ambient seismic noise tomography. Geochem. Geophys., Geosyst., 11(8): Q08010. | |
| Yao H J, van der Hilst R D, de Hoop M V. 2006. Surface-wave array tomography in SE Tibet from ambient seismic noise and two-station analysis-Ⅰ. Phase velocity maps. Geophys. J. Int., 166(2): 732-744. | |
| Yao H J, Beghein C, Van Der Hilst R D. 2008. Surface wave array tomography in SE Tibet from ambient seismic noise and two-station analysis——Ⅱ. Crustal and upper-mantle structure. Geophys. J. Int., 173(1): 205-219. DOI:10.1111/j.1365-246X.2007.03696.x | |
| Yi G X, Wen X Z, Xin H, et al. 2013. Stress state and major-earthquake risk on the southern segment of the Longmen Shan fault zone. Chinese Journal of Geophysics , 56(4): 1112-1120. DOI:10.6038/cjg20130407 | |
| Zhang C, Guo J Y, Xie X S, et al. 1986. Theoretical modelling on characteristics of fault creep and its propagation along the Xianshuihe fault in the interval between two strong earthquakes. Acta Seismologica Sinica , 8(3): 229-239. | |
| Zhang J S, Li Y, Han Z J. 2003. Deformation responses to eastwards escaping of the Qinghai-Tibet Plateau and tectonics of the South-North Seismic Zones in China. Earth Science Frontiers , 10(S): 168-175. | |
| Zhang S C, Liu B C. 1978. Seismic geological characteristics of Tonghai earthquake in 1970. Scientia Geologica Sinica , 13(4): 323-335. | |
| Zhao D P, Horiuchi S, Hasegawa A. 1992. Seismic velocity structure of the crust beneath the Japan Islands. Tectonophysics, 212(3-4): 289-301. DOI:10.1016/0040-1951(92)90296-I | |
| Zhao D P, Kanamori H, Negishi H, et al. 1996. Tomography of the Source Area of the 1995 Kobe Earthquake: Evidence for Fluids at the Hypocenter?. Science, 274(5294): 1891-1894. DOI:10.1126/science.274.5294.1891 | |
| Zheng C, Ding Z F, Song X D. 2016. Joint inversion of surface wave dispersion and receiver functions for crustal and uppermost mantle structure in Southeast Tibetan Plateau. Chinese Journal of Geophysics , 59(9): 3223-3236. DOI:10.6038/cjg20160908 | |
| 常利军, 王椿镛, 丁志峰. 2006. 云南地区SKS波分裂研究. 地球物理学报, 49(1): 197–204. | |
| 陈立军, 全德辉, 胡奉湘, 等. 2000. 1970年通海地震震源影响区的研究. 华南地震, 20(3): 31–38. DOI:10.3969/j.issn.1001-8662.2000.03.005 | |
| 邓起东, 张培震, 冉勇康, 等. 2003. 中国活动构造与地震活动. 地学前缘, 10(u08): 66–73. DOI:10.3221/j.issn:1005-2321.2003.z1.012 | |
| 高原, 王琼, 赵博, 等. 2013. 龙门山断裂带中南段的一个破裂空段——芦山地震的震后效应. 中国科学:地球科学, 43(6): 1038–1046. | |
| 黄忠贤, 李红谊, 胥颐. 2013. 南北地震带岩石圈S波速度结构面波层析成像. 地球物理学报, 56(4): 1121–1131. DOI:10.6038/cjg20130408 | |
| 江为为, 姜迪迪, 胥颐, 等. 2014. 南北构造带及邻域地壳、岩石层速度结构特征研究. 地球物理学报, 57(12): 3944–3956. DOI:10.6038/cjg20141208 | |
| 李飞, 周仕勇, 苏有锦, 等. 2011. 川滇及邻区Pn波速度结构和各向异性研究. 地球物理学报, 54(1): 44–54. DOI:10.3969/j.issn.0001-5733.2011.01.006 | |
| 李勇, 黄润秋, 周荣军, 等. 2009. 龙门山地震带的地质背景与汶川地震的地表破裂. 工程地质学报, 17(1): 3–18. | |
| 李永华, 吴庆举, 田小波, 等. 2009. 用接收函数方法研究云南及其邻区地壳上地幔结构. 地球物理学报, 52(1): 67–80. | |
| 李忠东, 高竹军. 2016. 炉霍地震遗迹特征、空间分布规律及科学价值. 四川地质学报, 36(2): 213–216. | |
| 刘静, 张智慧, 文力, 等. 2008. 汶川8级大地震同震破裂的特殊性及构造意义——多条平行断裂同时活动的反序型逆冲地震事件. 地质学报, 82(12): 1707–1722. DOI:10.3321/j.issn:0001-5717.2008.12.007 | |
| 刘启元, 李昱, 陈九辉, 等. 2009. 汶川MS8.0地震:地壳上地幔S波速度结构的初步研究. 地球物理学报, 52(2): 309–319. | |
| 唐荣昌, 陆联康. 1981. 1981. 1976年松潘、平武地震的地震地质特征. 地震地质, 3(2): 41–47. | |
| 汪集暘, 胡圣标, 杨文采, 等. 2001. 中国大陆科学钻探先导孔地热测量. 科学通报, 46(10): 847–850. DOI:10.3321/j.issn:0023-074X.2001.10.014 | |
| 王椿镛, 杨文采, 吴建平, 等. 2015. 南北构造带岩石圈结构与地震的研究. 地球物理学报, 58(11): 3867–3901. DOI:10.6038/cjg2015110 | |
| 王琼, 高原, 石玉涛, 等. 2013. 青藏高原东北缘上地幔地震各向异性:来自SKS、PKS和SKKS震相分裂的证据. 地球物理学报, 56(3): 892–905. DOI:10.6038/cjg20130318 | |
| 王琼, 高原. 2014. 青藏东南缘背景噪声的瑞利波相速度层析成像及强震活动. 中国科学:地球科学, 44(11): 2440–2450. | |
| 王琼, 高原, 石玉涛, 等. 2015. 青藏高原东南缘基于背景噪声的Rayleigh面波方位各向异性研究. 地球物理学报, 58(11): 4068–4078. DOI:10.6038/cjg20151115 | |
| 王绪本, 朱迎堂, 赵锡奎, 等. 2009. 青藏高原东缘龙门山逆冲构造深部电性结构特征. 地球物理学报, 52(2): 564–571. | |
| 汪一鹏, 马瑾, 李传友. 2007. 南北地震带强震迁移特征及其与南亚地震带的联系. 地震地质, 29(1): 1–14. | |
| 吴建平, 杨婷, 王未来, 等. 2013. 小江断裂带周边地区三维P波速度结构及其构造意义. 地球物理学报, 56(7): 2257–2267. DOI:10.6038/cjg20130713 | |
| 徐小明, 丁志峰, 叶庆东, 等. 2015. 基于LOVE波相速度反演南北地震带地壳上地幔结构. 地球物理学报, 58(11): 3928–3940. DOI:10.6038/cjg20151104 | |
| 徐小明, 丁志峰, 张风雪. 2015. 南北地震带南段远震P波走时层析成像研究. 地球物理学报, 58(11): 4041–4051. DOI:10.6038/cjg20151113 | |
| 胥颐, 杨晓涛, 刘建华. 2013. 云南地区地壳速度结构的层析成像研究. 地球物理学报, 56(6): 1904–1914. DOI:10.6038/cjg20130613 | |
| 张超, 过家元, 谢新生, 等. 1986. 鲜水河断裂带上两次强震之间的断层蠕滑及其传播特征的模型研究. 地震学报, 8(3): 229–239. | |
| 张家声, 李燕, 韩竹均. 2003. 青藏高原向东挤出的变形响应及南北地震带构造组成. 地学前缘, 10(S): 168–175. | |
| 郑晨, 丁志峰, 宋晓东. 2016. 利用面波频散与接收函数联合反演青藏高原东南缘地壳上地幔速度结构. 地球物理学报, 59(9): 3223–3236. DOI:10.6038/cjg20160908 | |
 2017, Vol. 60


