2. 中国地震局地球物理研究所, 地震观测与地球物理成像重点实验室, 北京 100081;
3. Department of Earth and Atmos. Sciences, Saint Louis University, Saint Louis 63108, USA
2. Key Laboratory of Seismic Observation and Geophysical Imaging, China Earthquake Administration, Beijing 100081, China;
3. Department of Earth and Atmos. Sciences, Saint Louis University, Saint Louis 63108, USA
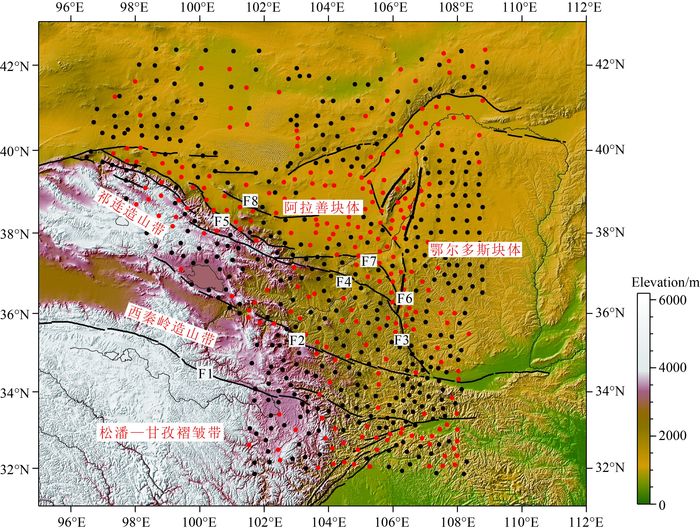
南北地震带位于青藏高原与华北克拉通和扬子克拉通的过渡区,具有复杂的结构和强烈的构造变形特征,是中国大陆东西部大地构造的主要分界,也是中国大陆内部地震发生强度最高的地区之一.在深部地球物理方面南北地震带表现为既是一条巨型重力梯度带,又是均衡重力异常和区域磁异常的分界带,以及地壳厚度和岩石圈厚度急剧变化的地带(王椿镛等, 2015).地质学家将南北地震带分为北、中、南三段.北段包括的构造块体主要有祁连造山带、西秦岭造山带和松潘甘孜地块在内的青藏东北缘及相邻的阿拉善、鄂尔多斯地块和四川盆地北部(图 1).
|
图 1 构造及地震台站分布 黑色圆点为有H-κ扫描结果台站,红色圆点代表无H-κ结果台站.研究区主要断裂为: F1东昆仑断裂;F2西秦岭北缘断裂;F3六盘山东麓断裂;F4海原断裂;F5祁连山北缘断裂;F6青铜峡—固原断裂;F7香山—天景山断裂;F8龙首山断裂. Fig. 1 Map showing faults and distribution of seismic stations (red and black dots) Black dots represent seismic stations that crustal thickness and VP/VS were obtained by the H-κ grid search method. Red dots are stations without such results. Black lines represent major faults, F1: eastern Kunlun Fault; F2: western Qinling Fault; F3: Liupanshan Fault; F4: Haiyuan Fault; F5: northern Qilianshan Fault; F6: Qingtongxia—Guyuan Fault; F7: Xiangshan—Tianjingshan Fault; F8: Longshoushan Fault. |
印度板块和欧亚板块之间的碰撞导致青藏高原内部和边缘产生了强烈的变形和地壳增厚.为解释青藏高原演化过程, 地球科学家提出了多个大陆动力学模型.目前被用来解释地壳增厚的模型主要有三个:侧向滑移模型(Molnar and Tapponnier, 1975),全地壳增厚模型(England and Houseman, 1986),下地壳流模型(Clark and Royden, 2000; Royden et al., 2008).由此可见, 关于青藏高原地壳增厚问题依然存在争论.华北克拉通古老的岩石圈在中、新生代经历了强烈的不均匀改造和破坏,其东部岩石圈厚度和性质发生了大规模的减薄和破坏,而中、西部则主要表现为古老的克拉通岩石圈和局部改造的岩石圈并存(危自根等,2015).高分辨率的地壳结构研究能为探讨其构造演化以及破坏的深部机制提供重要约束,然而作为华北克拉通西部块体的一部分的阿拉善块体由于宽频带地震台站观测资料较少,因此获取的地壳结构结果较少,其岩石圈是否也遭受了破坏与减薄仍有待研究.同时西秦岭造山带作为中国东部和西部、南部和北部的地壳结构、地壳厚度和地球物理场的转换带, 其岩石圈结构与深部构造关系记录了青藏高原东北缘板块碰撞的深部过程以及高原向东和东北向发展演化的深部信息, 但这个转换带的深部动力学机制目前仍不清楚(王椿镛等, 2016).
近年来,许多研究学者利用接收函数方法对南北地震带北段及其周缘的地壳结构进行了研究(Pan and Niu, 2011;Xu et al., 2013a, b;徐树斌等, 2013;He et al., 2014;刘启民等, 2014;Shen et al., 2014;Wang et al., 2014a, 2016;姚志祥等, 2014;Deng et al., 2015;Li et al., 2015;Ye et al., 2015;张洪双等, 2015;司芗等, 2016;Zheng et al., 2016).这些研究获得了南北构造带及其周缘的地壳结构,但由于台站分布的原因,一直未能获取高分辨率的地壳厚度和泊松比分布.
中国地震局地球物理研究所在2013—2015年利用“中国地震科学台阵观测”项目在南北地震带北段实施了大型流动台阵观测,因此本文利用流动观测台阵所记录到的远震波形,采用接收函数方法来获取高分辨率的地壳厚度和泊松比分布,通过分析青藏高原东北缘地壳增厚变形特征对深入理解这一由多个构造单元组成的复合构造带的演化过程及其深部动力学背景具有重要意义.
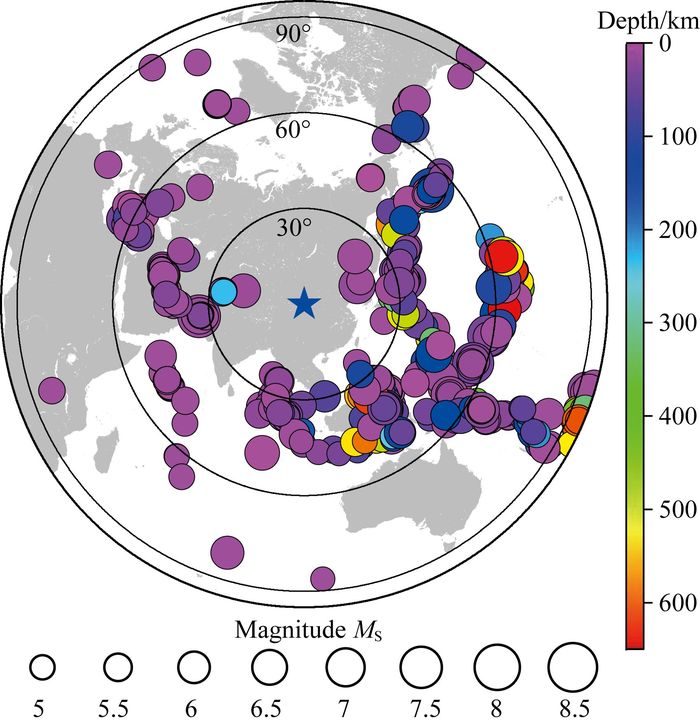
2 数据与方法“中国地震科学台阵观测”项目在南北地震带及其周缘架设了宽频带流动台站673个(图 1),地震计为CMG-3ESP,频带范围为50 Hz~60 s,每秒50个采样点,台站间距约30 km,台站分布如图 1所示.本文选取从2013年9月至2015年1月间,震中距在30°~90°、震级大于5.5、波形记录信噪比高的地震事件来提取接收函数.图 2给出了所用事件的震中分布,共514个地震事件,从图 2中我们可以看到,地震事件的方位覆盖较好.
|
图 2 震中分布 Fig. 2 Distribution of teleseismic events used in this study |
先对地震台站记录到的三分量的原始记录作去均值处理,再进行0.02~1 Hz的带通滤波处理,去除仪器响应,以P波前50 s为起点,在宽度150 s的时窗内截取了P波波形,将两个水平分量旋转到径向和切向方向,得到径向和切向分量.为了获得较可靠的接收函数,需要对观测波形进行了严格的筛选,本文挑选至少被5个台站以上记录到的且有清晰直达P波震相的波形记录用于提取接收函数.采用Ligorría和Ammon(1999)年提出的时间域迭代反褶积方法来提取接收函数.
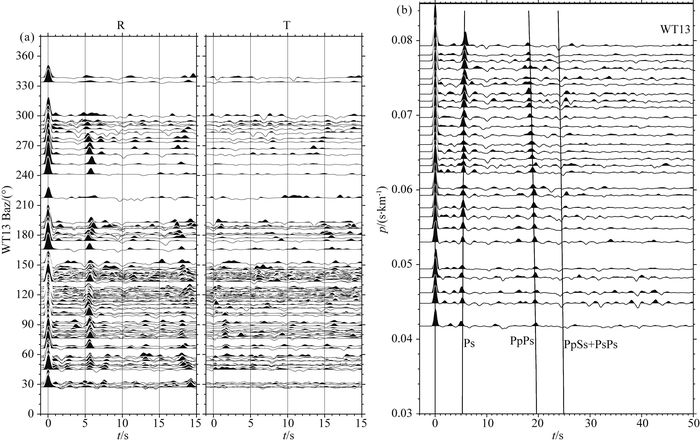
提取完接收函数对接收函数进行评价,没有明显的Moho界面转换波震相或者与邻近射线路径的接收函数差异较大的结果均被剔除.对研究区673个台站所接收到的514个地震进行了计算并经过严格的挑选,最后共得到良好接收函数104943个,平均每个台站有155个有效接收函数,为进行H-κ叠加搜索提供了可靠的保障.我们将在45 km深度处的转换点间距小于0.2 km范围内的接收函数进行了叠加.把挑选好的接收函数按方位角分布,得到的结果如图 3a所示,将接收函数按照射线参数排列,并对相同的射线参数的接收函数进行叠加,得到的结果如图 3b.从图中可以看到明显的Moho界面转换波Ps震相及多次波震相.
|
图 3 WT13台接收函数结果 (a)按方位角排练;(b)按射线参数排列. Fig. 3 Receiver functions of station WT13 (a) Sorted by azimuths; (b) Sorted by ray parameters. |
地壳厚度H和地壳物质的泊松比ν作为描述地壳结构和物质性质的2个参数, 对深部介质性质的研究有重要作用.地壳的泊松比ν可以直接从P波和S波的波速比κ求取: ν=0.5×[1-1/(k2-1) ],其中κ=VP/VS.接收函数的水平径向主要包括Ps波,以及经过多次反射的PpPs,PsPs和PpSs等震相.利用这些震相和直达P波之间的到时差,Zhu and Kanamori(2000)发展了H-κ方法可以用来获取台站下方的地壳厚度H和波速比κ.H-κ叠加函数为s(H, κ),公式为

|
(1) |
其中r(t)是径向接收函数,t1、t2和t3是对应的Ps, PpPs和PpSs+PsPs的转换波到时.wi(i=1, 2, 3) 是权重因子,需要满足w1+w2+w3=1.在本文中,权重因子w1、w2、w3分别为0.6、0.3和0.1,相对应为Ps、PpPs和PpSs+PsPs震相.
在进行H-κ叠加搜索时,需要先设定一个地壳平均速度.由于研究区涉及多个构造块体,因此根据人工测深的结果(嘉世旭和张先康, 2008;Gao et al., 2013; Wang et al., 2014b),我们针对不同块体采用了不同的地壳平均速度,在祁连造山带和西秦岭造山带102°E以西采用了6.2 km·s-1,在其他地区采用6.3 km·s-1的地壳平均速度来进行H-κ叠加搜索,H的取值范围为30~70 km,κ的取值范围为1.5~2.0,进而得到每个台站下的地壳深度和波速比.Zhu和Kanamori(2000)的研究表明当VP选取存在5%的误差时,对H和κ的影响范围只有2 km和0.02,而层析成像结果表明研究区速度异常在5%以内(郭慧丽等, 2017),表明地壳平均速度选取的偏差对最终的结果影响在误差允许范围之内.为了进一步保证结果的可靠性,我们只保留了优选出的接收函数数量在50条以上的台站的结果.图 4为61061和62350台用H-κ扫描算法获得的台站下方的地壳厚度和波速比, 以及用叠加分析获得的(H, κ)最佳解所预测的转换波及多次波走时曲线位置.地壳厚度和波速比的不确定性分别从σH2=2σs/(∂s2/∂H2)和σκ2=2σs/(∂s2/∂κ2)得到, 其中σs是叠加中得到的s(H, κ)的估计方差.在对每一个台站作初次扫描的基础上,选取多次震相较清晰的接收函数作H-κ分析,其参数的不确定性估计有较大的提高.本文所使用大多数台站地壳厚度的估计误差小于2.5 km, 波速比的估计误差小于0.05.

|
图 4 用H-κ扫描算法获得台站下方的地壳厚度和地壳波速比, 以及用获得的(H, κ)最佳解作预测的走时曲线(Ps, PpPs, PpSs+PsPs) Fig. 4 Crustal thickness and VP/VS obtained by the H-κ grid search method. Black lines indicate the arrival times of converted phases predicted by the optimum (H, κ) |
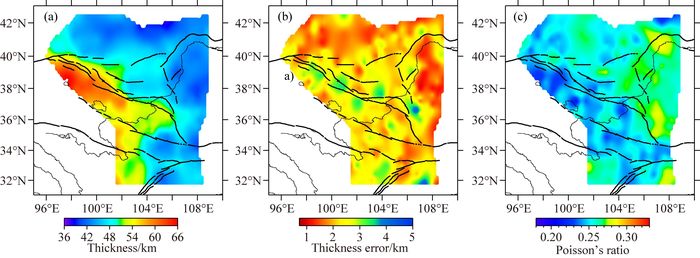
利用H-κ叠加搜索,获取了469个台站的地壳厚度及波速比,剩余台站由于其下方复杂的地壳结构或其他原因(如台站位于地壳厚度剧烈变化地带,噪声背景大,或远震记录较少), 使得Ps到时分布范围较广或者多次震相PpPs、PpSs+PsPs不清晰, 因而无法得到可靠的结果.接下来利用经验公式ν=0.5×[1-1/(κ2-1) ]计算每个台站的泊松比,对各台站获取的结果进行插值得到了地壳厚度、地壳厚度误差及泊松比的二维分布图,如图 5所示.
|
图 5 地壳厚度、地壳厚度误差及泊松比分布 (a)地壳厚度分布;(b)地壳厚度误差分布;(c)泊松比分布. Fig. 5 Crustal thickness and its errors and Poisson′s ratio (a) Crustal thickness; (b) Errors of crustal thickness; (c) Poisson′s ratio. |
从图 5中可以看出,大部分台站的地壳厚度误差都小于3 km,表明大部分台站的接收函数的质量较好.H-κ叠加搜索结果显示研究区的地壳厚度从西南向东北逐渐减小,从约65 km减薄至约40 km,不同块体之间地壳厚度存在明显差异.祁连造山带西部地壳厚度超过60 km,东部地壳厚度为50~55 km;阿拉善块体西部地壳厚度约50 km,东部约45 km;鄂尔多斯块体西南缘地壳厚度约45~50 km,鄂尔多斯块体内部约42~43 km.西秦岭造山带从西部的约55 km厚减薄至中部的约40 km,而与其相邻的松潘甘孜块体北部的地壳厚度大约50 km.研究区泊松比的变化范围为0.20~0.31,平均泊松比为0.25.祁连山造山带、西秦岭造山带和阿拉善块体的西部具有较低的泊松比,可以认为这种较低泊松比的地壳主要由长英质矿物组成(Zandt and Ammon, 1995;Christensen, 1996).鄂尔多斯块体和松潘—甘孜块体具有全球大陆地壳平均泊松比(0.265),中高泊松比主要分布在银川—河套地堑,鄂尔多斯块体西南缘.这些结果和前人的研究结果具有很好的一致性(Pan and Niu, 2011; Xu et al., 2013b; 刘启民等, 2014; Shen et al., 2014; Wang et al., 2014a, 2016; 姚志祥等, 2014;Li et al., 2015, 2014; 李永华等, 2006; Zheng et al., 2016),但本文的结果具有更高的分辨率.
4 讨论本文结果显示作为青藏高原东北缘一部分的祁连造山带,在102°E东、西两部分地壳结构存在明显差异,西部地壳厚度超过60 km,而东部地壳厚度为50~55 km,这反映了祁连造山带东、西部地壳增厚变形存在着明显差异.S波接收函数研究结果显示102°E东、西两部分岩石圈厚度存在明显差异,其西侧岩石圈厚度120~150 km,东侧为150~180 km,表明祁连造山带西部岩石圈受到印度板块俯冲引起的岩石圈活化改造程度较其东部受到的影响更为强烈(张洪双等, 2013).体波层析成像结果显示在下地壳及上地幔顶部祁连造山带102°E东西两侧速度结构存在明显差异,102°E以西呈现为明显的低速异常,而东侧靠近阿拉善块体的区域则接近于正常速度(Xu and Song, 2010;郭慧丽等,2017).面波研究结果也显示在祁连造山带102°E以西中下地壳内部存在明显的低速区(Zhang et al., 2011a;Li et al., 2012;Li et al., 2016;Zheng et al., 2016),一般存在低速区被认为是由于地壳内存在含水流体或部分熔融所致(Yang et al., 2012;Chen et al., 2014),而这两种情况均会降低地壳硬度,从而使地壳更容易增厚变形,进一步使得祁连造山带西部地壳增厚要强于东部.
作为中国东部和西部、南部和北部的地壳结构、地壳厚度和地球物理场的转换带,西秦岭造山带地壳厚度在103°E附近迅速从约55 km减薄约40 km,表明西秦岭造山带东、西部可能也经历了不同的构造演化.层析成像结果显示在秦岭造山带下方上地幔存在低速异常(黄忠贤等, 2013, 2014;Li et al., 2016;Zheng et al., 2016;郭慧丽等,2017),表明在西秦岭造山带上地幔可能存在地幔流.各向异性的研究显示秦岭造山带快波方向为近东西向且快慢波时间延迟较大,推测其下方可能存在一个青藏高原物质东流的地幔流通道(Huang et al., 2008; 常利军等, 2011, 2016).重力研究结果显示西秦岭造山带西部有山根,而东部无明显山根,并推测西秦岭造山带岩石圈遭到了地幔流的侵蚀(王谦身等, 2013;毕奔腾等, 2016).接收函数反演和人工地震测深结果显示相对祁连造山带和鄂尔多斯块体平均25 km厚的下地壳,西秦岭造山带的下地壳偏薄,厚度仅为15~20 km (Liu et al., 2006;张洪双等, 2015).同时张洪双等(2013)结果还显示西秦岭造山带在103°E东西两侧具有不同的岩石圈厚度,西侧岩石圈厚度约150~180 km,而东侧岩石圈则仅为120~150 km厚.根据以上这些研究结果,我们推测西秦岭造山带下方存在的地幔流导致西秦岭造山带岩石圈在造山运动后期经历了拆沉.造山运动使得地壳在缩短增厚的同时,可能会将其下伏的铁镁质下地壳推向更深的深度,从而导致铁镁质岩石向榴辉岩相转变(Galvé et al., 2002; Vergne et al., 2002),以至于发生拆沉,从而使得西秦岭造山带东部地壳厚度仅为40 km,其小于0.26的泊松比值也表征着该区域地壳物质组分主要为长英质矿物.
本文的研究结果显示与祁连造山带接触的阿拉善块体西部地壳厚度大于50 km,具有较低的泊松比,而阿拉善块体东部靠近银川—河套地堑区域则具有较薄的地壳厚度(约45 km)和中高泊松比,表明阿拉善块体西部可能也受到了印度板块与欧亚板块碰撞的影响,也经历了地壳增厚改造,其克拉通性质只在与银川—河套地堑和鄂尔多斯块体相连的中东部保留下来.层析成像结果表明阿拉善块体西部具有较薄的岩石圈,东部具有较厚的岩石圈,并认为阿拉善块体西部也受到了改造(黄忠贤等, 2013; Li et al., 2016; 郭慧丽等, 2017).地热学反演结果和S波接收函数研究结果也显示相较于鄂尔多斯块体具有较厚的岩石圈,阿拉善块体西部则具有较薄的岩石圈厚度(An and Shi, 2006;张洪双等, 2013),也表明阿拉善块体西部受到了活化改造.
作为华北克拉通西部块体的一部分,鄂尔多斯块体西南部六盘山断裂带附近地壳厚度约45~50 km且具有较高的泊松比,而鄂尔多斯块体内部地壳厚度约42~43 km,同时具有中等泊松比,与Wang等(2014a)和童蔚蔚等(2007)获得的结果较为一致.在六盘山断裂带附近存在一系列深大断裂,这些深大断裂可能引起了地幔物质上涌,从而导致其具有较高的泊松比(Tommasi et al., 2001; Wang et al., 2014a).各向异性研究结果(常利军等,2016)显示在六盘山断裂带附近快波偏振方向与鄂尔多斯块体其他部分存在差异,鄂尔多斯块体西南角快波方向为近E—W向或NW—SE向,其余部分快波方向则表现为SW—NE向,表明六盘山断裂带附近岩石圈结构由于受到青藏高原东北缘的挤压作用而与鄂尔多斯块体内部存在差异(Wang et al., 2014a).
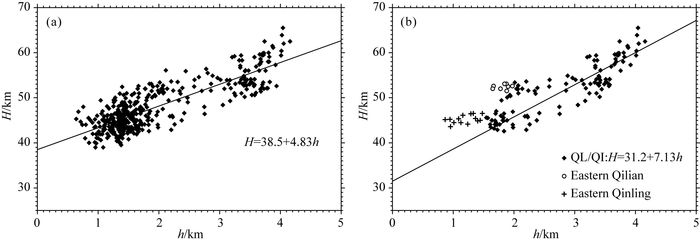
印度板块与欧亚板块的碰撞,导致了青藏高原大范围的隆升,因此研究区具有很高的地形差异,而地壳厚度与地形的关系隐含了大陆地壳形成和构造演化的重要信息.为了解研究区地壳厚度与地表形态的关系,我们给出了地壳厚度与海拔高度的关系图,图 6显示地壳厚度与地表高程之间存在明显的相关性,地壳厚度与高程之间的斜率为4.86.爱利均衡架设地壳的平均密度为2.67 g·cm-3,地幔顶部密度为3.27 g·cm-3,据此计算当山体隆升1 km,山根加深4.45 km,也即地壳厚度加厚5.45 km.重力研究结果显示研究区具有较低的密度,上地壳的密度约2.45~2.6 g·cm-3,地幔密度约3.2 g·cm-3(毕奔腾等, 2016, 王谦身等,2013), 因此本文采用2.55 g·cm-3作为地壳的密度,3.2 g·cm-3作为地幔密度,据此计算高程每升高1 km,地壳厚度将增加4.92 km,与实际观测数据拟合得到的4.86较为接近,这表明研究区地壳整体上可能处于基本均衡的状态.
|
图 6 地壳厚度与高程关系 (a)所有台站地壳厚度与高程关系;(b)祁连造山带和西秦岭造山台站地壳厚度与高程关系. Fig. 6 Relationship of the crustal thickness with elevation (a) All stations; (b) Stations in the Qilian orogenic belt and western Qinling orogenic belt. |
由于研究区所包含的块体较多,考虑到不同块体之间的差异,我们将属于青藏高原东北缘的祁连造山带和西秦岭造山带的台站结果单独进行研究.将祁连造山带和西秦岭造山带的台站地壳厚度和高程进行拟合,地壳厚度与海拔高度的斜率为7.13(图 6b),这表明祁连造山带和西秦岭造山带西部较研究区整体的地壳组成具有较高的密度或者壳幔之间的密度差较小.面波研究结果显示在西秦岭造山带和祁连造山带中下地壳、上地幔具有较低的S波速度(Li et al., 2016),重力结果显示在秦岭造山带东部岩石圈上地幔分布着明显的低密度异常(毕奔腾等,2016),因此推测其较高的斜率应该是由于壳幔之间的密度差较小引起的.同时在图 6b中可以看到,在西秦岭造山带和祁连造山带东部的部分台站(图 5a)结果显示地壳厚度与拟合线之间的偏离较大,因此我们推测在西秦岭造山带和祁连造山带东部的局部区域可能不符合Airy均衡,与王谦身等(2013)重力研究具有很好的一致性.
前述已经提及,位于祁连造山带和秦岭造山带台站下方地壳的泊松比值介于0.22~0.25之间.这种低的泊松比值可能与长英质的平均地壳组分相关,暗示着该区铁镁质的下地壳很薄或者存在缺失现象(Galvé et al., 2002; Vergne et al., 2002).深地震测深剖面显示在该区地壳底部缺少VP>6.9 km·s-1的铁镁质岩石层(王椿镛等, 2003; 张先康等, 2008; Zhang et al., 2011b),而是交替的长英质和中性层.下地壳流模型认为地壳物质以中下地壳流的方式从青藏高原内部向高原边缘流动,从而导致高原的边缘地壳增厚(Clark and Royden, 2000; Royden et al., 2008).而处于熔融状态或部分熔融状态的地壳流则会使地壳具有较高的泊松比,因此如果青藏高原东北缘地壳增厚符合地壳流模型需要较高的泊松比,本文及前人的研究结果显示青藏高原东北缘具有较低的泊松比(李永华等,2006;Pan and Niu, 2011;He et al., 2014;姚志祥等,2014;张洪双等,2015;Wang et al., 2016;Zheng et al., 2016).重力场多尺度分解结果也显示其不支持青藏高原东北缘下地壳流动模型(毕奔腾等,2016).结合这些结果,我们认为单纯的地壳流体模型解释青藏高原东北缘地壳增厚可能有一定的局限,其具体增厚原因还需要进一步研究.
5 结论本文通过位于南北地震带北段及其周缘地区673个台站所记录到的远震波形所提取到的接收函数并应用H-κ扫描方法获取了南北地震带北段的地壳厚度和泊松比,结果显示研究区的地壳厚度从西南向东北逐渐减小,从约65 km减薄至约40 km.祁连造山带西部地壳厚度超过60 km,而东部地壳厚度仅为50~55 km,表明祁连造山带东、西部地壳增厚变形存在着明显差异.西秦岭造山带东、西部地壳厚度存在明显差异,其东部具有较薄的地壳厚度和较低的泊松比,推测其可能在造山运动后期经历了拆沉.阿拉善块体作为华北克拉通西部块体的一部分,其西部地壳厚度约50 km,而东部约45 km,推测其克拉通性质可能只在其与鄂尔多斯相连的中东部残留.鄂尔多斯块体西南缘地壳厚度约45~50 km,其块体内部则约42~43 km,表明六盘山断裂带附近岩石圈结构由于受到青藏高原东北缘的挤压作用而与鄂尔多斯块体内部存在差异.研究区地壳厚度与高程之间具有较好的相关性,表明地壳整体上处于相对均衡的状态,但在祁连山造山带和西秦岭造山带东部的局部区域,地壳可能处于不均衡的状态.
致谢感谢所有参与中国地震科学探测台阵项目的规划者和实施者为确保获取高质量的地震数据付出的努力,感谢中国地震局地球物理研究所“地震科学探测台阵数据中心”为本研究提供地震波形数据1) ,感谢评审专家对本文完善和改进提出的宝贵意见.
1) 喜马拉雅地震科学台阵.2011.中国地震科学探测台阵波形数据—喜马拉雅计划.中国地震局地球物理研究所.
| An M J, Shi Y L. 2006. Lithospheric thickness of the Chinese continent. Phys. Earth Planet. Inter., 159(3-4): 257-266. DOI:10.1016/j.pepi.2006.08.002 | |
| Bi B T, Hu X Y, Li L Q, et al. 2016. Multi-scale analysis to the gravity field of the northeastern Tibetan plateau and its geodynamic implications. Chinese J. Geophys. , 59(2): 543-555. DOI:10.6038/cjg20160213 | |
| Chang L J, Ding Z F, Wang C Y. 2016. Upper mantle anisotropy beneath the northern segment of the north-south tectonic belt in China. Chinese J. Geophys. , 59(11): 4035-4047. DOI:10.6038/cjg20161109 | |
| Chang L J, Wang C Y, Ding Z F. 2011. Upper mantle anisotropy in the Ordos Block and its margins. Science China Earth Sciences, 54(6): 888-900. DOI:10.1007/s11430-010-4137-2 | |
| Chen M, Huang H, Yao H J, et al. 2014. Low wave speed zones in the crust beneath SE Tibet revealed by ambient noise adjoint tomography. Geophys. Res. Lett., 41(2): 334-340. DOI:10.1002/2013GL058476 | |
| Christensen N I. 1996. Poisson's ratio and crustal seismology. J. Geophys. Res., 101(B2): 3139-3156. DOI:10.1029/95JB03446 | |
| Clark M K, Royden L H. 2000. Topographic ooze: Building the eastern margin of Tibet by lower crustal flow. Geology, 28(8): 703-706. DOI:10.1130/0091-7613(2000)28<703:TOBTEM>2.0.CO;2 | |
| Deng Y F, Shen W S, Xu T, et al. 2015. Crustal layering in northeastern Tibet: a case study based on joint inversion of receiver functions and surface wave dispersion. Geophys. J. Int., 203(1): 692-706. DOI:10.1093/gji/ggv321 | |
| England P, Houseman G. 1986. Finite strain calculations of continental deformation: 2. Comparison with the India-Asia Collision Zone. J. Geophys. Res., 91(B3): 3664-3676. DOI:10.1029/JB091ib03p03664 | |
| Galvé A, Hirn A, Mei J, et al. 2002. Modes of raising northeastern Tibet probed by explosion seismology. Earth Plant. Sci. Lett., 203(1): 35-43. DOI:10.1016/S0012-821X(02)00863-4 | |
| Gao R, Wang H, Yin A, et al. 2013. Tectonic development of the northeastern Tibetan Plateau as constrained by high-resolution deep seismic-reflection data. Lithosphere, 5(6): 555-574. DOI:10.1130/L293.1 | |
| Guo H L, Ding Z F, Xu X M. 2017. Upper mantle structure beneath the northern South-Nouth Seismic Zone from teleseismic traveltime data. Chinese J. Geophys. , 60(1): 86-97. DOI:10.6038/cjg20170108 | |
| He R, Shang X, Yu C, et al. 2014. A unified map of Moho depth and Vp/Vs ratio of continental China by receiver function analysis. Geophys. J. Int., 199(3): 1910-1918. DOI:10.1093/gji/ggu365 | |
| Huang Z C, Xu M J, Wang L S, et al. 2008. Shear wave splitting in the southern margin of the Ordos Block, north China. Geophys. Res. Lett., 35: L19301. DOI:10.1029/2008GL035188 | |
| Huang Z X, Li H Y, Xu Y. 2013. Lithospheric S-wave velocity structure of the North-South Seismic Belt of China from surface wave tomography. Chinese J. Geophys. , 56(4): 1121-1131. DOI:10.6038/cjg20130408 | |
| Huang Z X, Li H Y, Xu Y. 2014. Lithospheric S-wave velocity structure of west China and neighboring areas from surface wave tomography. Chinese J. Geophys. , 57(12): 3994-4004. DOI:10.6038/cjg20141212 | |
| Jia S X, Zhang X K. 2008. Study on the crust phases of deep seismic sounding experiments and fine crust structures in the northeast margin of Tibetan plateau. Chinese J. Geophys. , 51(5): 1431-1443. | |
| Li H Y, Li S, Song X D, et al. 2012. Crustal and uppermost mantle velocity structure beneath northwestern China from seismic ambient noise tomography. Geophys. J. Int., 188(1): 131-143. DOI:10.1111/gji.2012.188.issue-1 | |
| Li X F, Santosh M, Cheng S H, et al. 2015. Crustal structure and composition beneath the northeastern Tibetan plateau from receiver function analysis. Phys. Earth Planet. Inter., 249: 51-58. DOI:10.1016/j.pepi.2015.10.001 | |
| Li Y, Pan J, Wu Q, et al. 2016. Lithospheric structure beneath the Northeastern Tibetan Plateau and the western Sino-Korea Craton revealed by Rayleigh-wave tomography. Geophys. J. Int., in press. | |
| Li Y H, Gao M T, Wu Q J. 2014. Crustal thickness map of the Chinese mainland from teleseismic receiver functions. Tectonophysics, 611: 51-60. DOI:10.1016/j.tecto.2013.11.019 | |
| Li Y H, Wu Q J, An Z H, et al. 2006. The Poisson ratio and crustal structure across the NE Tibetan Plateau determined from receiver functions. Chinese J. Geophys. , 49(5): 1359-1368. | |
| Ligorría J P, Ammon C J. 1999. Iterative deconvolution and receiver-function estimation. Bull. Seismol. Soc. Am., 89(5): 1395-1400. | |
| Liu M J, Mooney W D, Li S L, et al. 2006. Crustal structure of the northeastern margin of the Tibetan plateau from the Songpan-Ganzi terrane to the Ordos basin. Tectonophysics, 420(1-2): 253-266. DOI:10.1016/j.tecto.2006.01.025 | |
| Liu Q M, Zhao J M, Lu F, et al. 2014. Crustal structure of northeastern margin of the Tibetan Plateau by receiver function inversion. Science China Earth Sciences, 57(4): 741-750. DOI:10.1007/s11430-013-4772-5 | |
| Molnar P, Tapponnier P. 1975. Cenozoic tectonics of Asia: Effects of a continental collision. Science, 189(4201): 419-426. DOI:10.1126/science.189.4201.419 | |
| Pan S Z, Niu F L. 2011. Large contrasts in crustal structure and composition between the Ordos plateau and the NE Tibetan plateau from receiver function analysis. Earth Planet. Sci. Lett., 303(3-4): 291-298. DOI:10.1016/j.epsl.2011.01.007 | |
| Royden L H, Burchfiel B C, Van der Hilst R D. 2008. The geological evolution of the Tibetan Plateau. Science, 321(5892): 1054-1058. DOI:10.1126/science.1155371 | |
| Shen X Z, Zhou Y Z, Zhang Y S, et al. 2014. Receiver function structures beneath the deep large faults in the northeastern margin of the Tibetan Plateau. Tectonophysics, 610: 63-73. DOI:10.1016/j.tecto.2013.10.011 | |
| Si X, Teng J W, Liu Y S, et al. 2016. Crust structure of the Qinling orogenic and the region on its north and south margins from teleseismic receiver function. Chinese J. Geophys. , 59(4): 1321-1334. DOI:10.6038/cjg20160414 | |
| Tommasi A, Gibert B, Seipold U, et al. 2001. Anisotropy of thermal diffusivity in the upper mantle. Nature, 411(6839): 783-786. DOI:10.1038/35081046 | |
| Tong W W, Wang L S, Mi N, et al. 2007. Receiver function analysis for seismic structure of the crust and uppermost mantle in the Liupanshan area, China. Science in China Series D: Earth Sciences, 50(S2): 227-233. DOI:10.1007/s11430-007-6008-z | |
| Vergne J, Wittlinger G, Hui Q, et al. 2002. Seismic evidence for stepwise thickening of the crust across the NE Tibetan plateau. Earth Plant. Sci. Lett., 203(1): 25-33. DOI:10.1016/S0012-821X(02)00853-1 | |
| Wang C, Li Y, Lou H. 2016. Issues on crustal and upper-mantle structures associated with geodynamics in the northeastern Tibetan Plateau. Chin. Sci. Bull. , 61(20): 2239-2263. DOI:10.1360/N972016-00160 | |
| Wang C Y, Sandvol E, Zhu L, et al. 2014a. Lateral variation of crustal structure in the Ordos block and surrounding regions, North China, and its tectonic implications. Earth Planet. Sci. Lett., 387: 198-211. DOI:10.1016/j.epsl.2013.11.033 | |
| Wang C Y, Wu J P, Lou H, et al. 2003. P-wave crustal velocity structure in western Sichuan and eastern Tibetan region. Sci. China Ser. D-Earth Sci., 46(S2): 254-265. | |
| Wang C Y, Yang W C, Wu J P, et al. 2015. Study on the lithospheric structure and earthquakes in North-South Tectonic Belt. Chinese J. Geophys. , 58(11): 3867-3901. DOI:10.6038/cjg20151101 | |
| Wang H Y, Gao R, Zeng L S, et al. 2014b. Crustal structure and Moho geometry of the northeastern Tibetan plateau as revealed by SinoProbe-02 deep seismic-reflection profiling. Tectonophysics, 636: 32-39. DOI:10.1016/j.tecto.2014.08.010 | |
| Wang Q, Niu F L, Gao Y, et al. 2016. Crustal structure and deformation beneath the NE margin of the Tibetan plateau constrained by teleseismic receiver function data. Geophys. J. Int., 204(1): 167-179. | |
| Wang Q S, Teng J W, Zhang Y Q, et al. 2013. Discussion on gravity anomalies and crustal structure of the Middle Qinling Mountains. Chinese J. Geophys. , 56(12): 3999-4008. DOI:10.6038/cjg20131206 | |
| Wei Z G, Chu R S, Chen L. 2015. Regional differences in crustal structure of the North China Craton from receiver functions. Science China Earth Science, 58(12): 2200-2210. DOI:10.1007/s11430-015-5162-y | |
| Xu Q, Zhao J M, Pei S P, et al. 2013a. Distinct lateral contrast of the crustal and upper mantle structure beneath northeast Tibetan plateau from receiver function analysis. Phys. Earth Plant. Inter., 217: 1-9. DOI:10.1016/j.pepi.2013.01.005 | |
| Xu S B, Mi N, Xu M J, et al. 2014. Crustal structures of the Weihe graben and its surroundings from receiver functions. Science China Earth Sciences, 57(2): 372-378. DOI:10.1007/s11430-013-4719-x | |
| Xu X M, Ding Z F, Shi D N, et al. 2013b. Receiver function analysis of crustal structure beneath the eastern Tibetan plateau. J. Asian Earth Sci., 73: 121-127. DOI:10.1016/j.jseaes.2013.04.018 | |
| Xu Z J, Song X D. 2010. Joint inversion for crustal and Pn velocities and Moho depth in Eastern Margin of the Tibetan Plateau. Tectonophysics, 491(1-4): 185-193. DOI:10.1016/j.tecto.2009.11.022 | |
| Yang Y J, Ritzwoller M H, Zheng Y, et al. 2012. A synoptic view of the distribution and connectivity of the mid-crustal low velocity zone beneath Tibet. J. Geophys. Res., 117(B4): B04303. | |
| Yao Z Y, Wang C Y, Zeng R S, et al. 2014. Crustal structure in western Qinling tectonic belt and its adjacent regions deduced from receiver functions. Acta Seismologica Sinica , 36(1): 1-19. DOI:10.3969/j.issn.0253-3782.2014.01.001 | |
| Ye Z, Gao R, Li Q S, et al. 2015. Seismic evidence for the North China plate underthrusting beneath northeastern Tibet and its implications for plateau growth. Earth Planet. Sci. Lett., 426: 109-117. DOI:10.1016/j.epsl.2015.06.024 | |
| Zandt G, Ammon C J. 1995. Continental crust composition constrained by measurements of crustal Poisson's ratio. Nature, 374(6518): 152-154. DOI:10.1038/374152a0 | |
| Zhang H S, Gao R, Tian X B, et al. 2015. Crustal S wave velocity beneath the northeastern Tibetan plateau inferred from teleseismic P wave receiver functions. Chinese J. Geophys. , 58(11): 3982-3992. DOI:10.6038/cjg20151108 | |
| Zhang H S, Teng J W, Tian X B, et al. 2013. Lithospheric thickness and upper mantle anisotropy beneath the northeastern Tibetan Plateau. Chinese J. Geophys. , 56(2): 459-471. DOI:10.6038/cjg20130210 | |
| Zhang Q, Sandvol E, Ni J, et al. 2011a. Rayleigh wave tomography of the northeastern margin of the Tibetan Plateau. Earth Planet. Sci. Lett., 304(1-2): 103-112. DOI:10.1016/j.epsl.2011.01.021 | |
| Zhang X K, Jia S X, Zhao J R, et al. 2008. Crustal structures beneath West Qinling-East Kunlun orogen and its adjacent area-Results of wide-angle seismic reflection and refraction experiment. Chinese J. Geophys. , 51(2): 439-450. | |
| Zhang Z J, Klemperer S, Bai Z M, et al. 2011b. Crustal structure of the Paleozoic Kunlun orogeny from an active-source seismic profile between Moba and Guide in East Tibet, China. Gondwana Res., 19(4): 994-1007. DOI:10.1016/j.gr.2010.09.008 | |
| Zheng D, Li H Y, Shen Y, et al. 2016. Crustal and upper mantle structure beneath the northeastern Tibetan Plateau from joint analysis of receiver functions and Rayleigh wave dispersions. Geophys. J. Int., 204(1): 583-590. DOI:10.1093/gji/ggv469 | |
| Zhu L P, Kanamori H. 2000. Moho depth variation in southern California from teleseismic receiver functions. J. Geophys. Res., 105(B2): 2969-2980. DOI:10.1029/1999JB900322 | |
| 毕奔腾, 胡祥云, 李丽清, 等. 2016. 青藏高原东北部多尺度重力场及其地球动力学意义. 地球物理学报, 59(2): 543–555. DOI:10.6038/cjg20160213 | |
| 常利军, 丁志峰, 王椿镛. 2016. 南北构造带北段上地幔各向异性特征. 地球物理学报, 59(11): 4035–4047. DOI:10.6038/cjg20161109 | |
| 常利军, 王椿镛, 丁志峰. 2011. 鄂尔多斯块体及周缘上地幔各向异性研究. 中国科学:地球科学, 41(5): 686–699. | |
| 郭慧丽, 丁志峰, 徐小明. 2017. 南北地震带北段的远震P波层析成像研究. 地球物理学报, 60(1): 86–97. DOI:10.6038/cjg20170108 | |
| 黄忠贤, 李红谊, 胥颐. 2013. 南北地震带岩石圈S波速度结构面波层析成像. 地球物理学报, 56(4): 1121–1131. DOI:10.6038/cjg20130408 | |
| 黄忠贤, 李红谊, 胥颐. 2014. 中国西部及邻区岩石圈S波速度结构面波层析成像. 地球物理学报, 57(12): 3994–4004. DOI:10.6038/cjg20141212 | |
| 嘉世旭, 张先康. 2008. 青藏高原东北缘深地震测深震相研究与地壳细结构. 地球物理学报, 51(5): 1431–1443. | |
| 李永华, 吴庆举, 安张辉, 等. 2006. 青藏高原东北缘地壳S波速度结构与泊松比及其意义. 地球物理学报, 49(5): 1359–1368. | |
| 刘启民, 赵俊猛, 卢芳, 等. 2014. 用接收函数方法反演青藏高原东北缘地壳结构. 中国科学:地球科学, 44(4): 668–679. | |
| 司芗, 滕吉文, 刘有山, 等. 2016. 秦岭造山带与南北相邻地带远震接收函数与地壳结构. 地球物理学报, 59(4): 1321–1334. DOI:10.6038/cjg20160414 | |
| 童蔚蔚, 王良书, 米宁, 等. 2007. 利用接收函数研究六盘山地区地壳上地幔结构特征. 中国科学D辑:地球科学, 37(增刊): 193–198. | |
| 王椿镛, 李永华, 楼海. 2016. 与青藏高原东北部地球动力学相关的深部构造问题. 科学通报, 61(20): 2239–2263. | |
| 王椿镛, 吴建平, 楼海, 等. 2003. 川西藏东地区的地壳P波速度结构. 中国科学D辑, 33(增刊): 181–189. | |
| 王椿镛, 杨文采, 吴建平, 等. 2015. 南北构造带岩石圈结构与地震的研究. 地球物理学报, 58(11): 3867–3901. DOI:10.6038/cjg20151101 | |
| 王谦身, 滕吉文, 张永谦, 等. 2013. 中秦岭地带重力异常特征及地壳结构的探榷. 地球物理学报, 56(12): 3999–4008. DOI:10.6038/cjg20131206 | |
| 危自根, 储日升, 陈凌. 2015. 华北克拉通地壳结构区域差异的接收函数研究. 中国科学:地球科学, 45(10): 1504–1514. | |
| 徐树斌, 米宁, 徐鸣洁, 等. 2013. 利用接收函数研究渭河地堑及其周边地壳结构. 中国科学:地球科学, 43(10): 1651–1658. | |
| 姚志祥, 王椿镛, 曾融生, 等. 2014. 利用接收函数方法研究西秦岭构造带及其邻区地壳结构. 地震学报, 36(1): 1–19. DOI:10.3969/j.issn.0253-3782.2014.01.001 | |
| 张洪双, 高锐, 田小波, 等. 2015. 青藏高原东北缘地壳S波速度结构及其动力学含义—远震接收函数提供的证据. 地球物理学报, 58(11): 3982–3992. DOI:10.6038/cjg20151108 | |
| 张洪双, 滕吉文, 田小波, 等. 2013. 青藏高原东北缘岩石圈厚度与上地幔各向异性. 地球物理学报, 56(2): 459–471. DOI:10.6038/cjg20130210 | |
| 张先康, 嘉世旭, 赵金仁, 等. 2008. 西秦岭—东昆仑及邻近地区地壳结构——深地震宽角反射/折射剖面结果. 地球物理学报, 51(2): 439–450. | |
 2017, Vol. 60

