2. 成都理工大学地球探测与信息技术教育部重点实验室, 成都 610059;
3. 成都理工大学地质灾害防治与地质环境保护国家重点实验室, 成都 610059
2. Key Laboratory of Earth Exploration and Information Techniques of Ministry of Education, Chengdu University of Technology, Chengdu 610059, China;
3. State Key Laboratory of Geohazard Prevention and Geoenvironment Protection, Chengdu University of Technology, Chengdu 610059, China
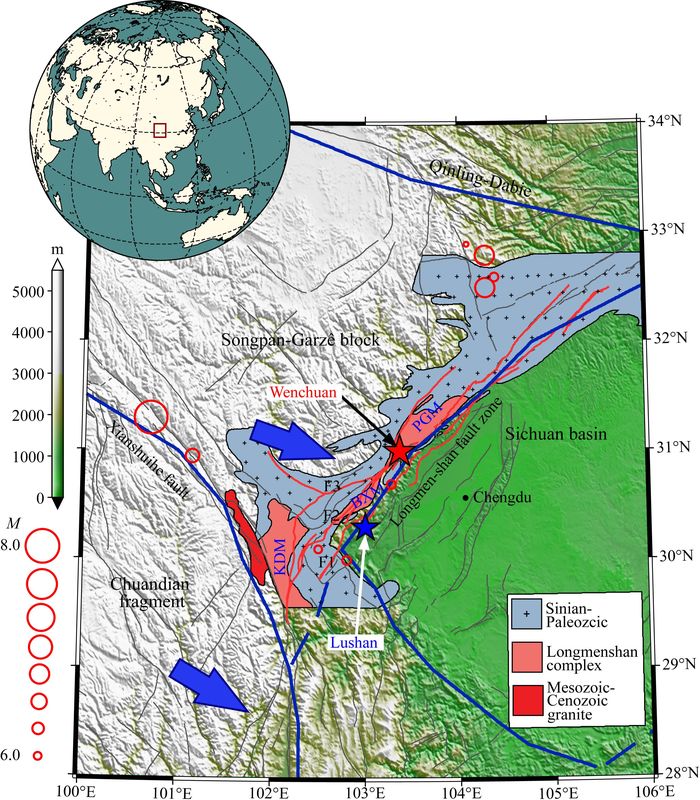
龙门山断裂带是青藏高原东缘的前缘地带,它位于松潘—甘孜地块和四川前陆盆地的结合处(图 1),也是青藏高原地形梯度变化最大、汇聚运动最强烈的造山带(Clark and Royden, 2000; Burchfiel et al., 2008; Wang et al., 2010, 2014a, 2015).由于松潘—甘孜褶皱系在龙门山断裂带与四川盆地倾斜碰撞,沿着断裂带形成了自西南至东北3个北东方向逆冲-走滑断裂,长度达到250~300 km(图 1):包括灌县—江油断裂(前山断裂: F1)、映秀—北川断裂(中央断裂/主断裂: F2), 以及汶川—茂汶断裂(后山断裂: F3).
|
图 1 龙门山断裂带及其周边地区的构造图 灰色阴影区表示龙门山断裂带.红色和蓝色五星分别表示2008年汶川和2013年芦山地震.红色圆圈表示1941年至2013年间发生的强震(M>6.0).红色实线分别表示沿着龙门山断裂带的灌县—江油断裂(前山断裂F1)、映秀—北川断裂(中央断裂F2) 以及汶川—茂汶断裂(后山断裂F3).黑色实线表示其他活动断层,蓝色粗实线表示主要的板块边界(Deng et al., 2002).两个蓝色的箭头分别展示了松潘—甘孜地块和川滇地块相对于四川盆地的运动方向.三个红色的阴影区分别表示彭灌杂岩(PGM)、宝兴杂岩(BXM)和康定杂岩(KDM). Fig. 1 Schematic illustration of tectonics of the Longmenshan fault zone (LMFZ) on topographic map Gray shaded region indicates the Longmenshan orogenic belt. Red and blue stars show the epicenters of the Wenchuan (MS8.0) and Lushan (MS7.0) earthquakes, respectively. Opened red circles show the large historic earthquakes (MS>6.0) occurred from 1941 to 2013. Red solid lines indicate the fore Fault (F1), central Fault (F2) and rear Fault (F3) along the LMFZ and gray solid lines show other active faults. Bold blue solid lines indicate the main tectonic boundaries (Deng et al., 2002). Legend of the geologic units is shown in the lower-right corner of the map. Two blue arrows indicate the directions of the Sonpan-Garzê block and the Chuandian fragment related to the Sichuan basin, respectively. Red shaded regions indicate the Pengguan Massif (PGM), theBaoxing Massif (BXM) and the Kangding Massif (KDM). A red box on the insert map shows the study region. |
在过去几十年内,地质学家、测地学家和地球物理学家对龙门山地区的隆升做过许多研究,涉及地震波速度、板块运动速率梯度、莫霍面起伏、地壳应力变化和造山带演化过程(Royden et al., 1997; Burchfiel, 2004; Meade, 2007; Zhang et al., 2009; Lei and Zhao, 2009; Huang et al., 2009; Wang et al., 2009, 2010, 2011, 2014b; Bai et al., 2010).基于这些研究的结果,对于高原的隆升机制提出了两种主要的假设:第一种认为高原隆升是通过地壳缩短以及相关地块之间的剪切作用形成的(Tapponnier et al., 2000; Meade, 2007);另一种则认为, 龙门山造山带与下地壳的流体压力抬升所致(Royden et al., 1997; Burchfiel, 2004; Hubbard and Shaw, 2009; Huang et al., 2009; Wang et al., 2010, 2014b).尽管前人的研究表明龙门山碰撞前缘的地壳缩短作用是有限的( < 3 mm·a-1)(Shen et al., 2005; Meade, 2007),但是2008年5月12日在龙门山断裂带中段发生了灾难性的汶川8.0级地震,在相隔不到5年和相距不到100 km的龙门山断裂带的南端,2013年4月20日又发生了7.0级芦山地震,使人们再次重视其深部构造和地壳形变与地震破裂过程的联系.本研究通过三维深部结构成像,就上述问题开展较为深入分析,为更好地理解有关科学问题提供地球物理证据.
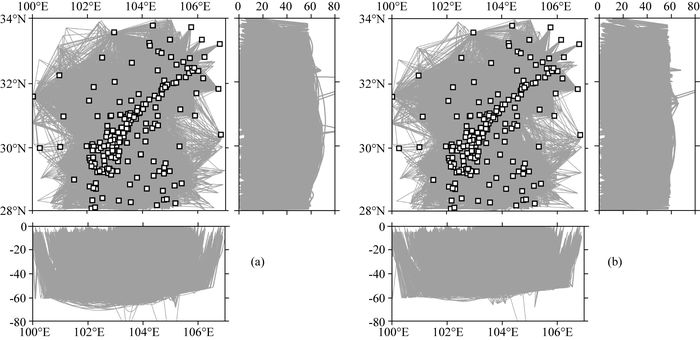
2 数据和方法为了获得龙门山断裂带及周边地区地壳的高分辨率速度结构,我们使用了大量的、高质量的地震P波与S波走时数据.数据包括两组:其中一组数据包括7854个发生在2000年1月至2007年12月的地震(图 2中黑色叉);另一组数据包括23288条2008年汶川(13078) 和2013年芦山(10210) 地震的余震数据.以上两组地震数据都经过严格筛选.对于第一组地震数据, 主要筛选条件包括: (1) 震源深度≤ 60 km,震级>1.0级的区域地震; (2) 震中距为0~1.8°的Pg与Sg震相,以及震中距为3°~6°的Pn与Sn数据;(3) 所筛选的地震都被8个及以上台站记录.对第二组地震数据主要筛选汶川和芦山地震余震的Pg和Sg震相数据.两组地震数据的绝对走时残差分别介于-2.5 s~+2.5 s之间的P和Pn震相以及-3.0 s~+3.0 s的S和Sn震相.筛选后数据总共包括来自于31142条地震事件的286673 P和Pn震相和261313 S和Sn震相.因为本研究采用了大量的Pn和Sn震相数据,这些来自于上地幔边界的折射震相提高了研究区域下地壳的射线覆盖和射线交叉密度(图 3),保证了对下地壳成像的分辨率.

|
图 2 三维地震和地震台站分布图 黑色十字表示发生在2000年1月至2007年12月其间的地震,蓝色和黄色十字分别表示2008年汶川地震和2013年芦山地震余震.绿色三角形表示184个固定台站,红色方块表示50个临时台站.黑色实线表示活动断层,黑色直线L1—L5表示图 6的剖面位置. Fig. 2 Locations of earthquakes and seismic stations used in this study Black, blue and yellow crosses show 31142 earthquakes in three-dimensional distribution used for seismic tomography. Two red stars indicate the 2013 MS7.0 Lushan and 2008 MS8.0 Wenchuan epicenters, respectively. Black solid lines show active faults. Yellow and red crosses show the 2013 Lushan and 2008 Wenchuan aftershocks, respectively. Black crosses indicate the 7854 background earthquakes from 1 January 2000 to 14 December 2007. Violet squares denote the 50 temporal seismic stations installed following the 2013 MS7.0 Lushan earthquake. Green triangles show the 184 permanent stations deployed by the Earthquake Bureaus of Sichuan and Yunnan provinces and the Institute of Geophysics of the China Earthquake Administration (IGCEA). Blacksolid lines L1—L5 indicate the profile locations shown in Fig. 6. |
|
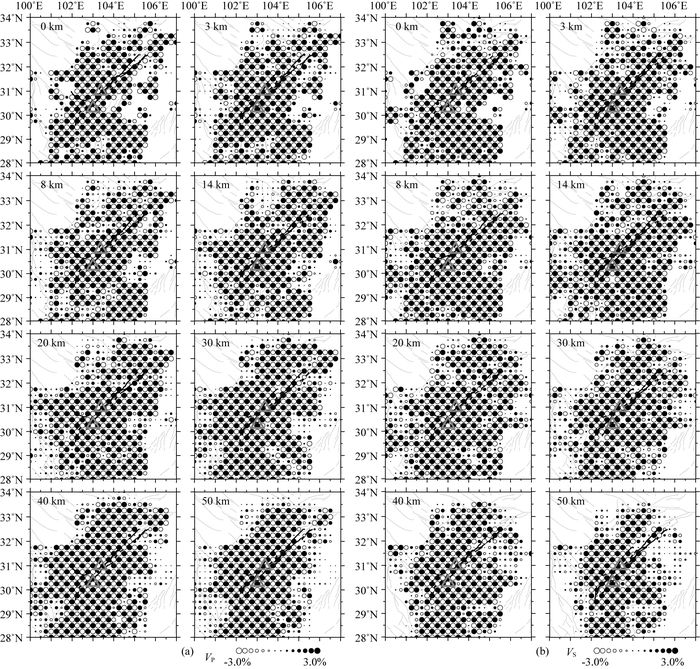
图 6 棋盘分辨率测试. (a) P波和(b) S波.在分辨率测试中,水平网格间距为0.25°,黑色实线表示活动断层,两个三角形分别表示2008年汶川和2013年芦山地震震源位置 Fig. 6 Checkerboard resolution tests (CRTs) for (a) P-wave and (b) S-waves at each depth with a grid separation of 0.25° in horizontal direction along the Longmenshan fault zone. Black solid lines indicate the active faults. Two open triangles indicate the 2008 Wenchuan and 2013 Lushan epicenter, respectively. The scale of the velocity perturbation is shown on the right-hand side of the map |
|
图 3 纵横波三维射线分布图. (a)纵波射线;(b)横波射线.白色方框表示地震台站 Fig. 3 3-D distributions of P-and S-waves. (a) P-wave and (b) S-wave. Squares indicate seismic stations recorded the travel times |
反演过程共有234个地震台记录的数据参加了计算,包括184个四川地震局、云南地震局及中国地震局地球物理研究所(IGCEA)的固定台站,以及芦山地震后由四川地震局布置的50个临时台站.
一维初始速度模型来自于接收函数和地震层析成像研究结果(Xu et al., 2007; Wang et al., 2009, 2014b),不但考虑了地层厚度的横向不均匀性,而且也考虑了莫霍面的深度变化.鉴于台站密度、数据密度以及射线覆盖密度对成像分辨率的影响,网格模型的水平间距大约为25 km(0.25°),垂向间距为5~10 km.为了选择适合反演的最佳阻尼参数, 我们利用不同数量的地震震相数据和不同的阻尼参数进行了多次反演实验.综合考虑一维初始速度模型和网格模型的参数设置以及走时残差的收敛情况,确定的最终反演的最佳阻尼参数为16.0.
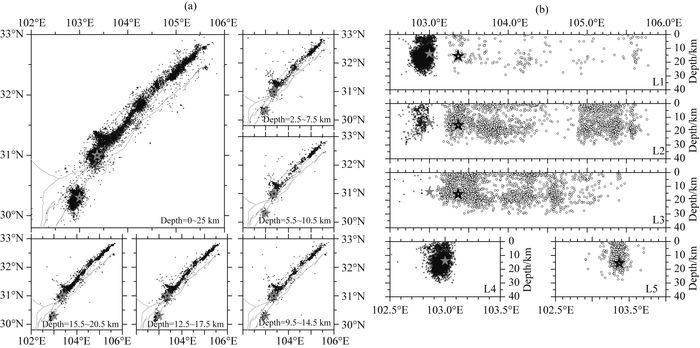
为了提高震源的精确度, 采用双差定位法对地震事件进行了重新定位(Waldhauser and Ellsworth, 2000; Wang and Zhao, 2006a, b).在双差定位过程中,分别采用了源自173668个P波事件的1434108条相对走时残差,以及源自168563个S波事件的1112576条相对走时残差.其中超过95.6%的背景事件(总计7854) 和超过97.9%的余震事件(总计23288) 都经过了双差重新定位,而未被双差重新定位的地震,都采用传统的定位流程进行了定位处理(Zhao et al., 1996).图 4是采用双差定位后的2008年汶川和2013年芦山地震的余震空间分布, 定位后走时残差较定位前具有明显的收敛(图 5).对震源重新定位后,采用地震层析成像方法(Zhao et al., 1996)开展三维速度反演.
|
图 4 采用双差定位后余震的分布 (a)沿龙门山断裂带不同深度的地震分布; (b)沿着不同剖面大约10 km厚度的地震分布剖面(剖面L1—L5的位置表示在图 2中).在(b)中,圆圈和黑色叉分别表示汶川和芦山地震的余震.两个五星表示2008年汶川和2013年芦山地震主震.黑色实线表示活动断层. Fig. 4 Examples of the hypocentral distribution of earthquakes relocated by double-difference (DD) location along the Longmenshan fault belt The focal depths of the plan views are shown on each map and the locations of the cross sections (L1—L5) are indicated in Fig. 2. Black crosses and circles indicate the 2013 Lushan and 2008 Wenchuan earthquake aftershocks. Two solid circles indicate the 2008 Wenchuan and 2013 Lushan earthquakes. Black solid lines denote the active faults. |

|
图 5 地震定位和反演前后走时残差变化图 Fig. 5 Travel time residuals before and after DD location and seismic tomographic inversion of the P and S waves |
在三维层析成像反演之前进行了棋盘分辨率测试(CKBs),以便于确定反演结果的可靠性(Zhao et al., 1992).在测试中,采用的台站数、事件数、网格模型、阻尼系数和射线路径都与实际的反演过程保持一致.棋盘分辨率测试的结果表明,在龙门山断裂带及两侧的区域,棋盘参数(速度正负值和振幅值)都能被很好地分辨,证明这些区域的反演结果中的异常是可靠的(图 6).由于沿龙门山断裂带的高速和低速异常块体的大小(在水平方向上为30~50 km)大于网格点间距(~25 km), 而且棋盘分辨率测试结果已经证实了正负速度异常和振幅都能很好地恢复(图 6).因此,我们认为龙门山断裂带下方反演获得的高速和低速异常是真实的.另外,反演后的走时残差较之反演前明显减小,这也进一步保证了反演结果的可靠性(图 5).
4 结果分析与讨论 4.1 龙门山及周边区域深部结构特征图 7给出了地壳P波速度(a)、S波速度(b)和泊松比参数(c)在不同深度的水平切片.在上地壳3~14 km深度,四川前陆盆地表现为低速度和高泊松比,而松潘甘孜地块则表现为相反的特征.在30~50 km处, 松潘甘孜地块西部靠近鲜水河断裂带附近的位置存在强低速异常,这与前期研究中揭示的存在低速度和高电导率异常一致(Huang et al., 2009, Bai et al., 2010; Wang et al., 2012).另外,近期的研究在龙门山及周边地区发现了相似的地震波速度和泊松比异常特征(Wang et al., 2009, 2010, 2011, 2012;Lei and Zhao, 2009; Pei et al., 2010).四川盆地浅层的低速度和高泊松比异常特征反映了在盆地存在较厚的中生代与古生代沉积层,特别是在靠近龙门山断裂带的前陆盆地,沉积层厚度达到了10 km以上.相比之下,松潘—甘孜地块的高速异常主要位于上地壳(图 7).强烈的对比显示,在浅层龙门山断裂带可能是四川盆地和松潘—甘孜地块的边界,随着深度增加,这一边界特征逐渐消失.从四川盆地的低速异常到松潘—甘孜地块的高速异常的速度构造特征,也在前人关于龙门山断裂带上地壳的三维地震成像研究结果中出现(Huang et al., 2002; Wang et al., 2003; Lei and Zhao, 2009; Xu et al., 2010; Pei et al., 2010),这也证明了本次反演结果的可靠性.值得注意的是,在40~50 km深度的速度和泊松比图像上看到了一个近似“Y”字形低速异常区域,该异常体与鲜水河断裂、龙门山断裂及安宁河断裂组成的Y形断裂系统相似,只是位置略微有所偏离.我们认为,这一低速异常构造可能与这些断裂带深部流体侵入或与下地壳的部分熔融有关.在下地壳,四川盆地为显著的高速度和低泊松比异常,松潘甘孜地块则表现为低速度和高泊松比异常.它们分别与四川盆地古老和稳定的扬子克拉通以及青藏高原下地壳存在韧性变形(熔融或部分熔融)相对应.

|
图 7 不同深度的地震波速度(VP, VS)和泊松比(σ)水平切片 (a)纵波速度剖面,(b)横波速度剖面,(c)泊松比参数剖面,切片深度表示在对应的切片的右下角.红色表示低速/高泊松比和蓝色表示高速/低泊松比.白色圆点表示沿着每个深度5 km厚度内的地震.黑色圆圈表示地壳中发生的大地震M>6.0).黑色实线和白色粗实线分别表示活动断层和板块边界.红色实线表示龙门山断裂带的三条主要逆冲断裂.速度和泊松比扰动及强震震级范围表取在图的右侧. Fig. 7 Plan views of seismic velocity images (in percentage) at each depth determined using local arrival time data (a) P-wave velocity, (b) S-wave velocity and (c) Poisson' ratio. The depth of each layer is shown on the lower-right corner of each map. Red denotes slow velocity/high Poisson' ratio and blue represents fast velocity/low Poisson^ ratio. White dots show the locations of earthquakes within a zone of thickness of 5 km along each depth. Open black circles denote large crustal earthquakes (M>6.0). Gray and white solid lines indicate active faults and plate boundaries, respectively. Red lines indicate three reverse-thrust faults along the Longmenshan fault belt. Velocity perturbation and magnitude scales for large crustal earthquakes are shown to the right of the map. |
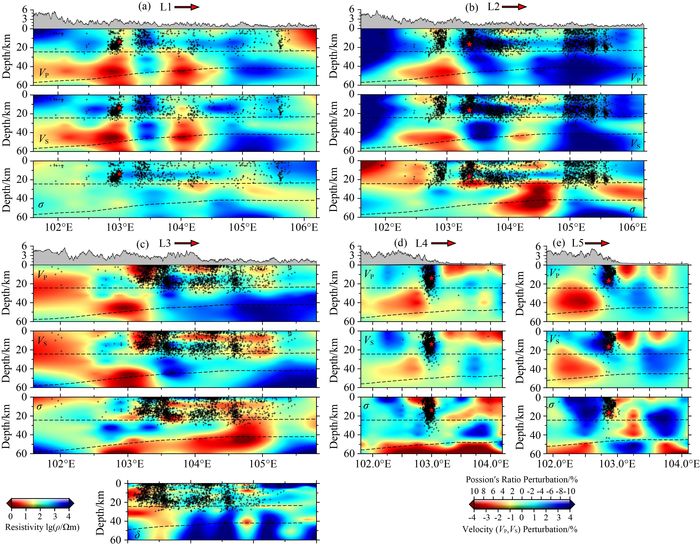
图 8给出了三条平行于龙门山断裂带和两条横穿汶川和芦山地震震源区的剖面.剖面L1沿着灌县—江油断裂(前山断裂),剖面L2沿着映秀—北川断裂(中央主断裂), 剖面L3沿着汶川—茂汶断裂(后山断裂).剖面L4横穿过2013年芦山地震, 剖面L5通过了2008年汶川地震震源位置.2008年汶川地震和2013年芦山地震均发生在高速度地壳发震层,但是泊松比图像稍有不同,汶川地震震源位于高泊松比区域,而芦山地震则发生在高-低泊松比过渡带(图 8d, 8e).在两个地震中间有一低速度、高泊松比和高电导率的区域(图 8a, 8b).从余震分布来看,汶川地震的大部分余震发生在沿着北东方向的高速度和低泊松比块体,而芦山地震的余震主要集中在震源区的高速度和高泊松比过渡区域(图 4).
|
图 8 不同位置的速度和泊松比垂直剖面图 (a) L1沿着龙门山前山断裂;(b) L2沿中央断裂;(c) L3沿后山断裂;(d) L4横穿2013年芦山地震;(e) L5穿过2008年汶川地震.黑十字表示沿着每一剖面5~10 km范围内的地震.虚线表示Conrad和Moho面深度.红色表示低速/高泊松比,蓝色表示高速/低泊松比.两个红色五星分别表示2008年汶川和2013年芦山地震.剖面位置如图 2所示. Fig. 8 Vertical cross-sections of velocity (VP, VS) images and Poisson′s ratio (σ) along the lines shown on Fig. 2 (a) Along fore fault; (b) Along central fault; (c) Along rear fault; (d) L4; (e) L5. Black crosses denote background seismicity with a 5~10 km bound for each profile. Two dashed lines show the velocity discontinuities of the Conrad and Moho boundaries. Red indicates low velocity/high Poisson′s ratio whilst blue denotes high velocity/low Poisson′s ratio. Two red stars indicate the 2008 Wenchuanand 2013 Lushan earthquakes. |
前人研究指出,在青藏高原东缘的下地壳中广泛地存在韧性变形(如熔融或部分熔融)(Royden et al., 1997; Bai et al., 2010; Wang et al., 2011, 2014a, 2015),所以,中下地壳的低速异常,高泊松比与高电导率异常可能与物质流动有关.从深部结构来看,在断裂带的边界处,两个低速、高电导率异常体与地震空缺带之间具有良好的对应关系(图 8b).这说明由于韧性变形存在,这些区域内地壳强度弱于周边孕震带.根据余震的空间分布(图 4), 汶川地震的余震大都位于映秀—北川断裂(中央主断裂)和汶川—茂汶断裂(图 8b, 8c),而发生在灌县—江油断裂的余震较少(图 8a).因为余震分布是地震破裂过程空间表征,因此,汶川地震破裂过程主要发生在中央主断层以及后山断裂,而前山断裂的破裂较弱.
4.2 地壳形变与地震成因综合三维速度和泊松比模型以及前人的电阻率结构分析结果, 我们认为龙门山断裂带地壳形变的主要因素与下地壳结构异常及热软流圈产生的韧性变形以及龙门山断裂带下方的流体侵入有关.一方面,四川盆地下古老坚硬的岩石圈并向西斜向挤入到龙门山断裂带下方.在它的作用下,青藏高原下地壳和上地幔中的物质被挤入到龙门山断裂带下方(Hubbard and Shaw, 2009; Wang et al., 2010, 2014b), 产生的压力导致地壳抬升并使地形变得陡峭(Royden et al., 2008; Hubbard and Shaw, 2009).另外,前人的研究揭示了龙门山断裂带、四川盆地和青藏高原的上、下地壳具有不同厚度(Zhang et al., 2009),青藏高原的下地壳和上地幔为低速度和高泊松比异常,说明在高原深部存在部分熔融或熔融.在地壳增厚区域,上地幔与下地壳的韧性变形使地壳中的物质发生了运移和重组,使高原物质向东北和东南方向运移和扩张,部分物质(如熔融体或流体)被挤入到龙门山断裂带的脆弱区域(Royden et al., 1997; Clark and Royden, 2000;Kind et al., 1996; Wei et al., 2001; Sun et al., 2003; Bai et al., 2010).我们认为,沿着龙门山断裂带的低速、高泊松比和高电导率异常,主要是由于青藏高原下地壳的部分熔融或流体物质渗入到龙门山断裂带下方,进而降低了地震波的速度,增加了岩石泊松比和电导率,引起地壳和岩石圈的形变.据此推测, 由于上地壳受下地壳物质运动而大范围抬升,并未发生横向的错动, 因此地表并没有出现大规模的横向缩短(Hubbard and Shaw, 2009),从而解释了GPS观测到的龙门山断裂带大范围抬升及小范围横向运动.
青藏高原东缘的中、下地壳中存在两条高电导分布区域(Bai et al., 2010;Wang et al., 2014a),本研究在龙门山断裂带下方低速、高泊松比和高电导率异常区域(图 7)与之前的研究获得的高导体位置相吻合.热学和地球物理模拟分析表明,在松潘—甘孜地块的中地壳的温度为700~800 ℃,下地壳的温度约为1000 ℃,当有流体侵入时,大大地降低了岩石的熔点,足以在下地壳中产生熔融或部分熔融(Hacker et al., 2000; Mechie et al., 2004; Jiménez-Munt et al., 2008).此外,在龙门山地区观测到了强热流, 其幅度从盆地一侧的45 mW·m-2变化至龙门山断裂带附近的75 mW·m-2 (Rui et al., 1999; Pollack et al., 1993).最后,理论模型表明,无论是部分熔融的岩石还是含有自由流体的岩石,当部分熔融或流体在体积上所占比例达到20%时,对地震波速度产生较大影响.在流体所占体积小于10%时,剪切波的速度随着流体体积比的增加而减小,然后在超过10%之后再次增加(Watanabe, 1993).该观点和我们反演获得的速度和泊松比模型具有较好的一致性.温度和热流变化说明,龙门山前缘的含水地质体、热地幔软流物质与龙门山倾斜碰撞系统的综合作用,是下地壳低速和高导异常形成的主要原因.
另外,地质学研究提出了一个带有较薄滑动面的模型,其周围包裹着高度破裂的断裂带(Chester et al., 1993; Sibon, 2003).在该模型下,断层的空隙中由于积累了较高的孔隙压力, 进而影响余震序列的空间分布(Norstro et al., 2005).实验数据表明,在1000 K的温度下,含0.01% H2O的潮湿岩石的电导率比干燥岩石高出几百倍(Nesbitt, 1993;Pommier et al., 2008),对于干燥的固相物质,地壳熔融或部分熔融的温度大约为900~1200 ℃.然而,当地层被流体侵入后,地壳熔融或部分熔融的温度会急剧地下降到700~800 ℃(Hacker et al., 2000; Mechie et al., 2004; Galvé et al., 2006; Jiménez-Munt et al., 2008).以上研究表明,在龙门山断裂带,尽管中、下地壳中的温度还不足以使干燥岩石发生熔融, 但对于存在流体侵入岩石是可能的.同时,流体的存在也会导致岩石的电导率出现量级为1~10 S·m-1的变化(Li et al., 2003).
龙门山断裂带的南、中和北段表现为强烈的各向异性结构(如地震波速度,泊松比和大地电磁等).研究发现,汶川地震和芦山地震的余震主要分布在高速异常区域,在低速度区域只有少量地震分布,这可能和来自青藏高原下地壳的流体不断地侵入到龙门山断裂带的脆弱区有关.在断裂带中,高速异常与大范围的断裂的错动吻合,反映了龙门山中段和北段的断层面之间存在着强烈的耦合作用.我们推测,在汶川地震之前,断层面之间是闭锁的,而地震后是解锁的(Wang et al., 2009, 2011, 2014b, 2015; Pei et al., 2011).这一推断得到了GPS数据的支持:在汶川地震之前,无论是在松潘—甘孜地块还是四川盆地,龙门山断裂带两侧的板块运动是沿东南方向.而在地震后,松潘甘孜地块向东南运动,盆地向西北运动(Wang et al., 2011).地震前后龙门山两侧的板块运动方向发生了较大的改变,可能是断层面耦合与解耦的表征.而断层面间的耦合作用与流体侵入存在密切关系,一旦有流体侵入到孕震层的断裂带中,就会增加岩石的泊松比(汶川地震为高泊松比,芦山地震在高、低之间),显著减弱震源区岩石强度和减小断层面之间的摩擦力,最终改变了局部岩石的剪切应力, 进而触发地震(Kono et al., 2006; Wang and Zhao, 2006b, Wang et al., 2009, 2011, 2015).因此我们认为,流体侵入是2008年汶川和2013年芦山地震产生的关键性因素之一.
5 结论三维地震层析成像和大地电磁资料表明,沿着龙门山断裂带,地震波速度、泊松比和电阻率存在强烈的变化,汶川和芦山地震都发生在高速度和低电导率发震层.整个龙门山断裂带被两个低速、高电阻率异常的含水块体分为三个有鲜明对比的区段,该分段结构的各向异性与同震滑动和余震序列的空间分布具有良好一致性.来自青藏高原下地壳的流体侵入到龙门山断裂带孕震层,导致流体应力增加,减弱了岩石的力学强度和断层面之间摩擦力,从而触发汶川和芦山地震并控制着地震破裂过程.位于龙门山断裂带的两个低速、高电导率区域反映了大量流体侵入到龙门山断裂带的脆弱区域,增加了地壳中的流体压力,减小了岩石的抗压强度,对龙门山断裂带区域的地震触发、同震滑动和塌陷过程起到关键的作用.从松潘—甘孜流出的下地壳物质被四川盆地下方稳定岩石圈阻挡,在龙门山断裂带形成强大的深部应力,该过程引起了地壳的抬升和地表地形的锐化,这可能是引起龙门山断裂带地壳剧烈形变的主要因素之一.
致谢感谢四川省地震局、云南省地震局和国家地震局为本次研究工作提供地震波形和震相资料.感谢赵大鹏教授提供层析成像程序开展本次研究工作.感谢谭皓原和柳存喜帮助部分图件的处理,文章中所涉及到的图件均由GMT制作.
| Bai D H, Unsworth M J, Meju M A, et al. 2010. Crustal deformation of the eastern Tibetan plateau revealed by magnetotelluric imaging. Nat Geosci., 3(5): 358-362. DOI:10.1038/ngeo830 | |
| Burchfiel B C. 2004. 2003 presidential address: New technology, new geological changelings. GAS Today, 14: 4-9. | |
| Burchfiel B C, Royden L H, van der Hilst R D, et al. 2008. A geological and geophysical context for the Wenchuan earthquake of 12 May 2008, Sichuan, People's republic of China. GSA Today, 18(7): 4-11. DOI:10.1130/GSATG18A.1 | |
| Chester F M, Evans J P, Biegel R L. 1993. Internal structure and weakening mechanisms of the San Andreas fault. J. Geophys. Res., 98(B1): 771-786. DOI:10.1029/92JB01866 | |
| Clark M K, Royden L H. 2000. Topographic ooze: Building the eastern margin of Tibet by lower crustal flow. Geology, 28(8): 703-706. DOI:10.1130/0091-7613(2000)28<703:TOBTEM>2.0.CO;2 | |
| Deng Q D, Zhang P Z, Ran Y K, et al. 2002. Basics characteristics of active tectonics of China (in Chinese), Sci. China, Ser. D Earth Sci., 32(12): 1020-1030. | |
| Galvé A, Jiang M, Hirn A, et al. 2006. Explosion seismic P and S velocity and attenuation constraints on the lower crust of the North-Central Tibetan Plateau, and comparison with the Tethyan Himalayas: implications on composition, mineralogy, temperature, and tectonic evolution. Tectonophysics 412: 141-157. | |
| Hacker B R, Gnos E, Ratschbacher L, et al. 2000. Hot and dry deep crustal xenoliths from Tibet. Science, 287(5462): 2463-2466. DOI:10.1126/science.287.5462.2463 | |
| Huang R Q, Wang Z, Pei S P, et al. 2009. Crustal ductile flow and its contribution to tectonic stress in Southwest China. Tectonophysics, 473(3-4): 476-489. DOI:10.1016/j.tecto.2009.04.001 | |
| Hubbard J, Shaw J H. 2009. Uplift of the Longmen Shan and Tibetan plateau, and the 2008 Wenchuan (M=7.9) earthquake. Nature, 458(7235): 194-197. | |
| Jiménez-Munt I, Fernàndez M, Vergés J, et al. 2008. Lithosphere structure underneath the Tibetan Plateau inferred from elevation, gravity and geoid anomalies. Earth Planet. Sci. Lett., 267(1-2): 276-289. DOI:10.1016/j.epsl.2007.11.045 | |
| Kind R, Ni J, Zhao W J, et al. 1996. Evidence from earthquake data for a partially molten crustal layer in Southern Tibet. Science, 274(5293): 1692-1694. DOI:10.1126/science.274.5293.1692 | |
| Kono Y, Ishikawa M, Arima M. 2006. Laboratory measurements of P-and S-wave velocities in polycrystalline plagioclase and gabbronorite up to 700℃ and 1 GPa: Implications for the low velocity anomaly in the lower crust. Geophys. Res. Letts., 33(15): L15314. DOI:10.1029/2006GL026526 | |
| Lei J S, Zhao D P. 2009. Structural heterogeneity of the Longmenshan fault zone and the mechanism of the 2008 Wenchuan earthquake (MS8.0). Geochem. Geochem. Geophys. Geosyst., 10(10): Q10010. DOI:10.1029/2009GC002590 | |
| Li S H, Unsworth M J, Booker J R, et al. 2003. Partial melt or aqueous fluid in the mid-crust of Southern Tibet? Constraints from INDEPTH magnetotelluric data. Geophys. J. Int., 153(2): 289-304. DOI:10.1046/j.1365-246X.2003.01850.x | |
| Meade B J. 2007. Present-day kinematics at the India-Asia collision zone. Geology, 35(1): 81-84. DOI:10.1130/G22924A.1 | |
| Mechie J, Sobolev S V, Ratschbacher L, et al. 2004. Precise temperature estimation in the Tibetan crust from seismic detection of the α-β quartz transition. Geology, 32(7): 601-604. DOI:10.1130/G20367.1 | |
| Nesbitt B E. 1993. Electrical resistivities of crustal fluids. J. Geophys. Res., 98(B3): 4301-4310. DOI:10.1029/92JB02576 | |
| Nostro C, Chiaraluce L, Cocco M, et al. 2005. Coulomb stress changes caused by repeated normal faulting earthquakes during the 1997 Umbria-marche, central Italy. seismic sequence. J. Geophys. Res. http://dx.doi.org/10.1029/2004JB003386. | |
| Pei S P, Su J R, Zhang H J, et al. 2010. Three-dimensional seismic velocity structure across the 2008 Wenchuan MS8.0 earthquake, Sichuan, China. Tectonophysics, 491(1-4): 211-217. DOI:10.1016/j.tecto.2009.08.039 | |
| Pei S, Sun Y, Toksöz M N, et al. 2011. Imaging Poisson's ratio of uppermost mantle beneath China. Bull. Seismol. Soc. Am, 101: 1452-1461. DOI:10.1785/0120090024 | |
| Pollack H N, Hurter S J, Johnson J R. 1993. Heat flow from the Earth's interior: Analysis of the global data set. Rev. Geophys, 31(3): 267-280. DOI:10.1029/93RG01249 | |
| Pommier A, Gaillard F, Pichavant M, et al. 2008. Laboratory measurements of electrical conductivities of hydrous and dry Mount Vesuvius melts under pressure. J. Geophys. Res., 113(B5): B05205. DOI:10.1029/2007JB005269 | |
| Royden L H, Burchfiel B C, King R W, et al. 1997. Surface deformation and lower crustal flow in eastern Tibet. Science, 276(5313): 788-790. DOI:10.1126/science.276.5313.788 | |
| Royden L H, Burchfiel B C, van der Hilst R D. 2008. The geological evolution of the Tibetan Plateau. Science, 321(5892): 1054-1058. DOI:10.1126/science.1155371 | |
| Rui Y, Huang T S, Mehrotra S. 1999. Constructing table-of-content for video. Multimedia Systems, 7: 359-368. DOI:10.1007/s005300050138 | |
| Shen Z K, Lü J N, Wang M, et al. 2005. Contemporary crustal deformation around the southeast borderland of the Tibetan Plateau. J. Geophys. Res., 110(B11): B11409. DOI:10.1029/2004JB003421 | |
| Sibson R H. 2003. Thickness of seismic slip zone. Bull. Seismol. Soc. Am, 59: 1569-1589. | |
| Sun J, Jin G W, Bai D H, et al. 2003. Sounding of electrical structure of the crust and upper mantle along the eastern border of Qinghai-Tibet Plateau and its tectonic significance. Sci China Ser D Earth Sci, 46(S2): 243-253. | |
| Tapponnier P, Xu Z Q, Roger F, et al. 2001. Oblique stepwise rise and growth of the Tibetan Plateau. Science, 294: 1671-1677. DOI:10.1126/science.105978 | |
| Waldhauser F, Ellsworth W L. 2000. A double-difference earthquake location algorithm: Method and application to the Northern Hayward Fault, California. Bull. Seismol. Soc. Am., 90(6): 1353-1368. DOI:10.1785/0120000006 | |
| Wang C Y, Chan W W, Mooney W D. 2003. Three-dimensional velocity structure of crust and upper mantle in southwestern China and its tectonic implications. J. Geophys. Res., 108(B9): 2442. DOI:10.1029/2002JB001973 | |
| Wang Z, Zhao D P. 2006a. Suboceanic earthquake location and seismic structure in the Kanto district, central Japan. Earth Planet. Sci. Letts., 241(3-4): 789-803. DOI:10.1016/j.epsl.2005.11.015 | |
| Wang Z, Zhao D P. 2006b. Seismic images of the source area of the 2004 Mid-Niigata prefecture earthquake in Northeast Japan. Earth Planet. Sci. Letts., 244(1-2): 16-31. DOI:10.1016/j.epsl.2006.02.015 | |
| Wang Z, Fukao Y, Pei S P. 2009. Structural control of rupturing of the MW7.9 2008 Wenchuan Earthquake, China. Sci. Lett., 279(1-2): 131-138. | |
| Wang Z, Zhao D P, Wang J. 2010. Deep structure and seismogenesis of the North-South Seismic Zone in Southwest China. J. Geophys. Res., 115(B12): B12334. DOI:10.1029/2010JB007797 | |
| Wang Z, Wang J, Chen Z L, et al. 2011. Seismic imaging, crustal stress and GPS data analyses: Implications for the generation of the 2008 Wenchuan Earthquake, (M7.9), China. Gondwana Res., 19(1): 202-212. DOI:10.1016/j.gr.2010.05.004 | |
| Wang Z, Wang X B, Huang R Q, et al. 2012. Structural heterogeneities in Southeast Tibet: Implications for regional flow in the lower crust and upper mantle. Int. J. Geophys., 2012: 975497. DOI:10.1155/2012/975497 | |
| Wang X B, Zhang G, Fang H, et al. 2014a. Crust and upper mantle resistivity structure at middle section of Longmenshan, eastern Tibetan plateau. Tectonophysics, 619-620: 143-148. DOI:10.1016/j.tecto.2013.09.011 | |
| Wang Z, Huang R Q, Pei S P. 2014b. Crustal deformation along the Longmen-Shan fault zone and its implications for seismogenesis. Tectonophysics, 610: 128-137. DOI:10.1016/j.tecto.2013.11.004 | |
| Wang Z, Su J R, Liu C X, et al. 2015. New insights into the generation of the 2013 Lushan Earthquake (MS7.0), China. J. Geophys. Res., 120(5): 3507-3526. DOI:10.1002/2014JB011692 | |
| Watanabe T. 1993. Effects of water and melt on seismic velocities and their application to characterization of seismic reflectors. Geophys. Res. Letts., 20(24): 2933-2936. DOI:10.1029/93GL03170 | |
| Wei W B, Unsworth M, Jones A, et al. 2001. Detection of widespread fluids in the Tibetan crust by magnetotelluric studies. Science, 292(5517): 716-718. DOI:10.1126/science.1010580 | |
| Xu L L, Rondenay S, van der Hilst R D. 2007. Structure of the crust beneath the southeastern Tibetan Plateau from teleseismic receiver functions. Phys. Earth Planet. Int., 165(3-4): 176-193. DOI:10.1016/j.pepi.2007.09.002 | |
| Xu Y, Li Z W, Huang R Q, et al. 2010. Seismic structure of the Longmen Shan region from S-wave tomography and its relationship with the Wenchuan MS8.0 earthquake on 12 May 2008, southwestern China. Geophys. Res. Letts., 37(2): L02304. | |
| Zhang Z J, Wang Y H, Chen Y, et al. 2009. Crustal structure across Longmenshan fault belt from passive source seismic profiling. Geophys. Res. Letts, 36(17): L17310. DOI:10.1029/2009GL039580 | |
| Zhao D P, Hasegawa A, Horiuchi S. 1992. Tomographic imaging of P and S wave velocity structure beneath northeastern Japan. J. Geophys. Res., 97(B13): 19909-19928. DOI:10.1029/92JB00603 | |
| Zhao D P, Kanamori H, Negishi H, et al. 1996. Tomography of the source area of the 1995 Kobe earthquake: Evidence for fluids at the hypocenter?. Science, 274(5294): 1891-1894. DOI:10.1126/science.274.5294.1891 | |
 2017, Vol. 60
