2014年8月3日16时30分 (北京时间) 在云南省昭通市鲁甸县 (27.1°N,103.3°E) 发生了MS6.5地震,震源深度12 km (来源于中国地震台网).由于当地房屋质量差,人口密度高,且地震共轭破裂、震源深度浅等因素的影响,导致最高地震烈度达到IX度,造成了巨大的损失 (张广伟等,2014).鲁甸地震之后,一些学者对其发震构造 (房立华等,2014;王未来等,2014;徐锡伟等,2014;Cheng et al., 2015) 和破裂过程 (刘成利等,2014; 张勇等, 2014, 2015) 做了详细的研究.另外,由于鲁甸地震发生在溪洛渡水库附近,关于鲁甸地震是否由该水库的蓄水引起存在争议 (Qiu,2014).
随着人类活动范围的扩大,人类活动 (如水库蓄水、油气资源开发) 与活动区域附近的地震间是否存在诱发关系已引起广泛关注 (陈颙,2009;马文涛等,2011;Kim,2013;Friberg et al., 2014;Walter et al., 2016).在人类活动与地震关系中,水库诱发地震的研究历史最长 (Gupta et al., 1972a;Pavlou et al., 2016).一般而言水库诱发的中强震具有主震之前的b值大于余震b值, 且二者均大于区域背景b值的特征 (Gupta et al., 1972b; Gupta,2002),且水库诱发地震区域内的地震活动性在水库蓄水前后会存在明显变化 (马文涛等,2013).
因此,本文试图从鲁甸地震前后的b值与区域背景b值的对比及溪洛渡水库蓄水前后的地震活动性来讨论2014年鲁甸MS6.5地震是否具有典型水库诱发地震的特征.然而,由于鲁甸地震震中附近固定台站数目较少 (只有巧家、昭通两个固定台)、台站距离震中位置较远 (约为50 km) 且主震尾波干扰等因素的影响,会造成地震目录的缺失, 从而可能影响地震活动性的可靠分析.
目前以互相关技术为基础的模板匹配方法是低信噪比情况下检测遗漏事件的有效方法且已经得到了广泛应用,如Shelly等 (2007)对非火山地脉动与低频地震关系的研究;Yang等 (2009)对2008年Illinois Monut Carmel MW5.8发震构造的确认;谭毅培等 (2014)对2013年3月涿鹿微震群发震构造的确认;Meng等 (2013)对2003年San Simeon MW6.5地震之后,Parkfield地区地震活动性与应力触发关系的研究;Zhang和Wen (2015)对朝鲜一次低当量核爆的检测等.虽然模板匹配方法已经得到广泛运用,但由于其计算量一般过于庞大,传统的利用CPU进行计算,会花费大量的时间.为此,Meng等 (2012)利用GPU并行计算实现了模板匹配方法算法加速,并应用于2010年Mayor-Cucapah MW7.2地震之后Salton Sea地区地震目录的完备.
本文利用模板匹配方法,结合GPU并行计算来完备2014年鲁甸MS6.5地震发生前33天内、后5天内的地震目录,通过分析主震前后的b值与区域背景b值,同时结合溪洛渡水库蓄水前后的地震活动性来探讨鲁甸地震是否具有典型水库诱发地震的特征.
2 模板匹配方法处理步骤本文主要分析了鲁甸地震震中50 km以内 (26°30′N—27°30′N,102°30′E—103°36′E) 范围内地震活动特征 (图 1).采用数据来自中国地震台网中的昭通 (ZAT)、巧家 (QIJ) 两个固定台,数据的采样率为100 Hz.郭路杰等 (2014)研究表明,鲁甸地震的余震衰减较快,震后5天激发次级余震的能力已经显著减弱.同时通过查询中国地震台网统一地震目录 (以下简称台网目录) 发现研究区域内震后5天内的地震有573个地震事件可以满足统计需求.而鲁甸地震发生之前该区域的地震相对较少,因此本文选取了主震发生前33天至主震发生后5天,即2014年7月1日至2014年8月7日的数据进行研究.本文将这段时间内台网目录中的593个事件作为候选模板,其中20个事件发生在主震之前.候选模板事件的最大震级为MS6.5,最小震级ML1.区域概况及台网目录地震分布见图 1.

|
图 1 区域概况及台网目录地震分布图 蓝色圆圈代表余震,红色圆圈代表发生在主震之前的事件. Fig. 1 Map showing general situation of study area and earthquakes distributions Blue circles represent aftershocks; Red circles represent events before the main shock. |
参照Peng和Zhao (2009)等的工作,本文采用如下步骤进行事件的检测:
(1) 对数据去均值、去线性趋势后采用2~12 Hz四极双通道Butterworth带通滤波器进行滤波,以提高信号的信噪比.
(2) 人工拾取模板事件P、S波到时,并计算其信噪比,舍弃信噪比小于5的地震事件.经计算,其中541个事件的波形能够作为模板波形.
(3) 计算模板事件的波形和其对应的被检测波形的互相关系数 (cross-correlation coefficient, CC):

|
(1) |
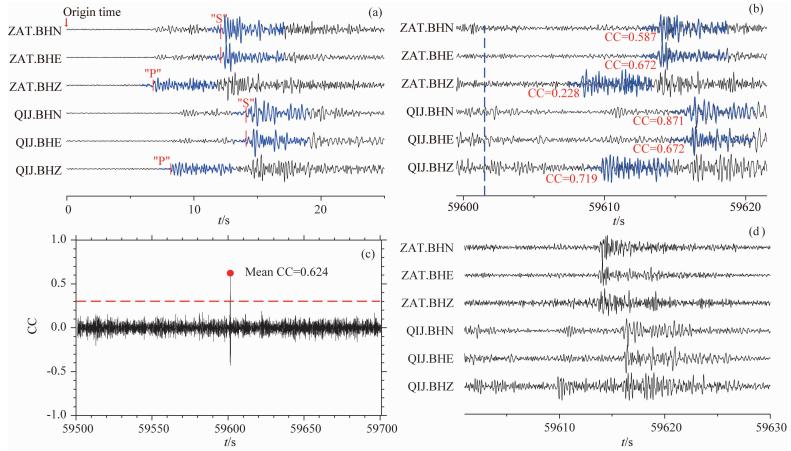
其中x、y分别为x(t) 和y(t) 的均值;t0, t1分别为时间窗的开始和结束时间,本文中分别取P波和S波到时之前1 s和之后5 s.其扫描原理如图 2所示.
|
图 2 模板匹配原理图 (以某M2.9检测事件为例) (a) 模板的选取 (蓝色波形代表模板波形,红色虚线代表P、S波到时,红色箭头代表发震时刻);(b) 互相关扫描及时间偏移 (蓝色波形代表图 2a中的模板波形,红色字体代表互相关系数,蓝色虚线代表检测事件的发震时刻);(c) 互相关值经时间偏移、叠加取平均后的结果图 (红色虚线代表阈值,红点代表检测到的一次事件);(d) 图 2c中红点所代表的检测事件在不同台站的各分量波形.图 2b、2c、2d中的起始时间为2014-08-03 00 : 00 : 00. Fig. 2 Principle of matched filter technique (a case study of M2.9 detected event) (a) Selection of template (blue waves represents the template′s waves, red dashed lines represent arrival times of P or S, red arrow represents the origin time); (b) Scanning of correlation and migration of time (blue waveforms represent the template′s waveforms of Fig. 2a, blue dashed line represents the origin time of detected event); (c) Mean CC after migration of time (red dashed line represents the threshold, red dots represent detected events); (d) Waves of detected events corresponding to red dots in Fig. 2c. Time since 2014-08-03 00 : 00 : 00 in Figs. 2b to 2c. |
(4) 将各台站及其分量的CC值所对应的时间分别减去其模板所对应的P或S波走时及连续波形的起始时间差,使各分量的CC值偏移到发震时刻进行叠加以获得叠加CC值,然后将叠加CC值除以所用分量的有效个数来获得平均CC值.
(5) 计算平均CC值波列的绝对离差中位数 (median absolute deviation,MAD).若平均CC值大于其阈值,我们则初步判定其为一次事件.本文采用12倍MAD作为阈值 (Peng and Zhao, 2009;谭毅培等,2014).
对于波形相似的两个波来说,移动一个采样率的点,两者的CC值仍然远大于其与随机信号的CC值.以本文的数据为例,采样率为100 Hz,移动一个点为0.01 s,因此在初步结果中,会发现在以s为尺度的时间范围内,存在大量检测事件.考虑到这种情况,本文限定2 s内平均CC最大的值作为检测事件.
(6) 发震时刻的确定:根据模板匹配方法的假设,可以近似检测事件与其所对应的模板事件具有相同的走时,从而得到检测事件的发震时刻;关于检测事件震级的确定,通过计算检测事件与其对应的模板事件在各台站的水平分量上S波到时前2 s至后2 s内最大振幅的比值,然后求振幅比的平均值来获得.
根据以上处理步骤,本文共得到1532个检测事件,其中541个为模板事件的自检测,991个为遗漏事件.加上台网目录中不符合信噪比要求的地震事件,共得到1584个地震事件,其中发生在主震之前的地震事件117个,余震1467个.简化起见,后文中将由模板匹配方法获得的地震目录称为检测目录.
通过检测目录与台网目录的震级-时间分布 (图 3a,北京时间) 可以看出大多数遗漏事件的震级偏小,主震发生之前遗漏事件的震级大多数在1级以下,且主震之后遗漏事件表现出明显的周期性.通过放大主震后的震级-时间分布 (图 3b),可以看出小震级的遗漏事件通常出现在晚上,我们推测这可能与晚上噪声水平低有关.图 3c展示了几个不同震级的遗漏事件 (图 3b中圆圈内黑点) 在台站QIJ的BHZ分量上的记录归一化后的波形,从中可以看出这些遗漏事件波形具有典型近震波形特征,同时可以看到由于距主震的发震时刻更近,在主震尾波的影响下M3.7地震的信噪比要低于之后的M2.4地震.

|
图 3 震级-时间分布及遗漏事件归一化波形图 (a) 检测前后震级-时间分布图 (灰点代表遗漏事件,黑点代表台网目录事件,虚线代表发震时刻);(b) 图 3a虚线右侧放大图 (圆圈内黑点代表不同震级的遗漏事件);(c) QIJ台站BHZ分量记录的图 3b圆圈内黑点所代表的遗漏事件的归一化波形图. Fig. 3 Magnitude-time distribution and normalized waveforms of missing events (a) Magnitude-time distribution before and after detection (black dots represent events of network catalog, gray dots represent missing events, dashed line represents the origin time); (b) Amplification diagram of dashed line on right in Fig. 3a (black dots in the circles represent missing events of different magnitude); (c) Normalized waveforms of missing events corresponding to black dots in circles of Fig. 3b recorded as component BHZ at station QIJ. |
完备震级 (Magnitude of completeness,Mc) 是国际上普遍采用的评估地震台网检测能力的一个定量标准 (李智超和黄清华,2014),同时也是进行地震活动性研究的重要参数 (Wiemer and Wyss, 2000).地震目录的完备震级主要取决于台站分布,同时还受到处理方法的影响.Schaff (2008)研究表明,利用模板匹配方法能有效降低目录的完备震级.为进一步研究地震活动性特征,我们首先在检测事件的基础上分析获得检测目录的完备震级.
确定完备震级的方法有很多 (Ogata et al., 1991; Ogata and Katsura, 1993),其中最大曲率法是进行完备震级分析最常用的方法之一 (冯建刚等,2012;王亮等,2015),该方法认为震级-频度曲线一阶导数最大值对应的震级为完备震级.
由于不同的震级标度会对完备震级的计算产生影响,因此本文根据杨晶琼等 (2013)得到的云南地区近震震级与面波震级转化关系式:MS=1.13ML-0.86,将台网目录中主震的面波震级及以主震为模板得到的遗漏事件震级进行震级转换,从而统一所有事件的震级标度.
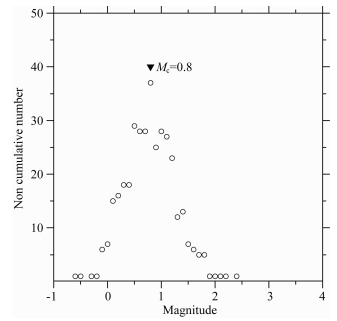
利用最大曲率法,本文分别分析了主震后5天内台网目录和检测目录及主震前33天内检测目录这三组目录 (由于主震前33天内台网目录中事件较少,不具有统计意义),得到的完备震级分别为1.8,1.3和1.2(图 4、图 5).余震的完备震级由台网目录的1.8降低到检测目录的1.3,同时震后完备震级与震前基本相同,这说明模板匹配方法能有效减轻由于强震尾波干扰而造成的目录缺失问题,提高地震检测能力.
|
图 4 主震发生之前检测目录的完备震级 Fig. 4 Mc before the main shock |

|
图 5 检测目录与台网目录余震完备震级对比 Fig. 5 Mc of aftershocks before and after detection |
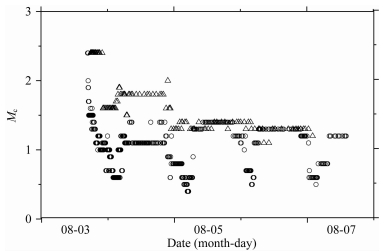
图 6展示了检测目录和台网目录中余震的完备震级随时间的变化 (北京时间,参数选择:窗口大小为100个地震事件,步长为20个地震事件,震级间隔为0.1).从中可以看出主震发生后的一段时间内,两者的完备震级都在2.5附近,这可能与主震尾波严重干扰有关,随着时间的推移,利用台网目录计算的完备震级缓慢降低,在8月5日0时左右降到1.5附近,而利用检测目录计算的完备震级在主震发生后迅速降到1.5附近,呈现周期性的变化且在夜间较小,这种现象与图 3b所表现出的周期性变化相一致, 可能与晚间噪声水平低有关.
|
图 6 检测目录与台网目录余震完备震级随时间的变化 三角形代表台网目录完备震级,圆圈代表检测目录完备震级. Fig. 6 Change of Mc with time in detection and network catalogs Triangles represent Mc of network catalog, circles represent Mc after detection. |
地震数量与震级通常遵循G-R关系logN=a-bM (其中N表示大于震级M的地震累积频度;a,b为拟合常数)(Gutenberg and Richter, 1944).研究表明b值与材料的不均匀性 (Mogi, 1962)、地热梯度 (Warren and Latham, 1970)、研究区域的应力状态 (Chan et al., 2012) 等因素有关,同时水库诱发的中强震具有主震之前的b值大于余震b值, 且二者均大于区域背景b值的特征 (Gupta et al., 1972b; Gupta,2002).
求解b值的方法包括最小二乘法、最大似然法 (Aki,1965;Marzocchi and Sandri, 2003).最小二乘法是回归分析中估计参数常用的一种方法,但b值求解问题并不是一般的回归问题 (张建中和宋良玉, 1981), 同时最小二乘法对小震级的地震赋予的权重较小,而最大似然法对所有地震赋予同样的权重 (王辉等,2012).由于遗漏事件震级一般偏低,因此本文采用最大似然法求解b值 (参数选择:震级间隔0.1,起始震级为对应的完备震级).
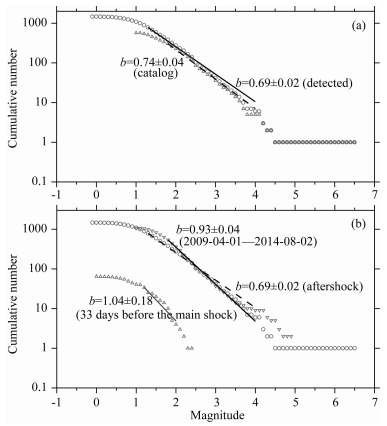
本文首先对比了台网目录和检测目录余震的b值,从图 7a可以看出虽然台网目录中余震的b值0.74±0.04较检测目录中余震的b值0.69±0.02略大,但这种差异在误差范围以内.由于本文计算b值的起始震级为各自的完备震级 (分别为1.8,1.3),因此我们认为在统计量足够的前提下,利用完备震级以上的台网目录也可以获得比较可靠的b值.利用同样方法本文还获得了主震前33天内检测目录的b值为1.04±0.18(同期台网目录中只有20个事件无法计算b值).注意到余震b值明显低于主震前b值,同时也明显低于张盛峰等 (2014)利用震后40天台网目录获得的b值 (0.8).Peng等 (2007)发现余震活动性分析结果会随时间发生变化.因此本文分析了检测目录余震b值随时间的变化 (图 8).从图 8可看震后早期b值存在明显变化,但是在较短的时间后 (约10小时)b值就稳定在0.9附近.
|
图 7 不同目录中震级和数目关系及b值对比图 (a) 实线代表检测后余震的b值,虚线代表台网目录中余震的b值;(b) 灰线代表检测后主震发生前33天内的b值,黑色实线代表利用2009-04-26—2014-07-30的台网目录所求b值,虚线代表检测后余震的b值. Fig. 7 Magnitude versus number of different catalogues and comparison of b values (a) Solid line represents b value of aftershock after detection, dashed line represents b value of aftershock before detection; (b) Gray line represents b value within 33 days before main shock, black solid line represents b value based on the catalog of 2009-04-26—2014-07-30, dashed line represents b value of aftershock after detection. |

|
图 8 检测目录余震b值随时间变化图 实线代表窗口为400个地震事件的b值变化;虚线代表窗口为200个地震事件的b值变化. Fig. 8 Variation of b value with time of aftershocks after detection Solid line represents b value in window of 400 events; Dashed line represents b value in window of 200 events. |
主震前后b值与区域背景b值的相对大小是判断水库地震的一个重要标准 (Gupta et al., 1972b; Gupta,2002).为获得该地区的背景b值,本文采用2009年至主震前台网目录,计算得到该区域的背景b值为0.93±0.04.这个值与鲁甸地震前后地震b值接近,这与通常水库诱发的中强震所具有的主震之前的b值大于余震b值, 且二者均大于区域背景b值特征不一致.
4 溪洛渡水库蓄水前后地震活动性对比在典型的水库诱发地震地区,蓄水前后的地震活动性会存在明显改变,如地震频度增加、b值升高.另外,根据上文得到的利用完备震级以上的地震目录能够获得较可靠b值的结论,本文利用2009年到主震发生前的台网目录来探查溪洛渡水库蓄水 (蓄水开始时间:2013年5月4日,来自百度百科) 前后研究区域内的地震活动性是否发生明显的变化.
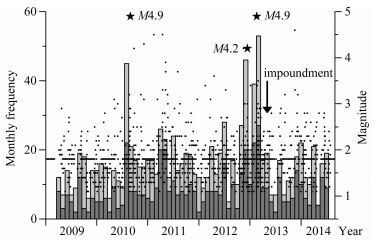
本文首先评估了该区域主震前5年内台网目录的完备震级为1.8.之后分析了蓄水前后所有地震事件及完备震级以上地震事件的月频度及震级的变化,从图 9可以看出月频度有三个峰值,通过查询台网目录,我们发现这三个峰值分别对应2010年8月29日云南巧家MS4.9地震、2012年12月13日云南巧家MS4.2地震、2013年2月19日云南巧家MS4.9地震 (图 9中黑色五角星所示),且这三个地震都发生在溪洛渡水库蓄水之前.在这三个峰值频度之外,我们并未发现蓄水前后地震事件的月频度及震级存在明显变化.
|
图 9 溪洛渡水库蓄水前后地震月频度及震级对比 灰色矩形代表所有事件月频度,灰黑色矩形代表完备震级以上事件月频度,黑点代表震级大小,虚线代表完备震级,黑色箭头代表开始蓄水时间. Fig. 9 Monthly frequency and magnitude before and after impoundment of the Xiluodu reservoir Gray bars represent monthly frequency of earthquakes in the catalog, the gray-black bars represent monthly frequency of earthquakes which magnitude are larger than Mc, black dots represent the magnitude, dashed line represents the Mc, black arrow represents the time of impoundment beginning. |
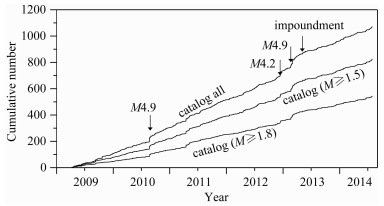
为进一步分析溪洛渡水库蓄水后地震数目是否增多,本文分别计算了台网目录中所有地震事件、1.5级以上、1.8级以上的地震事件数目的累积频度及蓄水前后的b值.从图 10可以看出,溪洛渡水库蓄水前后,除了上文所描述的3个较大地震发生的时间点外 (图 10中箭头所示),不同震级以上的地震数目累积频度几乎为一条直线,这表明从地震数量的变化来看,蓄水前后的地震活动并无明显变化;从图 11可以看出蓄水前的b值0.94±0.05与蓄水后的b值0.92±0.08相差不大,这表明在研究区域内并未出现由于水库蓄水而导致的b值升高的现象.
|
图 10 溪洛渡水库蓄水前后地震数目累积频度图 Fig. 10 Cumulative number of earthquakes before and after impoundment of the Xiluodu reservoir |

|
图 11 溪洛渡水库蓄水前后b值对比 虚线代表蓄水前的b值,实线代表蓄水后的b值. Fig. 11 Comparison of b values before and after impoundment of the Xiluodu reservoir The dashed line represents the b value before impoundment; the solid line represents the b value after impoundment. |
本文利用模板匹配方法,结合GPU并行计算加速,完备了2014鲁甸MS6.5地震发生前33天至发生后5天内的地震目录,使发生在主震之前33天内的地震数目由20个提高到65个,这使分析主震前短时间内的地震活动性从统计上更为可靠;并使余震的完备震级由1.8下降到1.3.利用检测目录与台网目录,本文主要从以下两方面讨论了鲁甸地震与溪洛渡水库间是否存在诱发关系.
从水库诱发的中强震具有的b值特征来看,水库诱发的中强震一般具有主震之前的b值大于余震b值, 且二者均大于区域背景b值的特征 (Gupta et al., 1972b; Gupta,2002;墨宏山,2000),如中国新丰江水库诱发的MS6.1地震、赞比亚卡里巴水库诱发的M6.1地震、希腊克里马斯塔水库诱发的M6.2地震、印度柯依纳水库诱发M6.5地震.本文根据检测目录与台网目录获得了研究区域内主震发生前33天、发生后5天及区域背景b值,分别为1.04±0.18、0.69±0.02、0.93±0.04.震后5天的b值呈现剧烈的变化.以少量 (200个) 事件为窗口计算获得的b值震后数小时内较高 (~1.2).由小窗口计算得到的较高b值可能是主震后早期余震目录严重缺失,完备震级 (2.4) 较高,导致样本数较少引起的计算误差较大 (~0.3).这种可能由早期余震目录缺失引起的早期地震活动异常现象早有学者发现,如Peng等 (2006, 2007) 通过连续波形高频段记录检测遗漏事件,发现主震发生后数十分钟以内的余震衰减特征不同于之后的余震衰减特征.关于早期余震目录严重缺失的原因,我们认为主要有两方面:(1) 尾波干扰过于严重,本文的方法无法进行有效检测;(2) 在进行检测的过程中,我们假定2 s内只有一个事件,而在早期余震阶段可能很多地震的发震时刻间隔小于2 s.
另外,本文发现余震b值 (图 8) 在主震发生后10小时内一直较低 (~0.5-0.7).在震后半小时后,余震的完备震级已经明显减小 (~1.3),不存在完备震级过高造成的样本不足问题.因此我们认为低b值不是由余震目录缺失引起的.影响b值的因素有很多,包括介质的不均匀性 (Mogi, 1962)、研究区域的应力状态 (Tsukakoshi and Shimazaki, 2008;Chan et al., 2012).由于空间应力和物质不均匀,震源位置变化会明显改变b值 (Enescu and Ito, 2002;Gori et al., 2012;朱艾斓等,2005).受限于台站数目,我们没有对余震进行重新定位.下一步工作中,我们将搜集更多资料对早期余震进行定位来评估可能的余震空间分布对b值的影响.另外,震后局部应力调整及流体运移也可能导致b值的变化 (曹俊兴等,2009;方亚如等,1986).关于应力调整和流体作用,我们将通过与其他地震进行对比分析深入研究.
在结束持续数小时的低b值状态后,余震b值就稳定在0.9附近,通过对比主震前33天b值1.04±0.18,背景b值0.93±0.04,我们认为鲁甸地震不具有一般水库诱发的中强震所具有的主震之前的b值大于余震b值, 且二者均大于区域背景b值的特征.
从水库诱发地震区域蓄水前后的地震活动性来看,蓄水后研究区域内的地震活动性较蓄水前会明显加强,如法国的蒙蒂纳尔德水库以及中国的新丰江水库 (杨清源等,1996).本文通过观察研究区域在溪洛渡水库蓄水前后地震事件的月频度、完备震级以上地震事件的月频度、震级及b值的变化,以及不同震级以上的地震数目累积频度随时间的变化,均没有发现蓄水前后的地震活动性存在明显改变,这与典型水库诱发地震区域表现出的地震活动性特征并不相符.
另外,库水渗透是水库诱发地震的产生不可或缺的因素 (McGarr and Simpson, 1997;Talwani and Acree, 1985).通常,库水主要是沿着裂隙、岩溶、温泉等通道进行渗透的 (马文涛等,2013).由于水渗透受通道的限制,因此在水库诱发地震区域,地震活动一般位于水库附近5 km范围内,震源深度大多在5 km内,少有超过10 km (陈颙,2009).而鲁甸地震的震源深度为12 km、震中距溪洛渡水库40 km,以此溪洛渡水库的水很难渗入到该区域.
致谢中国地震局地球物理研究所国家数字测震台网数据备份中心 (SEISDMC, doi:10.11998/SeisDmc/SN) (郑秀芬等,2009) 为本研究提供地震波形数据,美国佐治亚理工学院彭志刚教授为本研究提供模板匹配程序,在此深表谢意.本文图件采用GMT (e.g.,Wessel et al., 2013) 软件包绘制.感谢审稿人提出的建设性意见,让本文更加完善.
| Aki K. 1965. Maximum likelihood estimates of b in the formula log N=a-bM and its confidence limits. Bulletin of the Earthquakes Research Institute, 43: 237-239. | |
| Cao J X, Liu S G, He X Y, et al. 2009. Effects of Longmenshan earthquake an migration and accumulation of natural gas in west Sichuan basin. Natural Gas Industry (in Chinese), 29(2): 6-11. | |
| Chan C H, Wu Y M, Tseng T L, et al. 2012. Spatial and temporal evolution of b-values before large earthquakes in Taiwan. Tectonophysics, 532-535: 215-222. DOI:10.1016/j.tecto.2012.02.004 | |
| Cheng J, Wu Z L, Liu J, et al. 2015. Preliminary report on the 3 August 2014, MW6.2/MS6.5 Ludian, Yunnan-Sichuan border, Southwest China, earthquake. Seismological Research Letters, 86(3): 750-763. DOI:10.1785/0220140208 | |
| Enescu B, Ito K. 2002. Spatial analysis of the frequency-magnitude distribution and decay rate of aftershock activity of the 2000 Western Tottori earthquake. Earth, Planets and Space, 54(8): 847-859. DOI:10.1186/BF03352077 | |
| Fang L H, Wu J P, Wang W L, et al. 2014. Relocation of the aftershock sequence of the MS6.5 Ludian earthquake and its seismogenic structure. Seismology and Geology (in Chinese), 36(4): 1173-1185. | |
| Fang Y R, Cai D E, Liu X H, et al. 1986. The change of b-value of acoustic emission before ruptures of water-bearing rocks. Earthquake(2): 1-6. | |
| Feng J G, Jiang C S, Han L B, et al. 2012. Analysis on the monitoring capability of seismic networks and completeness of earthquake catalogues in Gansu region. Acta Seismologica Sinica (in Chinese), 34(5): 646-658. | |
| Friberg P A, Besana-Ostman G M, Dricker I. 2014. Characterization of an earthquake sequence triggered by hydraulic fracturing in Harrison County, Ohio. Seismological Research Letters, 85(6): 1295-1307. DOI:10.1785/0220140127 | |
| Gori P D, Lucente F P, Lombardi A M, et al. 2012. Heterogeneities along the 2009 L'Aquila fault inferred by the b-value distribution. Geophysical Research Letters, 39: L15304. DOI:10.1029/2012GL052822 | |
| Guo L J, Jiang C S, Han L B. 2014. Parameter characteristic in the early stage of Yunnan Ludian MS6.5 earthquake sequence in 2014. Journal of Seismological Research (in Chinese), 37(4): 503-507. | |
| Gupta H K, Rastogi B K, Narain H. 1972a. Common features of the reservoir-associated seismic activities. Bulletin of the Seismological Society of America, 62(2): 481-492. | |
| Gupta H K, Rastogi B K, Narain H. 1972b. Some discriminatory characteristics of earthquakes near the Kariba, Kremasta, and Koyna artificial lakes. Bulletin of the Seismological Society of America, 62(2): 493-507. | |
| Gupta H K. 2002. A review of recent studies of triggered earthquakes by artificial water reservoirs with special emphasis on earthquakes in Koyna, India. Earth-Science Reviews, 58(3-4): 279-310. DOI:10.1016/S0012-8252(02)00063-6 | |
| Gutenberg R, Richter C F. 1944. Frequency of earthquakes in California. Bulletin of the Seismological Society of America, 34: 185-188. | |
| Kim W Y. 2013. Induced seismicity associated with fluid injection into a deep well in Youngstown, Ohio. Journal of Geophysical Research, 118(7): 3506-3518. | |
| Li Z C, Huang Q H. 2014. Assessment of detectability of the Capital-circle Seismic Network by using the probability-based magnitude of completeness (PMC) method. Chinese J. Geophys. (in Chinese), 57(8): 2584-2593. DOI:10.6038/cjg20140818 | |
| Liu C L, Zheng Y, Xiong X, et al. 2014. Rupture process of MS6.5 Ludian earthquake constrained by regional broadband seismograms. Chinese J. Geophys. (in Chinese), 57(9): 3028-3037. DOI:10.6038/cjg20140927 | |
| Ma W T, Xu C P, Zhang X D, et al. 2011. Study on the relationship between the reservoir-induced seismicity at Zipingpu reservoir and the MS8.0 Wenchuan earthquake. Seismology and Geology (in Chinese), 33(1): 175-190. | |
| Ma W T, Lin Y, Yuan J L, et al. 2013. Comparison and analysis on the basic features of reservoir-induced seismicity. Seismology and Geology (in Chinese), 35(4): 914-929. | |
| Marzocchi W, Sandri L. 2003. A review and new insights on the estimation of the b-value and its uncertainty. Annals of Geophysics, 46(6): 1271-1282. | |
| McGarr A, Simpson D. 1997. A broad look at induced and triggered seismicity.//Rockbursts and Seismicity in Mines. Rotterdam:A.A. Balkema, 385-396. | |
| Meng X F, Yu X, Peng Z G, et al. 2012. Detecting earthquakes around Salton Sea following the 2010 MW7.2 El Mayor-Cucapah earthquake using GPU parallel computing. Procedia Computer Science, 9: 937-946. DOI:10.1016/j.procs.2012.04.100 | |
| Meng X F, Peng Z G, Hardebeck J L. 2013. Seismicity around Parkfield correlates with static shear stress changes following the 2003 MW6.5 San Simeon earthquake. Journal of Geophysical Research:Solid Earth, 118(7): 3576-3591. DOI:10.1002/jgrb.50271 | |
| Mori K. 1962. Magnitude-frequency relation for elastic shocks accompanying fractures of various materials and some related problems in earthquakes. Bulletin of the Earthquakes Research Institute, 40: 831-853. | |
| Ogata Y, Imoto M, Katsura K. 1991. 3-D spatial variation of b-values of magnitude-frequency distribution beneath the Kanto District, Japan. Geophysical Journal International, 104(1): 135-146. DOI:10.1111/gji.1991.104.issue-1 | |
| Ogata Y, Katsura K. 1993. Analysis of temporal and spatial heterogeneity of magnitude frequency distribution inferred from earthquake catalogues. Geophysical Journal International, 113(3): 727-738. DOI:10.1111/gji.1993.113.issue-3 | |
| Pavlou K, Drakatos G, Kouskouna V, et al. 2016. Seismicity study in Pournari reservoir area (W. Greece) 1981-2010. Journal of Seismology, 20(2): 701-710. DOI:10.1007/s10950-016-9552-1 | |
| Peng Z G, Vidale J E, Houston H. 2006. Anomalous early aftershock decay rate of the 2004 MW6.0 Parkfield, California, earthquake. Geophysical Research Letters, 33: L17307. DOI:10.1029/2006GLL026774 | |
| Peng Z G, Vidale J E, Ishii M, et al. 2007. Seismicity rate immediately before and after main shock rupture from high-frequency waveforms in Japan. Journal of Geophysical Research:Solid Earth, 112: B03306. DOI:10.1029/2007JB004386 | |
| Peng Z G, Zhao P. 2009. Migration of early aftershocks following the 2004 Parkfield earthquake. Nature Geoscience, 2(12): 877-881. DOI:10.1038/ngeo697 | |
| Qiu J. 2014. Chinese data hint at trigger for fatal quake. Nature, 513(7517): 154-155. DOI:10.1038/513154a | |
| Schaff D P. 2008. Semiempirical statistics of correlation-detector performance. Bulletin of the Seismological Society of America, 98(3): 1495-1507. DOI:10.1785/0120060263 | |
| Shao D, Jia N, Wang Y. 2015. Completeness of earthquake catalogues in Shaanxi region. Seismological and Geomagnetic Observation and Research (in Chinese), 36(4): 30-35. | |
| Shelly D R, Beroza G C, Ide S. 2007. Non-volcanic tremor and low-frequency earthquake swarms. Nature, 446(7133): 305-307. DOI:10.1038/nature05666 | |
| Talwani P, Acree S. 1984. Pore pressure diffusion and the mechanism of reservoir-induced seismicity. Pure and Applied Geophysics, 122(6): 947-965. | |
| Tan Y P, Cao J Q, Liu W B, et al. 2014. Missing earthquakes detection and seismogenic structure analysis of the Zhuolu micro-earthquake swarm in March 2013. Chinese J. Geophys. (in Chinese), 57(6): 1847-1856. DOI:10.6038/cjg20140616 | |
| Tsukakoshi Y, Shimazaki K. 2008. Decreased b-value prior to the M6.2 Northern Miyagi, Japan, earthquake of 26 July 2003. Earth, Planets and Space, 60(9): 915-924. DOI:10.1186/BF03352847 | |
| Walter J I, Dotray P J, Frohlich C, et al. 2016. Earthquakes in Northwest Louisiana and the Texas-Louisiana border possibly induced by energy resource activities within the Haynesville Shale Play. Seismological Research Letters, 87(2A): 285-294. DOI:10.1785/0220150193 | |
| Wang H, Cao J L, Jing Y, et al. 2012. Spatiotemporal pattern of b-value before major earthquakes in the Sichuan-Yunnan region. Seismology and Geology (in Chinese), 34(3): 531-543. | |
| Wang L, Li T X, Wang Y, et al. 2015. Minimum magnitude of completeness for earthquake catalogues in Liaoning region. Seismological Research of Northeast China (in Chinese), 31(4): 20-24. | |
| Wang W L, Wu J P, Fang L H, et al. 2014. Double difference location of the Ludian MS6.5 earthquake sequences in Yunnan province in 2014. Chinese J. Geophys. (in Chinese), 57(9): 3042-3051. DOI:10.6038/cjg20140929 | |
| Warren N W, Latham G V. 1970. An experiment study of thermal induced microfracturing and its relation to volcanic seismicity. Journal of Geophysical Research, 75: 4455-4464. DOI:10.1029/JB075i023p04455 | |
| Wessel P, Smith W H F, Scharroo R, et al. 2013. Generic mapping tools:improved version released. Eos, Transactions American Geophysical Union, 94(45): 409-410. | |
| Wiemer S, Wyss M. 2000. Minimum magnitude of completeness in earthquake catalogs:examples from Alaska, the western United States, and Japan. Bulletin of the Seismological Society of America, 90(4): 859-869. DOI:10.1785/0119990114 | |
| Xu X W, Jiang G Y, Yu G H, et al. 2014. Discussion on seismogenic fault of the Ludian MS6.5 earthquake and its tectonic attribution. Chinese J. Geophys. (in Chinese), 57(9): 3060-3068. DOI:10.6038/cjg20140931 | |
| Yang H F, Zhu L P, Chu R S. 2009. Fault-plane determination of the 18 April 2008 Mount Carmel, Illinois, earthquake by detecting and relocating aftershocks. Bulletin of the Seismological Society of America, 99(6): 3413-3420. DOI:10.1785/0120090038 | |
| Yang J Q, Yang Z S, Cai M J, et al. 2013. Study on the ML and MS of conversation in the Yunnan Regional Digital Networks. Earthquake Research in China (in Chinese), 29(4): 513-521. | |
| Yang Q Y, Hu Y L, Chen X C, et al. 1996. Catalogue of reservoir induced seismic events in the world. Seismology and Geology (in Chinese), 18(4): 453-461. | |
| Zhang G W, Lei J S, Liang S S, et al. 2014. Relocations and focal mechanism solutions of the 3 August 2014 Ludian, Yunnan MS6.5 earthquake sequence. Chinese J. Geophys. (in Chinese), 57(9): 3018-3027. DOI:10.6038/cjg20140926 | |
| Zhang J Z, Song L Y. 1981. On the method of estimating b-value and its standard error——the Monte Carlo method of estimating the accuracy of b-value. Acta Seismologica Sinica (in Chinese), 3(3): 292-301. | |
| Zhang M, Wen L X. 2015. Seismological evidence for a low-yield nuclear test on 12 May 2010 in North Korea. Seismological Research Letters, 86(1): 138-145. DOI:10.1785/02201401170 | |
| Zhang S F, Wu Z L, Fang L H. 2014. Can the DD-relocated earthquake catalogue be used for the statistical parameters of an earthquake sequence?-A case study of the spatial distribution of b-values for the aftershocks of the 2014 Ludian MS6.5 earthquake. Seismology and Geology (in Chinese), 36(4): 1244-1259. | |
| Zhang Y, Xu L S, Chen Y T, et al. 2014. Rupture process of the 3 August 2014 Ludian, Yunnan, MW6.1 (MS6.5) earthquake. Chinese J. Geophys. (in Chinese), 57(9): 3052-3059. DOI:10.6038/cjg20140930 | |
| Zhang Y, Chen Y T, Xu L S, et al. 2015. The 2014 MW6.1 Ludian, Yunnan, earthquake:A complex conjugated ruptured earthquake. Chinese J. Geophys. (in Chinese), 58(1): 153-162. DOI:10.6038/cjg20150113 | |
| Zheng X F, Ouyang B, Zhang D N, et al. 2009. Technical system construction of Data Backup Centre for China Seismograph Network and the data support to researches on the Wenchuan earthquake. Chinese J. Geophys. (in Chinese), 52(5): 1412-1417. DOI:10.3969/j.issn.0001-5733.2009.05.031 | |
| 陈颙. 2009. 汶川地震是由水库蓄水引起的吗?. 中国科学D辑:地球科学, 39(3): 257–259. | |
| 曹俊兴, 刘树根, 何晓燕, 等. 2009. 龙门山地震对川西天然气聚散的影响. 天然气工业, 29(2): 6–11. | |
| 房立华, 吴建平, 王未来, 等. 2014. 云南鲁甸MS6.5地震余震重定位及其发震构造. 地震地质, 36(4): 1173–1185. | |
| 方亚如, 蔡戴恩, 刘晓红, 等. 1986. 含水岩石破裂前的声发射b值变化. 地震(2): 1–6. | |
| 冯建刚, 蒋长胜, 韩立波, 等. 2012. 甘肃测震台网监测能力及地震目录完整性分析. 地震学报, 34(5): 646–658. | |
| 郭路杰, 蒋长胜, 韩立波. 2014. 2014年云南鲁甸6.5级地震序列参数的早期特征. 地震研究, 37(4): 503–507. | |
| 李智超, 黄清华. 2014. 基于概率完备震级评估首都圈地震台网检测能力. 地球物理学报, 57(8): 2584–2593. DOI:10.6038/cjg20140818 | |
| 刘成利, 郑勇, 熊熊, 等. 2014. 利用区域宽频带数据反演鲁甸MS6.5级地震震源破裂过程. 地球物理学报, 57(9): 3028–3037. DOI:10.6038/cjg20140927 | |
| 马文涛, 徐长朋, 张新东, 等. 2011. 紫坪铺水库与汶川地震关系的讨论. 地震地质, 33(1): 175–190. | |
| 马文涛, 蔺永, 苑京立, 等. 2013. 水库诱发地震的震例比较与分析. 地震地质, 35(4): 914–929. | |
| 墨宏山. 2000. 水库诱发地震判别研究. 工程地质学报(S1): 478–481. | |
| 谭毅培, 曹井泉, 刘文兵, 等. 2014. 2013年3月涿鹿微震群遗漏地震事件检测和发震构造分析. 地球物理学报, 57(6): 1847–1856. DOI:10.6038/cjg20140616 | |
| 王辉, 曹建玲, 荆燕, 等. 2012. 川滇地区强震活动前b值的时空分布特征. 地震地质, 34(3): 531–543. | |
| 王亮, 李彤霞, 王岩, 等. 2015. 辽宁地区地震目录最小完整性震级研究. 防灾减灾学报, 31(4): 20–24. | |
| 王未来, 吴建平, 房立华, 等. 2014. 2014年云南鲁甸MS6.5地震序列的双差定位. 地球物理学报, 57(9): 3042–3051. DOI:10.6038/cjg20140929 | |
| 徐锡伟, 江国焰, 于贵华, 等. 2014. 鲁甸6.5级地震发震断层判定及其构造属性讨论. 地球物理学报, 57(9): 3060–3068. DOI:10.6038/cjg20140931 | |
| 杨清源, 胡毓良, 陈献程, 等. 1996. 国内外水库诱发地震目录. 地震地质, 18(4): 453–461. | |
| 杨晶琼, 杨周胜, 蔡明军, 等. 2013. 云南地区近震震级与面波震级转换关系研究. 中国地震, 29(4): 513–521. | |
| 张广伟, 雷建设, 梁姗姗, 等. 2014. 2014年8月3日云南鲁甸MS6.5级地震序列重定位与震源机制研究. 地球物理学报, 57(9): 3018–3027. DOI:10.6038/cjg20140926 | |
| 张建中, 宋良玉. 1981. 地震b值的估计方法及其标准误差——应用蒙特卡罗方法估计b值精度. 地震学报, 3(3): 292–301. | |
| 张盛峰, 吴忠良, 房立华. 2014. 双差 (DD) 定位地震目录能用于地震序列的统计地震学参数计算吗?——云南鲁甸MS6.5地震序列b值的空间分布. 地震地质, 36(4): 1244–1259. | |
| 张勇, 许力生, 陈运泰, 等. 2014. 2014年8月3日云南鲁甸MW6.1(MS6.5) 地震破裂过程. 地球物理学报, 57(9): 3052–3059. DOI:10.6038/cjg20140930 | |
| 张勇, 陈运泰, 许力生, 等. 2015. 2014年云南鲁甸MW6.1地震:一次共轭破裂地震. 地球物理学报, 59(1): 153–162. DOI:10.6038/cjg20150113 | |
| 郑秀芬, 欧阳飚, 张东宁, 等. 2009. "国家数字测震台网数据备份中心"技术系统建设及其对汶川大地震研究的数据支撑. 地球物理学报, 52(5): 1412–1417. DOI:10.3969/j.issn.0001-5733.2009.05.031 | |
| 朱艾斓, 徐锡伟, 胡平, 等. 2005. 首都圈地区b值随震源深度的变化:对地震成核的意义. 科学通报, 50(8): 788–792. | |
 2017, Vol. 60


