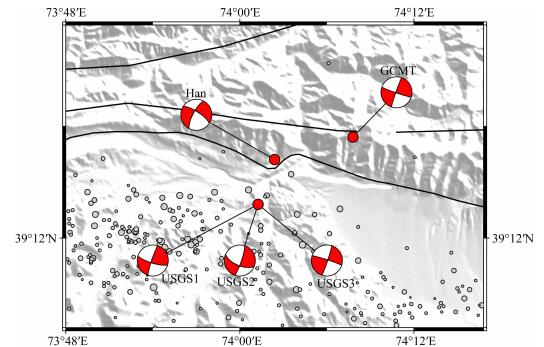
根据中国地震台网测定,北京时间2016年11月25日22时24分在我国新疆克孜勒苏州阿克陶县发生MS6.7地震,震中位于39.3°N,74.0°E,震源深度为10 km.地震发生后,国内外一些地震研究机构发布了这次地震的震源位置 (表 1和图 1), 并用不同数据和方法测定了此次地震的震源机制 (表 2和图 1).可以看出,不同的机构发布的震源位置也不尽相同,震源机制解之间也存在或多或少差异,尤其是断层的倾向.中国地震局地球物理研究所对早期余震进行了双差定位, 对主震震源机制和震源破裂过程也进行了初步反演, 对地震引起的近场地震动也进行了估计 (http://www.cea-igp.ac.cn/tpxw/275080.shtml[2016-12-22]).根据这些初步结果,此次地震序列似乎并未发生在当地的主要断层上 (图 1和图 2).
|
|
表 1 主震震源位置 Table 1 Hypocenter locations of the mainshock |
|
图 1 不同机构测定的新疆阿克陶MS6.7地震震中与震源机制解 图中灰色圆圈为余震,黑色粗线为当地主要断层 (参见表 1和表 2). Fig. 1 Epicenters and mechanisms of the Aketao MS6.7 earthquake from different institutions Gray circles are aftershocks, and black solid lines are local major faults (see Table 1 and Table 2 for details). |
|
|
表 2 主震震源机制 Table 2 Focal mechanisms of the mainshock |
|
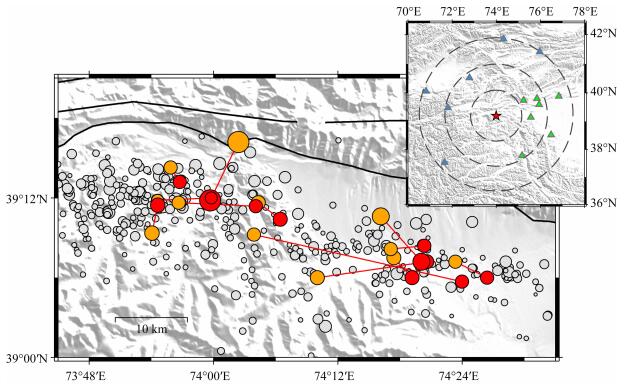
图 2 主震和挑选余震重定位前后震中位置对比 灰色圆圈表示原始地震目录中余震分布,橙色圆圈表示重定位前震中位置,红色圆圈表示重定位后震中位置,红色直线将定位前后震中连接起来.黑色实线表示主要断层.右上角子图为主震震中及震中距小于300 km的台站分布,红色五角星表示主震震中,蓝色三角形表示台站来自IRIS,绿色三角形表示台站来自中国地震台网. Fig. 2 Comparison of the epicenter locations of the mainshock and the selected aftershocks before with after relocation Gray circles are the aftershocks in original catalog, orange ones are the original locations, red ones are the relocated locations, red lines link the corresponding events. Black solid lines are local major faults. Inset: Distribution of the mainshock and the used stations. Red star is mainshock, blue triangulars are the stations from IRIS, and green ones are from the CDSN. |
为了更准确地确定此次地震的震源参数, 更好地认识此次地震的震源复杂性,我们全面收集国内外地震资料 (国家测震台网数据备份中心,2007;郑秀芬等,2009;IRIS数据中心),采用逆时成像技术 (许力生等, 2013a, 2013b) 对主震及4级以上余震进行了重定位, 采用广义极性振幅技术 (严川和许力生,2014;严川等,2015) 反演了主震及较大余震的震源机制, 对截止2016年11月28日的434次余震进行了双差定位, 基于定位结果和震源机制结果,利用远场波形资料反演了此次地震的震源破裂过程,最后,基于反演得到的有限动态源模型,利用许力生等 (2016)提出的烈度预估方法,估计了此次地震的烈度分布.
2 震源位置从国家地震台网 (国家测震台网数据备份中心,2007;郑秀芬等,2009) 和IRIS数据中心获取的波形数据中,我们进一步筛选出如图 2所示的震中距小于300 km的台站,基于ak135模型 (Kennett et al., 1995),采用逆时成像技术 (许力生等, 2013a, 2013b) 对主震和4级以上的11次余震进行了重新定位.定位结果如表 3和图 2所示,可以清楚地看到,定位前后具有明显变化,定位后震中位置更趋于线型排列,且处于余震条带内.需要说明的是,震中附近没有台站,可用台站的最小震中距约120 km,因此,这些地震的震源深度的不确定性仍然很大 (表 3).
|
|
表 3 主震和挑选余震的重定位结果 Table 3 Relocation results of the mainshock and the selected aftershocks |
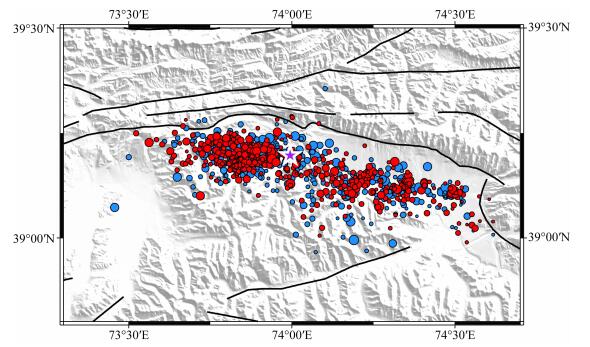
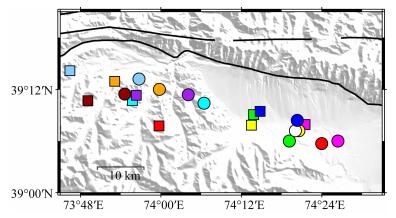
为了尽可能准确认识发震断层结构,我们利用双差定位技术 (Waldhauser and Ellsworth, 2000),基于中国地震台网中心提供的震相报告对主震发生后约40 h内1级以上余震进行了相对定位.从震相报告共获得480次余震,经过筛选和定位共得到434次事件的相对位置.如图 3所示, 定位前后这些地震的相对位置发生了较大变化,定位后的余震更集中,更趋于条带型分布.同时, 我们还比较了利用逆时成像技术重新确定的4级以上余震位置和这些地震双差定位的结果.如图 4所示,即使双差定位后这些地震的位置与利用逆时成像技术重新确定的位置也有明显不同.
|
图 3 双差定位前后余震序列震中分布比较 蓝色圆圈为定位前余震,红色圆圈为定位后余震.紫色五角星为本研究确定的主震位置.黑色实线为主要断层. Fig. 3 Comparison of the aftershock locations before with after the DD relocation Blue circles are aftershocks before relocation, and red ones are those after relocation. Purple star is the mainshock located in this study. Black solid lines are local major faults. |
|
图 4 逆时成像结果与双差定位结果的比较 圆圈表示逆时成像结果,正方形表示双差定位结果.相同颜色表示相同地震.注意:其中一个事件没有双差定位结果. Fig. 4 Comparison of the results from the time-reversal imaging technique with those from the DD technique Circles mean from the time-reversal imaging technique while squares mean from the DD technique. The same color means the same event. Note: one event has no DD-result. |
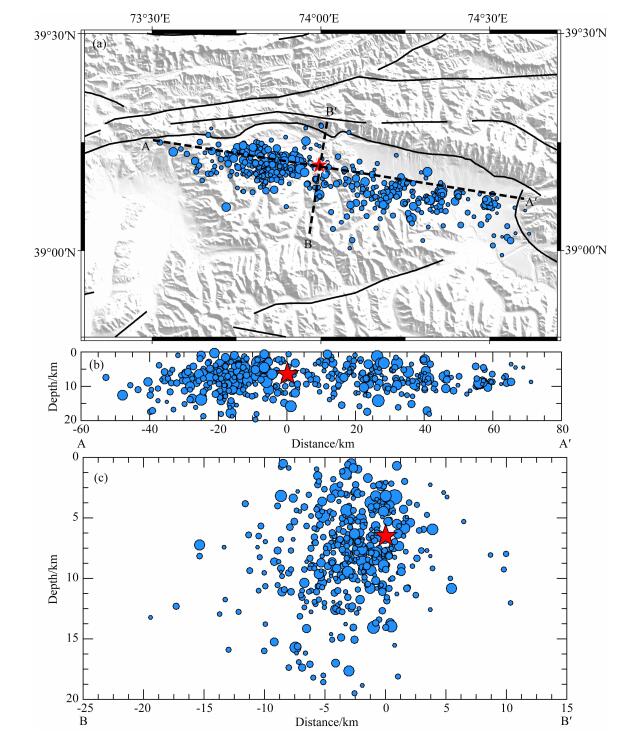
根据定位后的震中分布,我们利用线性拟合的方法,获得了余震分布的最佳走向99°,并沿走向AA′和垂直于走向BB′建立了余震分布剖面 (图 5).可以看出,这次地震序列震源深度较浅,大多数都集中在20 km以上的范围内.从沿走向的剖面看,余震沿发震断层展布约140 km,其中震中以西约60 km,以东约80 km;从垂直于走向的剖面看,主震震源周围相当大的尺度内 (~30 km) 都有余震分布,很难辨识出断层的倾角,但似乎西南侧余震较多.
|
图 5 主震与双差定位后余震分布 (a) 主震与余震震中分布;(b) 主震与余震在AA′剖面上的投影;(c) 主震与余震在BB′剖面上的投影. Fig. 5 Distribution of the mainshock and the DD-relocated aftershocks (a) The epicenters of the mainshock and aftershocks; (b) The mainshock and aftershocks projected on profile AA′; (c) The mainshock and aftershocks projected on profile BB′. |
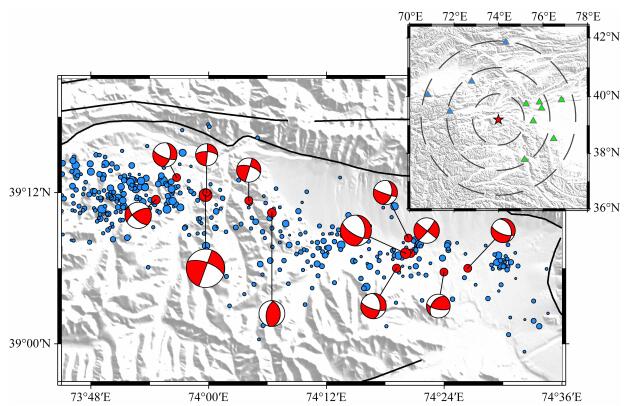
余震的震源机制有助于认识主震的发震机制,为此,我们利用图 6所示的震中距300 km范围内的地震记录反演确定了主震及挑选的11次4级以上余震的震源机制.格林函数的计算采用了反射率方法 (Wang, 1999),计算格林函数采用的模型与前面定位时的模型相同,反演方法为严川和许力生 (2014),严川等 (2015)基于初动符号法 (Hardebeck and Shearer, 2002) 以及振幅类方法 (Ebel and Bonjer, 1990) 发展的广义极性振幅方法.反演结果如表 4和图 6所示,可以看出,主震的震源机制以走滑为主,且与在几乎与主震相同的位置发生的另一次较大余震的震源机制非常相似.但是并不是所有的余震都是走滑机制,其中2次以逆冲为主,5次以正滑为主.如果分为东西两段,则西段 (~73.8°E—74.1°E) 具有走滑兼逆冲特征,而东段 (~74.3°E—74.5°E) 则具有正断兼走滑特征.
|
图 6 主震与挑选余震的震源机制解 (参看图 2) Fig. 6 Focal mechanisms of the mainshock and the selected aftershocks (see Fig. 2 for details) |
|
|
表 4 主震与挑选余震的震源机制 Table 4 Focal mechanisms of the mainshock and the selected aftershocks |
为了反演主震的破裂过程,需要事先给定断层的走向和倾角,并给定初始破裂点以及断层初始模型的尺度.考虑到震源的起始破裂点必须是震源位置,所以我们让断层面经过本研究确定的震源位置 (39.197°N,73.995°E,6.5 km).考虑到余震的空间分布、不同研究机构测定的震源机制以及本研究反演得到的震源机制,我们给定初始模型的倾角为90°,让初始模型的走向为余震分布的最佳走向99°,且给定初始模型的滑动角为180°(纯右旋走滑).考虑到余震的空间分布,我们给定初始模型的下边界距地表 21 km,让初始模型的东南边界和西北边界距震中均为39 km.最后将整个断层面划分成3 km×3 km的子断层.
为了尽可能减少反演参数以达到稳定反演结果的目的,反演时通常需要给定最大破裂速度和子断层最大滑动时间 (张勇,2008;张旭和许力生,2015;张旭等,2016;许力生等,2016).我们尝试了一系列最大破裂速度和子断层滑动时间,最终以3 km·s-1作为最大破裂速度,以15 s为子断层最大滑动时间.当然,为了反演结果的稳定并具有可理解的物理意义,与以往一样,还引入了空间和时间光滑约束 (Yagi et al., 2004; 张勇, 2008),以及标量地震矩最小约束 (Hartzell and Heaton, 1983; Antolik and Dreger, 2003; 张勇, 2008).
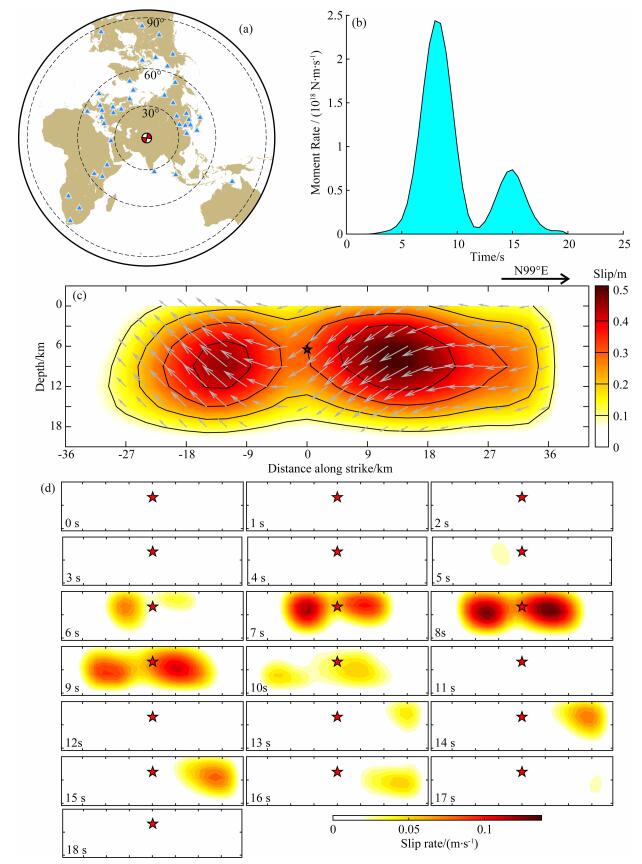
我们从全球台网和中国地震台网选择了如图 7a所示的41个台站的P波波形,采用ak135全球速度模型 (Kennett et al., 1995),利用反射率方法计算格林函数 (Wang, 1999),并采用共轭梯度法 (Chen and Xu, 2000; Xu et al., 2002; 张勇,2008) 求解方程系统,反演结果如图 7b—7d所示.
|
图 7 主震震源破裂过程反演结果 (a) 参与反演的台站分布;(b) 地震矩率函数;(c) 同震滑动分布;(d) 滑动速率快照. Fig. 7 The inverted result of the spatio-temporal rupture process of the main shock (a) Distribution of the used stations; (b) Moment rate function; (c) Distribution of the co-seismic static slip; (d) Snapshots of the slip rate. |
根据反演得到的矩率函数 (图 7b),地震持续~20 s,地震开始前5 s释放地震矩微乎其微,大部分地震矩释放在5~11 s,12~20 s之间也有明显的释放,整个过程释放标量矩为1.08×10¹⁹N·m,相当于矩震级MW6.6.根据静态位错分布 (图 7c),此次地震是一次非对称双侧破裂,具有两个明显的位错高值区,其中心分别距起始破裂点12 km和15 km,西侧区域位错较小,东侧区域位错较大,最大位错量~0.5 m.需要特别强调的是,尽管总体上这次地震以走滑为主,但震源东侧具有明显的正滑分量,而西侧却有明显的逆冲分量.根据滑动速率快照结果 (图 7d),这次地震首先向西侧破裂,紧接着东侧也开始破裂,在随后的时间里初始破裂点两侧同时破裂,然后西侧破裂逐渐停止,东侧继续破裂,最后整个地震以东侧破裂停止告终.
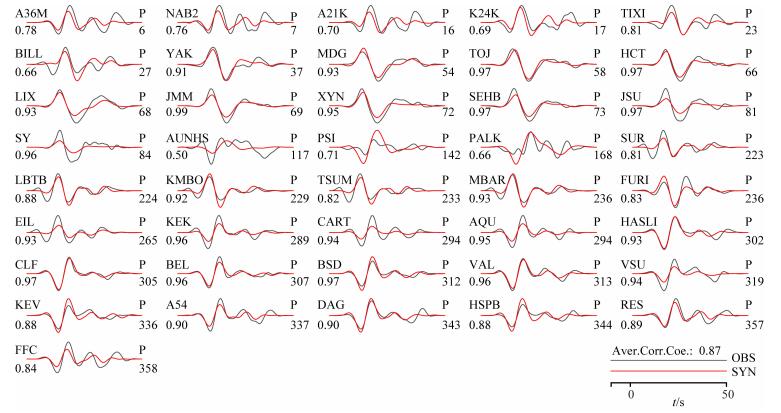
我们用反演得到的有限动态模型计算了相应台站的合成波形,并与观测波形进行了对比.如图 8所示,大部分观测波形都得到很好的拟合,平均相关系数达0.87.
|
图 8 观测波形与合成波形的比较 灰色为观测波形,红色为合成波形.每幅子图左侧为台站名和相关系数,右侧为震相名和台站方位角 (单位°). Fig. 8 Comparison of the observed and synthetic waveforms Gray waveforms are the observed, and red ones are the synthetic. On the left side of each subplot are station code and correlation coefficient, and on the right side of each one are phase and station-azimuth. |
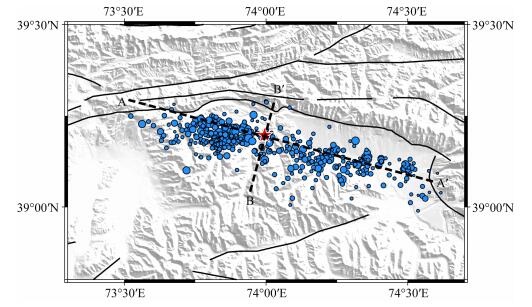
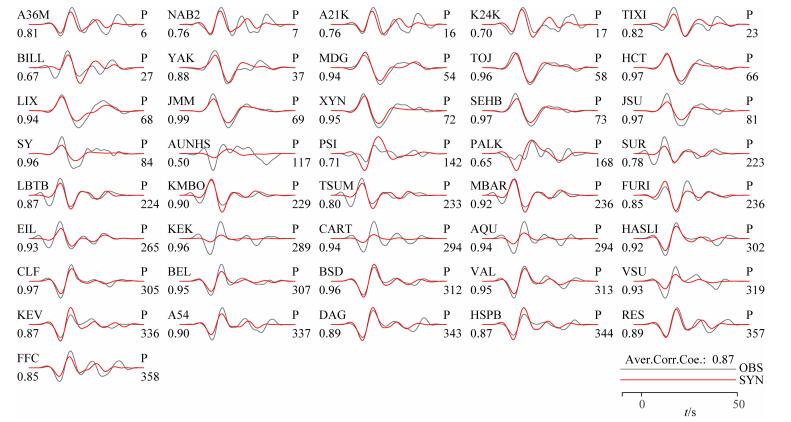
需要说明的是,在进行破裂过程反演时,断层面的走向采用了利用余震震中分布拟合的99°,但这个走向似乎与震中以东的余震分布不是很吻合 (图 5a),于是我们也尝试了看似更吻合的105°(如图S1所示).结果发现,基于105°走向的反演结果与基于99°走向的反演结果在几何属性上没有明显差别 (如图S2所示),但某些观测点 (例如:KEK、CART和AQU) 的波形的振幅却出现明显差异 (如图S3所示),所以我们采用了99°走向对应的反演结果.
|
图 S1 主震与双差定位后余震分布黑色虚线AA′表示走向105°的垂直断层在地表的迹. Fig. S1 Distribution of the mainshock and the DD-relocated aftershocks Black dashed line AA′represents the surface trace of the vertical fault of 105° strike. |

|
图 S2 走向105°和倾角90°情形下主震震源破裂过程反演结果 (a) 地震矩率函数;(b) 同震滑动分布. Fig. S2 The inverted result of the spatio-temporal rupture process of the main shock in case of 105° strike and 90° dip (a) The moment rate function; (b) The co-seismic static slip. |
|
图 S3 观测波形与合成波形的比较 (详细参见图 8) Fig. S3 Comparison of the observed and synthetic waveforms (for details, see Fig. 8) |
烈度是对地震复杂地面运动的简单描述,更是对震害的直接反映 (Wald et al., 1999a, 1999b).获得了烈度分布实质上相当于获得了震害分布,这对于震后应急救援十分重要 (许力生等,2016).随着观测技术和计算技术的发展,通过地面运动的观测和计算获得地震烈度逐渐成为现实 (Teng et al., 1997; Wu et al., 2001; 李山有等,2002;王玉石等,2008;Moratto et al., 2009),但是,前提是在震区具有高密度的地震或强震观测.对于2016年11月25日阿克陶MS6.7地震,当地强震观测和地震观测均较少,显然利用实际观测确定烈度分布是不可能的.为此,我们利用基于有限动态源的烈度估计方法 (许力生等,2016) 对这次地震造成的烈度予以估计,以期对其他相关工作有所参考.
以前我们已经详细介绍过基于有限动态源的烈度估计方法,并利用数值实验讨论了体现几何学和运动学特性的参数的作用以及断层的倾角和破裂速度的影响,也将这种方法应用于实际震例,讨论过这种方法的实用性与不足之处 (许力生等,2016),在这里不再赘述.
本研究将评估方法直接应用于阿克陶MS6.7地震,得到如图 9所示的烈度分布.从图中可以看出,烈度椭圆长轴方向与主震破裂方向一致,也与余震展布的方向一致,最大烈度约为Ⅸ度,区域很小,主要集中在震中以东.Ⅷ度区呈纺锤形,但东侧面积略大于西侧.Ⅴ-Ⅶ度区大体呈椭圆形,东侧面积略大于西侧.由于这次地震总体上呈双侧破裂,所以烈度椭圆在东—西方向均有拉伸,但震中东侧的滑动区较浅,滑动量较大,破裂时间较长,所以震中以东方向震害程度大于以西方向.

|
图 9 基于有限动态源模型估计的烈度分布白色线条为当地主要断层,红色五星为主震. Fig. 9 Distribution of the estimated intensity based on the inverted finite-dynamic source model White lines are the local major faults, and red star is the main shock. |
阿克陶MS6.7地震序列主震及其11次强余震的重新定位,以及434次余震的双差定位更清楚地确立了这次地震发震构造的位置和展布方向.这次地震发生在走向约99°或279°的断层上,很可能是新断层或隐伏断层的错动所致,与当地已知主要断层近乎平行但具有一定距离.从主震震源机制解和余震的剖面特征可以断定,这次地震的发震断层近乎直立,因为利用不同的资料和方法确定的断层倾向有所不同,有些倾向北北东,有些倾向南南西,但倾角都较陡,余震在垂直于走向的剖面上也分布在较大的范围,没有明显的优势倾向.
值得关注的是,强余震的震源机制表明,震中东侧的余震具有明显的正断分量,这和震源过程反演结果中震中东侧的滑动区具有明显的正断分量相吻合,表明这次地震震源动力过程比较复杂.另外,震中西侧的余震较多,且空间上向西南发生弯曲,而根据破裂过程反演结果,震中西侧先破裂先结束,且具有明显的逆冲分量,似乎表明这次地震的发震构造在西侧受到西南向构造阻挡,导致断层逆冲并向西南延伸.
地震引起的地面运动取决于震源过程和场地条件,但近震源的地面运动强度或烈度则主要依赖于震源过程.我们使用的有限动态源烈度估计方法没有考虑场地条件,仅考虑震源的运动学和几何学影响,所以在场地条件极端特殊的情况下用这种方法得到的结果可能有较大偏差.阿克陶MS6.7地震似乎发生在一个较小的近东西走向的盆地当中,但却无法评估盆地效应对烈度的影响.我们需要强调的是,这里的估计烈度只考虑了震源的运动学和几何学效应.
7 结论2016年11月25日新疆阿克陶MS6.7地震发生在当地一个近乎东西向的小盆地内,并不发生在当地已知断层上,很可能是一条新断层或隐伏断层活动所致,发震断层近乎直立,走向99°或279°,总体上是一次以右旋走滑为主的事件.从空间上看,破裂面可以分为两个位错高值区,分别位于初始破裂点的东西两侧,西侧位错区规模较小,东侧位错区规模较大,最大位错达0.5 m;且西侧错动为走滑兼逆冲,而东侧破裂区为正断兼走滑.从时间上看,地震持续~20 s,前5 s能量释放微乎其微,主要集中在5~11 s,12~20 s之间也有明显释放,整个过程释放地震矩为1.08×19N·m,相当于矩震级MW6.6.根据反演得到的震源破裂时空过程结果,此次强震首先向西侧破裂,紧接着东侧也开始破裂,在随后的时间里初始破裂点两侧同时破裂,然后西侧破裂首先停止,东侧破裂继续,最后整个地震以东侧破裂停止告终.
复杂的震源过程必然引起复杂的地面运动,进而导致特殊的烈度分布.根据烈度估计,烈度椭圆长轴方向与主震破裂方向以及余震展布的方向一致,最大烈度约为Ⅸ度,主要集中在震中以东很小的区域.Ⅷ度区呈纺锤形,分布于震中东西两侧,但东侧面积略大于西侧.Ⅴ-Ⅶ度区大体呈椭圆形,且东侧面积大于西侧.
附录 基于105°走向断层的反演结果 致谢中国地震局地球物理研究所国家测震台网数据备份中心 (doi:10.11998/SeisDmc/SN)、甘肃、黑龙江、湖南、吉林、江苏、辽宁、内蒙古、新疆、西藏、云南、浙江地震台网为本研究提供地震波形数据.Incorporated Research Institutions for Seismology (IRIS) 为本研究提供远场地震波形数据.
| Antolik M, Dreger D S. 2003. Rupture process of the 26 January 2001 MW7.6 Bhuj, India, earthquake from teleseismic broadband data. Bull. Seismol.Soc. Am., 93(3): 1235-1248. DOI:10.1785/0120020142 | |
| Chen Y T, Xu L S. 2000. A time-domain inversion technique for the tempo-spatial distribution of slip on a finite fault plane with applications to recent large earthquakes in the Tibetan Plateau. Geophys.J. Int., 143(2): 407-416. DOI:10.1046/j.1365-246X.2000.01263.x | |
| Data Management Centre of China National Seismic Network. 2007. Waveform data of China National Seismic Network. Institute of Geophysics, China Earthquake Administration, doi:10.11998/SeisDmc/SN, http://www.seisdmc.ac.cn. | |
| Ebel J E, Bonjer K P. 1990. Moment tensor inversion of small earthquakes in southwestern Germany for the fault plane solution. Geophys.J. Int., 101(1): 133-146. DOI:10.1111/gji.1990.101.issue-1 | |
| Hardebeck J L, Shearer P M. 2002. A new method for determining first-motion focal mechanisms. Bull. Seismol.Soc. Am., 92(6): 2264-2276. DOI:10.1785/0120010200 | |
| Hartzell S H, Heaton T H. 1983. Inversion of strong ground motion and teleseismic waveform data for the fault rupture history of the 1979 Imperial Valley, California, earthquake. Bull. Seismol.Soc. Am., 73(6A): 1553-1583. | |
| Kennett B L N, Engdahl E R, Buland R. 1995. Constraints on seismic velocities in the Earth from traveltimes. Geophys.J. Int., 122(1): 108-124. DOI:10.1111/gji.1995.122.issue-1 | |
| Li S Y, Jin X, Chen X, et al. 2002. Rapid reporting of peak strong motion and seismic intensity. Earthquake Engineering and Engineering Vibration , 22(6): 1-7. | |
| Moratto L, Gosta G, Suhadolc P. 2009. Real-time generation of Shake Maps in the southeastern Alps. Bull. Seismol.Soc. Am., 99(4): 2489-2501. DOI:10.1785/0120080283 | |
| State Earthquake Information Service-Data Management Centre. 2007. Waveform data of China National Seismic Network. Institute of Geophysics, China Earthquake Administration, http://www.seisdmc.ac.cn. | |
| Teng T L, Wu L D, Shin T C, et al. 1997. One minute after:Strong-motion map, effective epicenter and effective magnitude. Bull. Seismol.Soc. Am., 87(5): 1209-1219. | |
| Wald D J, Quitoriano V, Heaton T H, et al. 1999a. Relationships between peak ground acceleration, peak ground velocity, and modified Mercalli intensity in California. Earthquake Spectra, 15(3): 557-564. DOI:10.1193/1.1586058 | |
| Wald D J, Quitoriano V, Dengler L A, et al. 1999b. Utilization of the Internet for rapid community intensity maps. Seismol.Res. Lett., 70(6): 680-697. DOI:10.1785/gssrl.70.6.680 | |
| Waldhauser F, Ellsworth W L. 2000. A double-difference earthquake location algorithm:Method and application to the Northern Hayward fault, California. Bull. Seismol.Soc. Am., 90(6): 1353-1368. DOI:10.1785/0120000006 | |
| Wang R J. 1999. A simple orthonormalization method for stable and efficient computation of Green's functions. Bull. Seismol.Soc. Am., 89(3): 733-741. | |
| Wang Y S, Zhou Z H, Wang W. 2008. A hypothesis testing based method for seismic intensity rapid assessment by strong ground motion parameters. Journal of Earthquake Engineering and Engineering Vibration, 28(5): 49-54. | |
| Wu Y M, Shin T C, Chang C H. 2001. Near real-time mapping of peak ground acceleration and peak velocity following a strong earthquake. Bull. Seismol.Soc. Am., 91(5): 1218-1228. | |
| Xu L S, Chen Y T, Teng T L, et al. 2002. Temporal-spatial rupture process of the 1999 Chi-Chi Earthquake from IRIS and GEOSCOPE long-period waveform data using aftershocks as empirical Green's functions. Bull. Seismol.Soc. Am., 92(8): 3210-3228. DOI:10.1785/0120010173 | |
| Xu L S, Du H L, Yan C, et al. 2013a. A method for determination of earthquake hypocentroid:time-reversal imaging technique I-Principle and numerical tests. Chinese J. Geophys., 56(4): 1190-1206. DOI:10.6038/cjg20130414 | |
| Xu L S, Yan C, Zhang X, et al. 2013b. A method for determination of earthquake hypocentroid:Time-reversal imaging technique-An examination based on people-made earthquake. Chinese J. Geophys., 56(12): 4009-4027. DOI:10.6038/cjg20131207 | |
| Xu L S, Zhang X, Wei Q, et al. 2016. A method for estimating the earthquake intensity caused by a finite-dynamic source. Chinese J. Geophys., 59(10): 3684-3695. DOI:10.6038/cjg20161015 | |
| Yagi Y, Mikumo T, Pacheco J, et al. 2004. Source rupture process of the Tecomán, Colima, Mexico Earthquake of 22 January 2003, determined by joint inversion of teleseismicbody-wave and near-source data. Bull. Seismol.Soc. Am., 94(5): 1795-1807. DOI:10.1785/012003095 | |
| Yan C, Xu L S. 2014. An inversion technique for the mechanisms of local and regional earthquakes:generalized polarity and amplitude technique (Ⅰ)-Principle and numerical tests. Chinese J. Geophys., 57(8): 2555-2572. DOI:10.6038/cjg20140816 | |
| Yan C, Xu L S, Zhang X, et al. 2015. An inversion technique for mechanisms of local and regional earthquakes:generalized polarity and amplitude technique (Ⅱ):An application to real seismic events. Chinese J. Geophys., 58(10): 3601-3614. DOI:10.6038/cjg20151014 | |
| Zhang X, Xu L S. 2015. Inversion of the apparent source time functions for the rupture process of the Nepal MS8.1 earthquake.Chinese. J. Geophys., 58(6): 1881-1890. | |
| Zhang X, Yan C, Xu L S. 2016. Analysis of the love-waves for the rupture processes of the 2014 earthquake-doublet of Kangding, Sichuan. Chinese J. Geophys., 59(7): 2453-2467. DOI:10.6038/cjg20160712 | |
| Zhang Y. 2008. Study on the inversion methods of source rupture process[Ph. D. thesis] (in Chinese). Beijing:Peking University. | |
| Zheng X F, Ouyang B, Zhang D N, et al. 2009. Technical system construction of Data Backup Centre for China Seismograph Network and the data support to researches on the Wenchuan earthquake. Chinese J. Geophys., 52(5): 1412-1417. DOI:10.3969/j.issn.0001-5733.2009.05.031 | |
| 国家测震台网数据备份中心. 2007. 国家测震台网地震波形数据. 中国地震局地球物理研究所, http://www.seisdmc.ac.cn[2016-12-10]. | |
| 李山有, 金星, 陈先, 等. 2002. 地震动强度与地震烈度速报研究. 地震工程与工程振动, 22(6): 1–7. | |
| 王玉石, 周正华, 王伟. 2008. 基于假设检验的地震动强度 (烈度) 速报方法. 地震工程与工程振动, 28(5): 49–54. | |
| 许力生, 杜海林, 严川, 等. 2013a. 一种确定震源中心的方法:逆时成像技术 (一)——原理与数值实验. 地球物理学报, 56(4): 1190–1206. DOI:10.6038/cjg20130414 | |
| 许力生, 严川, 张旭, 等. 2013b. 一种确定震源中心的方法:逆时成像技术 (二)——基于人工地震的检验. 地球物理学报, 56(12): 4009–4027. DOI:10.6038/cjg20131207 | |
| 许力生, 张旭, 魏强, 等. 2016. 一种基于有限动态源的烈度估计方法. 地球物理学报, 59(10): 3684–3695. DOI:10.6038/cjg20161015 | |
| 严川, 许力生. 2014. 一种地方与区域地震震源机制反演技术:广义极性振幅技术 (一)——原理与数值实验. 地球物理学报, 57(8): 2555–2572. DOI:10.6038/cjg20140816 | |
| 严川, 许力生, 张旭, 等. 2015. 一种地方与区域地震震源机制反演技术:广义极性振幅技术 (二)——对实际震例的应用. 地球物理学报, 58(10): 3601–3614. DOI:10.6038/cjg20151014 | |
| 张旭, 许力生. 2015. 利用视震源时间函数反演尼泊尔MS8.1地震破裂过程. 地球物理学报, 58(6): 1881–1890. | |
| 张旭, 严川, 许力生. 2016. 2014年四川康定双震震源的勒夫波分析. 地球物理学报, 59(7): 2453–2467. DOI:10.6038/cjg20160712 | |
| 张勇. 2008. 震源破裂过程反演方法研究[博士论文]. 北京: 北京大学. | |
| 郑秀芬, 欧阳飚, 张东宁, 等. 2009. "国家数字测震台网数据备份中心"技术系统建设及其对汶川大地震研究的数据支撑. 地球物理学报, 52(5): 1412–1417. DOI:10.3969/j.issn.0001-5733.2009.05.031 | |
 2017, Vol. 60


