2. 山东省地震局, 济南 250014
2. Shandong Earthquake Agency, Ji'nan 250014, China
图像信息学PI(Pattern Informatics)算法作为一种判定区域中长期地震危险性趋势的统计物理学算法,已经被应用到美国California地区(Tiampo et al., 2002a, 2002b; Rundle et al., 2002, 2003, Holliday et al., 2007)、日本(Nanjo et al., 2006a, 2006b)、中国川滇(蒋长胜和吴忠良, 2008; Jiang and Wu, 2010, 2011;Zhang et al., 2013, 2016; 蒋卉等,2013;张小涛等,2014)、西南(李志海和黄瑜,2010;夏彩韵等,2015a)及台湾地区(Wu et al., 2008, 2016)等的地震活动回溯性研究中,同时,PI算法也在多个领域得到扩展,如分析电离层与地震预测预报的关系(武安绪等,2011;夏彩韵等,2015b)、与ETAS及Z-value模型结合构成混合模型(Kawamura et al., 2014)、对PI算法增加深度信息构成三维模型(Toya et al., 2010)及将PI算法引入到中国的年度会商工作中(Zhao et al., 2010; Zhang et al., 2017)等方面,均取得了较为有意义的结果.PI算法假设地震活动是一种具有明显涨落特征的现象,通过分析不同时空尺度内地震活动的变化特征,识别出未来发生较大地震的前兆信息.PI算法的预测结果——“热点”图像有助揭示地震活动的平静和活跃等表现的前兆现象并给出地震危险性结果(Wyss and Habermann, 1988; Bowman et al., 1998).
在将算法应用到地震预测工作前,通常需要进行模型参数优化,其中包含选取的空间网格尺度、预测时间窗长度、目标地震等,不同的参数组合可能对预测结果影响较大(蒋长胜和吴忠良,2008),因此选择合适的、优化的参数组合是一项重要的基础工作.此外,一直以来PI算法多被应用于地震活动水平较高地区,对弱活动地区应用较少.相比中国大陆构造和地震活动较为活跃的川滇、天山等地区,华北地区的地震活动相对较弱,但由于历史上发生过多次严重人员伤亡的强震,其地震危险性值得高度关注和深入研究.
基于PI算法较好的应用潜力和华北地区地震危险性分析的研究意义,本文以山东及邻区为研究区,遍历搜索适应研究区地震活动特征的最优模型参数,利用可定量评估其预测效果的ROC方法检验预测效能,研究相应的参数分布特征,开展研究区的回溯性和“向前”预测,探索PI算法的适用性.
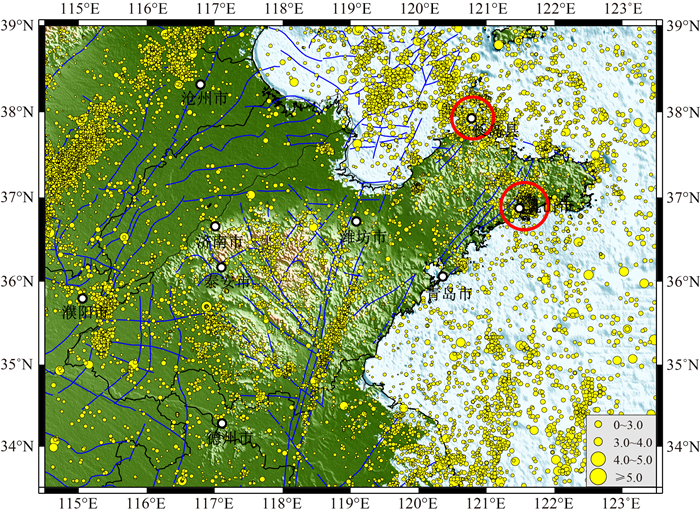
2 资料及研究区地震活动性分析本文所选的研究区位于华北地震区的东南部,历史上曾发生过多次破坏性地震,如1937年8月1日菏泽7.0级地震、1948年5月23日威海西北6.0级地震等.山东区域地震台网经过“九五”、“十五”、“十一五”期间的建设,目前已经建成了数字化、网络化的观测技术系统,全省数字测震台站达到127个,极大地提高了全省范围及邻区的地震监测能力(吕子强等,2013;曲均浩等,2015).我国东部最大规模的郯庐断裂带中段位于研究区中部,近年来该区域地震危险性问题受到极大关注(朱红彬等,2010;严乐佳等,2014).本文将研究范围设置为114.5—123.5°E,33.5—39.5°N,包括山东省全境及邻区.研究所用资料为中国地震台网中心“全国地震编目系统”提供的《统一正式目录》.图 1给出了研究区1970年1月1日至2016年1月1日地震震中分布,由图可见,研究区内胶东半岛沿海地区地震事件分布密集,内陆地区分布相对稀疏,且分布有多个明显的地震丛集,其中主要有长岛震群(刘西林等,2007)及2013年10月1日3.8级地震后的乳山震群(王鹏等,2015)等.

|
图 1 山东地区及邻区1970-01-01—2016-01-01期间震中分布 共包含24095个0级以上地震事件,其中红色圆圈标出的是长岛震群和乳山震群位置. Fig. 1 Distribution of earthquakes in Shandong and its adjacent region in the period of 1970-01-01—2016-01-01 It contains 24, 095 M≥0 events and two red circles show the Changdao and Rushan earthquake clusters. |
参与PI算法计算的截止震级(MC)是一个重要参数,而截止震级的选取又与区域地震台网测震能力的下限息息相关(Woessner and Wiemer, 2005; Cao and Gao, 2002).由于即使“最好”的地震监测台网,其监测能力也存在时空上的不均匀性(Woessner and Wiemer, 2005),区域最小完整性震级(Minimum Magnitude of Completeness)的大小成为了一个重要指标.本工作利用最大曲率方法MAXC(Maximum curvature-method)(Wiemer and Wyss, 2000)、拟合度检测GFT(Goodness-of-fit method)方法(Wiemer and Wyss, 2000)综合分析了研究区最小完整性震级的时间变化.MAXC方法是将震级-频度曲线取一阶导数得到拐点处的完整性震级,GFT方法是根据实际和理论震级-频度分布下的拟合度来搜索得出完整性震级,其中GFT-90和GFT-95分别表示拟合度为90%、95%的结果.为给出较为合理的研究结果,选择的优先次序为GFT-95%>GFT-90%>MAXC,结果如图 2所示.

|
图 2 若干方法计算得到研究区1970-01-01—2016-01-01完整性震级及计算误差时间变化 其中Mc-Best为根据GFT-95%>GFT-90%>MAXC原则选取,绿色横线表示本文所取截止震级,浅红色虚线表示去除乳山震群计算得到的结果.横坐标为按照地震发生时间进行排序的序号,横轴里侧的数字表示1970—2015年度位置. Fig. 2 The temporal variation of minimum completeness magnitude and relative error in the period of 1970-01-01—2016-01-01 using different methods. The Mc-Best result is based on the standard of GFT-95%>GFT-90%>MAXC. Green line indicates the completeness magnitude and the light red dashed line indicates the case in which the Rushan sequence is removed. The x-axis represents the serial number of the events. The number located on x-axis is the location of year 1970—2015. |
可见,以上不同方法计算得到的研究区最小完整性震级差别不大,且在时间上有相似的变化趋势,1970年至2013年全区最小完整性震级在ML2.0左右,2013年后降为ML0.5左右.在测震台网没有明显加密的情况下,为了进一步考察2013年以来完整性震级的降低是否主要受丛集性震群活动的影响,我们计算了2013年后研究区去除乳山地震序列(假设乳山震群占主导因素)的结果,如图 2中浅红色虚线表示,由图可见完整性震级水平恢复至与2013年前相似水平.因此分析这一现象是由于地震丛集的发生,尤其出现了丛集活动较强的乳山震群,记录到大量1级甚至0级以下地震,同时简单的从乳山震群的震级-频次分布上可以看出,其最小完整性震级大约为0.5级,这些大量的小震级事件“显著的”拉低了本研究区的完整性震级结果.另一方面,2015年后由于乳山震群活动减弱导致的整体完整性震级上升也佐证了这一问题.考虑到地震资料的完整性和研究区的地震活跃程度,我们将算法中的截止震级选为如图中绿线标示的ML2.5.由于PI算法用来计算的资料是所取截止震级以上的事件,这里取ML2.5以上地震事件意味着已经去掉了丛集活动产生的小震级事件,一定程度上达到了去丛的效果.
3 统计检验方法—“ROC值”任何一种预测模型的构建都是一种系统性工作,与之对应的是需要有合适的方法对其结果进行检验(Field, 2007),尤其是近年来全球范围内开展的地震可预测性研究CSEP计划及可操作性地震预测概念的提出,不仅发展了用于区域地震危险性分析的多种独立模型和混合模型,同时也提出了若干评估其预测效果的统计检验方法(Schorlemmer et al., 2007; Rhoades et al., 2011),如相对工作特征图表法ROC(Swets, 1973; Jolliffe and Stephenson, 2003)、Molchan图表法(Molchan, 1997)、N-test和L-test(Kagan and Jackson, 1995; Schorlemmer et al., 2007)等.相对工作特征图表法ROC(Receiver Operating Characteristic)常被用来评估二元概率预测模型预测结果的优劣程度(Molchan, 1997; Swets, 1973),最初是被用于气象学中研究某一地区是否会遭受龙卷风的风险程度(Jolliffe and Stephenson, 2003),Holliday等(2005)将其引入到地震预测中的模型检验中来.
ROC基本原理为通过不断提高地震预测的阈值,即虚报率F从0至1变化,分别计算相应情况下的击中率(Hit rate, 简写为H),进而将结果与随机预测(对角线)进行对比,其中根据地震的实际发生情况和预测情况有四种对应结果,分别是正确预报(successful forecast)、漏报(failure forecast)、虚报(unsuccessful forecast or false alarm)、无震报准(successful forecast of non-occurrence),其中发生率r(probability of forecast of occurrence)表示为预测发震的网格数与区域包含所有网格数之比,击中率(H)表示为预测“有震”而实际发震的空间网格数与总的实际发震所占网格数之比,虚报率(False alarm rate,简写为F)表示为预测“有震”而实际未发震的空间网格数与实际未发震所占网格数之比,增益(Gain ratio, 简写为G)表示为两种模型下相应虚报率的击中率之比(见表 1),随机预测一般用击中率与虚报率相等(H=F)的情况表示(Jolliffe and Stephenson, 2003),关系式如下:
|
|
表 1 预测结果与实际发生结果四种情况对比 Table 1 Contingency tables for the ROC diagram containing four cases |

|
(1) |

|
(2) |

|
(3) |

|
(4) |
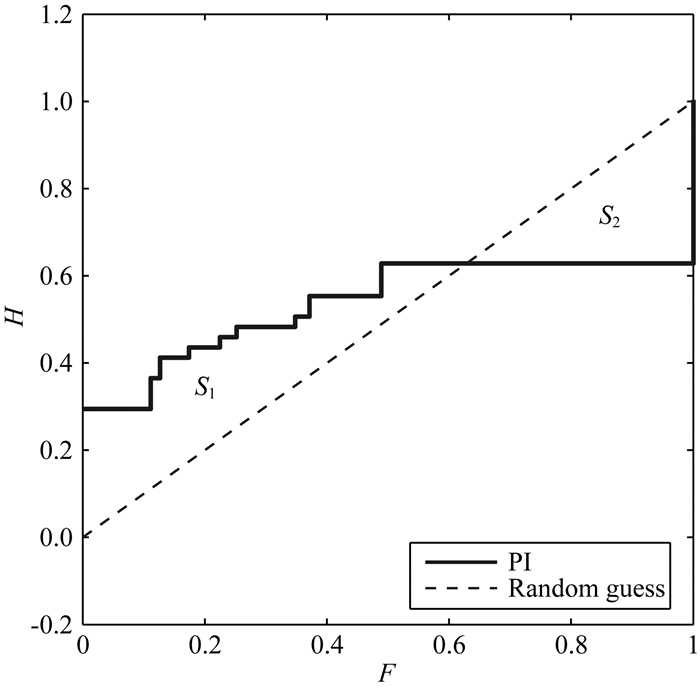
在图 5给出的ROC检验结果中,具体的检验机制以及虚报率的计算说明在此不再赘述,具体可参考有关文献(史勇军等,2003;蒋卉等,2013).本工作为了定量及科学表示算法的预测能力,从ROC方法的基本原理出发,将ROC曲线和横轴所围面积与随机预测结果(值为0.5)的差值定义为“ROC值”,ROC曲线高于随机预测的面积S1取为正,低于随机预测的面积S2取为负,当算法的预测效能越好时,ROC曲线与对角线所围有效面积越大,即“ROC值”越大,由此可知其浮动范围为-0.5~0.5,图 3为ROC曲线与随机预测曲线示例图.本文将利用针对不用参数组合下计算得到的“ROC值”定量表示相应的PI算法预测效能.

|
图 3 “ROC值”的表示方法示意图 图中黑色实线表示评估PI算法预测效能的ROC曲线,虚线对角线表示随机预测,“ROC值”以ROC曲线与随机预测曲线所围有效面积表示,即S1-S2. Fig. 3 The schematic diagram of "ROC value" method The black line shows the ROC evaluated result, and the dashed diagonal line shows the result of random guess. "ROC value" is definited as the effective area of S1 and S2. |

|
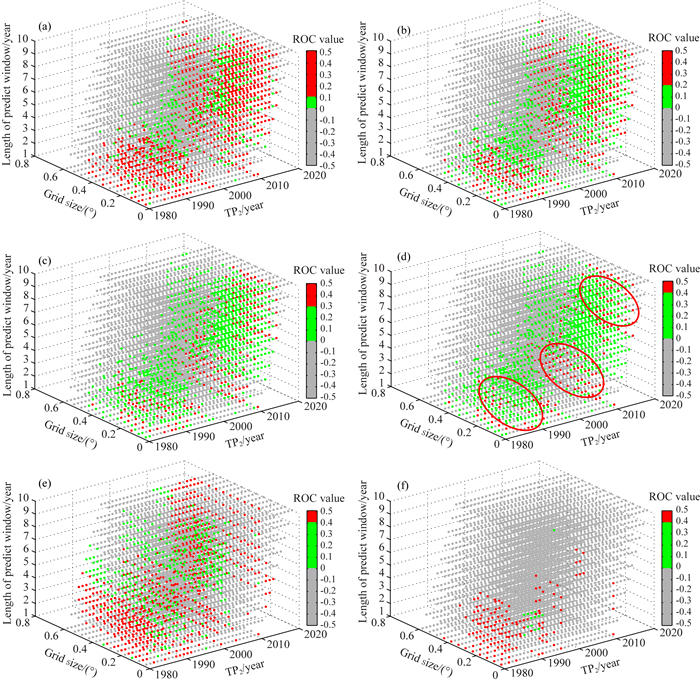
图 4 不同参数设置及计算阈值下的“ROC值”分布 其中灰色格点表示“ROC值”-0.5~0结果,绿点和红点分别表示“ROC值”0~阈值和阈值~0.5结果,(a)—(d)分别表示目标震级ML4.0且阈值为0.1、0.2、0.3、0.4的结果,(d)中红圈表示当前情况下的三个参数组合优势分布,(e)—(f)分别表示目标震级ML4.5、ML5.0且阈值为0.4的结果. Fig. 4 The distribution of ROC value under different parameter settings and threshold values The grey dots indicates the ROC value which located on -0.5~0. The red and green dots indicate the results of ROC value located on 0~threshold and threshold~0.5, respectively. (a)~(d) show the results of different threshold of 0.1、0.2、0.3、0.4 under the target magnitude ML4.0. The red circles in (d) represent three optimal distributions of combined parameter settings. (e) and (f) indicate the results of threshold 0.4 under the target magnitude ML4.5 and ML5.0. |

|
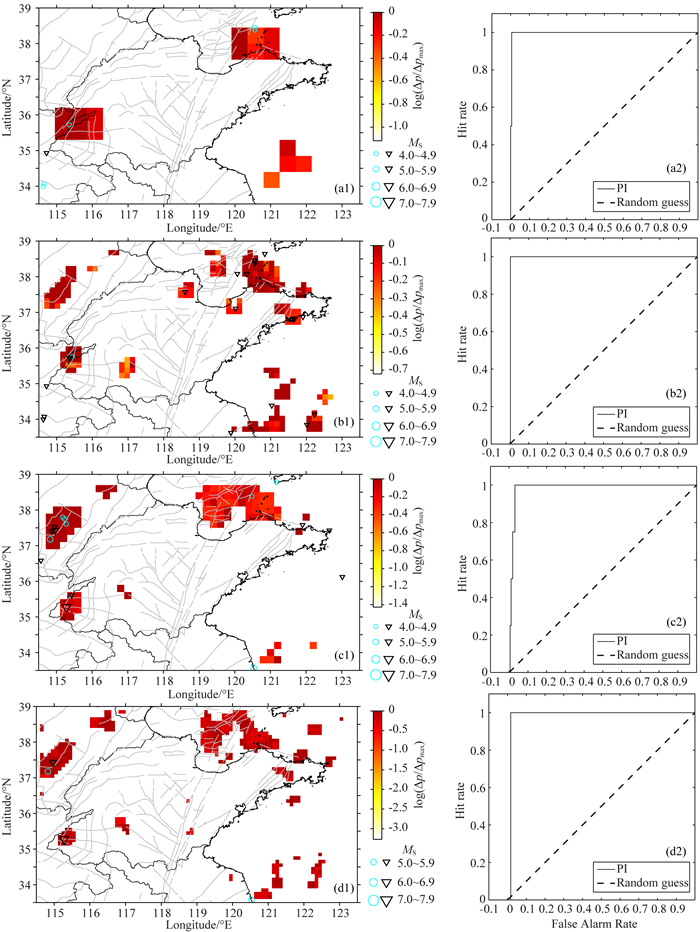
图 5 优势参数区间下的PI算法预测“热点”分布及ROC检验结果 蓝色圆圈表示目标地震,黑色倒三角表示“异常学习”窗口内的目标以上地震.其中(a1)(a2)分别表示网格尺度0.45°、截止震级MC2.5、预测时间窗2010-01-01—2012-01-01、目标震级ML4.0下的“热点”分布及ROC检验结果;(b1)(b2)分别表示网格尺度0.15°、截止震级MC2.5、预测时间窗2016-01-01—2024-01-01、目标震级ML4.0下的“热点”分布及ROC检验结果;(c1)(c2)分别表示网格尺度0.2°、截止震级MC2.5、预测时间窗1985-01-01—1990-01-01、目标震级ML4.5下的“热点”分布及ROC检验结果;(d1)(d2)分别表示网格尺度0.1°、截止震级MC2.5、预测时间窗1985-01-01—1990-01-01、目标震级ML5.0下的“热点”分布及ROC检验结果. Fig. 5 The distribution of 'hot spots' resulted from PI algorithm using the optimized parameter settings and the ROC test relatively Blue circles indicate the target earthquakes and the black inversed triangles indicate the events in the 'anomalous study window' which are greater than the target events. (a1)(a2) indicate the 'hot spots' and the test result of grid size 0.45°, MC2.5, forecast period 2010-01-01—2012-01-01, target event ML4.0, (b1)(b2) indicate the condition of grid size 0.15°, MC2.5, forecast period 2016-01-01—2024-01-01, target event ML4.0. (c1)(c2) indicate the condition of grid size 0.2°, MC2.5, forecast period 1985-01-01—1990-01-01, target event ML4.5. (d1)(d2) indicate the condition of grid size 0.1°, MC2.5, forecast period 1985-01-01—1990-01-01, target event ML5.0. |
基于统计物理学和地震学的PI算法相比于仅局限于研究地震活动强度的RI算法(Relative Intensity algorithm)(Holliday et al., 2006),其优势在于考虑了地震活动的涨落情况(Chen et al., 2005).简单来说,是以小地震活动强的地震区作为未来可能发生较大地震的危险区,即把“小震闹,大震到”的经验推广到预测时段内的定量研究(蒋卉等,2013;蒋长胜和吴忠良,2008).计算过程中包含多个计算参数,参数的系统性选择需要考虑到多个参考因素,包含预测模型与地震孕育尺度的关系、本地区实际发生目标地震的周期性、地震活动发育的不同年份等.这里我们选择三个较为主要且需多次试验的变量,分别为网格尺度大小、预测时间窗长度、预测时间窗起点t2,对各变量的设置见表 2.
|
|
表 2 三种主要计算参数设置 Table 2 Preferences of the three kinds of parameters in computation process |
根据表 2所示的参数选取,利用PI算法经过3720次遍历性运算,得到了不同参数下算法预测的ROC value在网格尺度、预测窗口长度及预测时间窗起点t2下的三维分布,同时为了消除目标震级的影响,本文计算了目标震级分别为ML4.0、ML4.5及ML5.0的情况,结果如图 4所示.其中,灰色格点表示“ROC值”-0.5~0的结果,绿色格点表示“ROC值”0~阈值的结果,红色格点表示阈值以上的结果,(a—d)表示在目标震级ML4.0下的结果,(e,f)分别表示在目标震级ML4.5和ML5.0下“ROC值”阈值0.4的结果,部分数值结果见表 3.由图 4(a—d)中可见,在目标震级ML4.0情况中不同参数设置下PI算法的预测效能变化差异较大,且可以看出存在三个较为明显的参数优势区间(图 4d中红色圆圈标注),推测造成这种结果的主要影响有两方面,一是由于山东地震监测台网1970年以来进行了多次改造,造成了整体监测水平在时间上存在若干个不同阶段;二是虽然MC的选取已经去除了丛集的明显影响,但是仍然存在若干高于MC的丛集事件,即使强度不大,但一直以来的活跃程度对本身特征地震强度较低的山东地区整体仍然存在影响.图 4d中优势区间现象在图 4(e, f)中依然存在,由于山东地区的地震活动性以及较大地震的低频次特征,在目标震级ML5.0情况下优势区间现象减弱.PI算法本身基于的是孕震区自组织临界性特征,假设发生地震的断裂系统处于临界状态,当这些可以有效改变PI算法“输入信息”的因素发生变化时,PI算法的最终结果可能要发生改变,甚至是“质”的变化.
|
|
表 3 部分基于不同参数计算得出的“ROC值”结果 Table 3 Partial results of "ROC value" under different parameter settings |
根据图 4和表 3中利用“ROC值”统计检验的结果,我们选择优势参数区间中的参数设置进行了PI算法的预测实验,结果如图 5所示.图 5(a1,a2)分别表示网格尺度0.45°、截止震级MC2.5、预测时间窗2010-01-01—2012-01-01、目标震级ML4.0下的“热点”分布及ROC检验结果,为回溯性检验;(b1)(b2)分别表示网格尺度0.15°、截止震级MC2.5、预测时间窗2016-01-01—2024-01-01、目标震级ML4.0下的“热点”分布及ROC检验结果,为“向前”预测.(c1, c2)和(d1, d2)分别是目标震级ML4.5和ML5.0下的结果示例.几种情况的预测结果良好,可以看出相应的预测时间段内,研究区内地震较危险地区处于西部省域交接、南黄海及山东半岛北部地区,其中本文使用资料截至2016年2月20日,目前仍然处于(b1, b2)所示的预测时间窗口内,所以相应参数下PI算法“向前”预测的良好效能是否能够持续需要进一步验证.
6 结论及讨论图像信息学(PI)算法相比于以往仅依靠地震数量特征的RI算法,其主要特点是考虑了地震活动的“活跃”与“平静”,常被用于研究地震活动较强地区的地震危险性概率预测.为了研究模型参数对算法效能的影响及探索模型对地震活动较弱地区的适用性,本文以山东及邻区为研究区,利用若干统计检验方法系统分析了山东及邻区的最小完整性震级的时间变化,通过改变概率预测模型包含的网格大小、预测时间窗起点及预测长度三个主要参数,以定量表示预测效能的“ROC值”为检验标准,在不同目标震级情况下遍历分析了不同参数下的PI算法预测结果,主要获得以下认识:
(1) 通过分析发现,不同目标震级下三种计算参数呈现三种不同大小的优势分布,分析原因可能是受到地区监测能力的变化及算法“输入信息”数量的影响,可为PI算法在本研究区的后续应用提供参考;
(2) 地震丛集性作用对研究区整体的完整性震级计算影响较大,其中乳山震群产生的大量小震级事件占主导因素;
(3) 以往应用PI算法选取的背景时间窗/异常学习时间窗/预测时间窗的长度一般为10年/5年/5年,但这种“常规”上的选取对于震级分布两端(特大地震或较小地震)的情况可能需要变的“不常规”,比如本文给出了预测较小地震时时间窗口选取的优势分布情况;
(4) PI算法在分析中长期较大地震发生概率的同时,也可以被用来进行地震活动相对较弱地区的预测工作,更为具体来说,在确定优化参数的前提下,PI算法可为区域地震危险性趋势的判定提供参考.
PI算法应用于其他地区的中强地震预测研究时,目标震级下限一般为5~5.5级,根据以往计算经验,截止震级往往比目标震级小2个震级单位,即取3.0~3.5级以上地震事件,才可得到比较有意义的结果(Rundle et al., 2003; Nanjo et al., 2006a).根据地震活动的标度关系(scaling law),如Gutenberg-Richter关系,PI算法中目标震级的确定无非是在以大震和小震为端点的区间移动,当移向大震级一端时,尤其对于特大地震其预测效果往往不好,比如对我国汶川地震的预测情况(Holliday et al., 2005);当移向小震级一端时涉及到两方面问题,一方面是技术问题,即怎样保证小震级一端目录的完整性,或假设资料是完整的,从小震级事件中发现地震活动的“涨落”特征同样是一难点;另一方面是在物理上地震活动的自相似性对于小到什么程度的地震事件仍然是成立的,Gutenberg-Richter关系显示自相似性对于特大震级事件或特小震级事件都不再成立.针对以上问题,本文工作在一定程度上给出了一定参考.同时本工作有若干其他因素没有考虑,比如在计算过程中没有“干净地”去除地震丛集的影响,而是把主震和余震视作独立的地震事件;PI算法的其他参数,比如“热点”显示比例和边缘处理、滑动计算步长、不同时间窗长度比例及震源深度选取等也会对结果产生影响,怎样让算法包含的所有因子最为有效的“组合”在一起,可能需要结合进一步的数据挖掘工作.因此,研究区不同区块的地震活动特征和遍历性特征分析、包含所有参数的PI算法优化将会是本工作下一步研究内容.
致谢本工作依托于山东省地震局青年基金项目(项目编号JJ1609Y),得到了山东省地震局预报研究中心陈时军、李冬梅、张正帅等人协助.PI算法的原始程序由John B. Rundle教授和陈建志教授提供,部分内容与天津市地震局宋程工程师进行了讨论,两位匿名审稿人提出了建设性意见和建议,在此一并表示感谢.
Bowman D D, Ouillon G, Sammis C G, et al.
1998. An observational test of the critical earthquake concept. Journal of Geophysical Research:Solid Earth, 103(B10): 24359-24372.
DOI:10.1029/98JB00792 |
|
Cao A M, Gao S S.
2002. Temporal variation of seismic b-values beneath northeastern Japan island arc. Geophysical Research Letters, 29(9): 48-1.
DOI:10.1029/2001gl013775 |
|
Chen C C, Rundle J B, Holliday J R, et al.
2005. The 1999 Chi-Chi, Taiwan, earthquake as a typical example of seismic activation and quiescence. Geophysical Research Letters, 32(22): L22315.
|
|
Field E H.
2007. Overview of the working group for the development of Regional Earthquake Likelihood Models (RELM). Seismological Research Letters, 78(1): 7-16.
DOI:10.1785/gssrl.78.1.7 |
|
Holliday J R, Nanjo K Z, Tiampo K F, et al.
2005. Earthquake forecasting and its verification. Nonlinear Processes in Geophysics, 12(6): 965-977.
DOI:10.5194/npg-12-965-2005 |
|
Holliday J R, Rundle J B, Tiampo K F, et al.
2006. Using earthquake intensities to forecast earthquake occurrence times. Nonlinear Processes in Geophysics, 13(5): 585-593.
DOI:10.5194/npg-13-585-2006 |
|
Holliday J R, Chen C C, Tiampo K F, et al.
2007. A RELM earthquake forecast based on Pattern Informatics. Seismological Research Letters, 78(1): 87-93.
DOI:10.1785/gssrl.78.1.87 |
|
Jiang C S, Wu Z L.
2008. Retrospective forecasting test of a statistical physics model for earthquakes in Sichuan-Yunnan region. Science in China Series D:Earth Sciences, 51(10): 1401-1410.
DOI:10.1007/s11430-008-0112-6 |
|
Jiang C S, Wu Z L.
2010. PI forecast for the Sichuan-Yunnan region:Retrospective test after the May 12, 2008, Wenchuan earthquake. Pure and Applied Geophysics, 167(6-7): 751-761.
DOI:10.1007/s00024-010-0070-8 |
|
Jiang C S, Wu Z L.
2011. PI forecast with or without de-clustering:an experiment for the Sichuan-Yunnan region. Natural Hazards and Earth System Science, 11(3): 697-706.
DOI:10.5194/nhess-11-697-2011 |
|
Jiang H, Wu Z L, Ma T F, et al.
2013. Retrospective test of the PI forecast case study of the April 20, 2013, Lushan, Sichuan, China, MS7.0 earthquake. Physics , 42(5): 334-340.
|
|
Jolliffe I T, Stephenson D B. 2003.
Forecast Verification:A Practitioner's Guide in Atmospheric Science. England: John Wiley and Sons.
|
|
Kagan Y Y, Jackson D D.
1995. New seismic gap hypothesis:Five years after. Journal of Geophysical Research:Solid Earth, 100(B3): 3943-3959.
DOI:10.1029/94jb03014 |
|
Kawamura M, Chen C C, Wu Y M.
2014. Seismicity change revealed by ETAS, PI, and Z-value methods:A case study of the 2013 Nantou, Taiwan earthquake. Tectonophysics, 634: 139-155.
DOI:10.1016/j.tecto.2014.07.028 |
|
Li Z H, Huang Y.
2010. Retrospective forecast test of PI algorithm in Xindu Kush versus Pamir versus Middle and Southern region of Xinjiang. Inland Earthquake , 24(3): 208-214.
|
|
Liu X L, Liu T T, Zheng J C, et al.
2007. Study on the characteristics of the small seismic swarms occurring in Shandong province and its nearby ocean floor. Journal of Disaster Prevention and Mitigation Engineering , 27(4): 457-464.
|
|
Lü Z Q, Zheng J C, Liu X Q, et al.
2013. Characteristics of the gravity change and the recent seismic activity of the middle part of Tancheng-Lujiang fault zone. Progress in Geophysics , 28(6): 2838-2844.
DOI:10.6038/pg20130604 |
|
Molchan G M.
1997. Earthquake prediction as a decision-making problem. Pure and Applied Geophysics, 149(1): 233-247.
DOI:10.1007/bf00945169 |
|
Nanjo K Z, Rundle J B, Holliday J R, et al.
2006a. Pattern Informatics and its application for optimal forecasting of large earthquakes in Japan. Pure and Applied Geophysics, 163(11-12): 2417-2432.
DOI:10.1007/s00024-006-0130-2 |
|
Nanjo K Z, Holliday J R, Chen C C, et al.
2006b. Application of a modified pattern informatics method to forecasting the locations of future large earthquakes in the central Japan. Tectonophysics, 424(3-4): 351-366.
DOI:10.1016/j.tecto.2006.03.043 |
|
Qu J H, Jiang H K, Li J, et al.
2015. Preliminary study for seismogenic structure of the Rushan earthquake sequence in 2013-2014. Chinese Journal of Geophysics , 58(6): 1954-1962.
DOI:10.6038/cjg20150611 |
|
Rhoades D A, Schorlemmer D, Gerstenberger M C, et al.
2011. Efficient testing of earthquake forecasting models. Acta Geophysica, 59(4): 728-747.
DOI:10.2478/s11600-011-0013-5 |
|
Rundle J B, Tiampo K F, Klein W, et al.
2002. Self-organization in leaky threshold systems:the influence of near-mean field dynamics and its implications for earthquakes, neurobiology, and forecasting. Proceedings of the National Academy of Sciences of the United States of America, 99(Suppl.1): 2514-2521.
|
|
Rundle J B, Turcotte D L, Shcherbakov R, et al.
2003. Statistical physics approach to understanding the multiscale dynamics of earthquake fault systems. Reviews of Geophysics, 41(4): 1019.
DOI:10.1029/2003RG000135 |
|
Schorlemmer D, Gerstenberger M C, Wiemer S, et al.
2007. Earthquake likelihood model testing. Seismological Research Letters, 78(1): 17-29.
DOI:10.1785/gssrl.78.1.17 |
|
Shi Y J, Wu Z L, Bai L, et al.
2003. Earthquakes at the edge of the warning area:A statistical consideration of a controversial problem in earthquake prediction study. Earthquake Research in China , 19(4): 351-357.
|
|
Swets J A.
1973. The relative operating characteristic in Psychology:A technique for isolating effects of response bias finds wide use in the study of perception and cognition. Science, 182(4116): 990-1000.
DOI:10.1126/science.182.4116.990 |
|
Tiampo K F, Rundle J B, McGinnis S A, et al. 2002a. Pattern dynamics and forecast methods in seismically active regions.//Matsu'ura M, Mora P, Donnellan A, et al., eds. Earthquake Processes:Physical Modelling, Numerical Simulation and Data Analysis Part Ⅱ. Basel:Birkhäuser, 2429-2467.
http://link.springer.com/article/10.1007/s00024-002-8742-7 |
|
Tiampo K F, Rundle J B, McGinnis S, et al.
2002b. Eigenpatterns in southern California seismicity. Journal of Geophysical Research:Solid Earth, 107(B12): ESE 8-1-ESE 8-17.
DOI:10.1029/2001JB000562 |
|
Toya Y, Tiampo K F, Rundle J B, et al.
2010. Pattern informatics approach to earthquake forecasting in 3D. Concurrency and Computation:Practice and Experience, 22(12): 1569-1592.
|
|
Wang P, Zheng J C, Tan Y P.
2015. The study of seismic-source parameters and focal mechanism for the Rushan swarm in Shandong province. Recent Development in Word Seismology(9): 15.
|
|
Wiemer S, Wyss M.
2000. Minimum magnitude of completeness in earthquake catalogs:Examples from Alaska, the western United States, and Japan. Bulletin of the Seismological Society of America, 90(4): 859-869.
DOI:10.1785/0119990114 |
|
Woessner J, Wiemer S.
2005. Assessing the quality of earthquake catalogues:Estimating the magnitude of completeness and its uncertainty. Bulletin of the Seismological Society of America, 95(2): 684-698.
DOI:10.1785/0120040007 |
|
Wu A X, Zhang Y X, Zhou Y Z, et al.
2011. On the spatial-temporal characteristics of ionospheric parameters before Wenchuan earthquake with the MPI method. Chinese Journal of Geophysics , 54(10): 2445-2457.
DOI:10.3969/j.issn.0001-5733.2011.10.002 |
|
Wu Y H, Chen C C, Rundle J B.
2008. Precursory seismic activation of the Pingtung (Taiwan) offshore doublet earthquakes on 26 December 2006:a pattern informatics analysis. Terr. Atmos. Ocean. Sci., 19(6): 743-749.
DOI:10.3319/TAO.2008.19.6.743(PT) |
|
Wu Y H, Chen C C, Li H C.
2016. Conditional probabilities for large events estimated by small earthquake rate. Pure and Applied Geophysics, 173(1): 183-196.
DOI:10.1007/s00024-014-1019-0 |
|
Wyss M, Habermann R E.
1988. Precursory seismic quiescence. Pure and Applied Geophysics, 126(2-4): 319-332.
DOI:10.1007/BF00879001 |
|
Xia C Y, Zhang Y X, Zhang X T, et al.
2015a. Predictability test for pattern information method by two MS7.3 Yutian, Xinjiang, earthquakes. Acta Seismologica Sinica , 37(2): 312-322.
|
|
Xia C Y, Zhang Y X, Nilupar T, et al.
2015b. A review on modified pattern informatics method to extract ionospheric disturbance anomaly related to earthquake. Acta Seismologica Sinica , 37(1): 192-201.
|
|
Yan L J, Zhu G, Lin S Z, et al.
2014. Neotectonic activity and formation mechanism of the Yishu Fault Zone. Science China:Earth Sciences, 57(4): 614-629.
DOI:10.1007/s11430-013-4725-z |
|
Zhang S F, Wu Z L, Jiang C S.
2016. The central China North-South Seismic Belt:seismicity, ergodicity, and five-year PI forecast in testing. Pure and Applied Geophysics, 173(1): 245-254.
DOI:10.1007/s00024-015-1123-9 |
|
Zhang S F, Wu Z L, Jiang C S.
2017. Reducing false alarms of annual forecast in the central China North-South Seismic Belt by reverse tracing of precursors (RTP) using the Pattern Informatics (PI) 'hotspots'. Pure and Applied Geophysics, 174(6): 2401-2410.
DOI:10.1007/s00024-016-1318-8 |
|
Zhang X T, Zhang Y X, Xia C Y, et al.
2014. Anomalous seismic activities in the Sichuan-Yunnan region and its adjacent areas before the Lushan MS7.0 earthquake by the pattern informatics method. Acta Seismologica Sinica , 36(5): 780-789.
|
|
Zhang Y X, Zhang X T, Wu Y J, et al.
2013. Retrospective study on the predictability of Pattern Informatics to the wenchuan M8.0 and Yutian M7.3 earthquakes. Pure and Applied Geophysics, 170(1-2): 197-208.
DOI:10.1007/s00024-011-0444-6 |
|
Zhao Y Z, Wu Z L, Jiang C S, et al.
2010. Reverse tracing of precursors applied to the annual earthquake forecast:Retrospective test of the annual consultation in the Sichuan-Yunnan region of southwest China. Pure and Applied Geophysics, 167(6-7): 783-800.
DOI:10.1007/s00024-010-0077-1 |
|
Zhu H B, Xing C Q, Li H, et al.
2010. Segmentation of main seismic belts and strong earthquakes in North China tectonic region. Acta Seismologica Sinica , 32(6): 705-717.
|
|
蒋长胜, 吴忠良.
2008. 对地震预测的一个统计物理算法在川滇地区的回溯性预测检验. 中国科学(D辑:地球科学), 38(7): 852–861.
|
|
蒋卉, 吴忠良, 马腾飞, 等.
2013. 对图像信息学(PI)算法的一个回溯性预测检验:四川芦山7.0级地震. 物理, 42(5): 334–340.
|
|
李志海, 黄瑜.
2010. 兴都库什-帕米尔-新疆中南部地区PI算法的回溯性研究. 内陆地震, 24(3): 208–214.
|
|
刘西林, 刘涛涛, 郑建常, 等.
2007. 山东及其近海小震群活动特征研究. 防灾减灾工程学报, 27(4): 457–464.
|
|
吕子强, 郑建常, 刘希强, 等.
2013. 郯庐断裂带中段重力场变化及地震活动特征. 地球物理学进展, 28(6): 2838–2844.
DOI:10.6038/pg20130604 |
|
曲均浩, 蒋海昆, 李金, 等.
2015. 2013-2014年山东乳山地震序列发震构造初探. 地球物理学报, 58(6): 1954–1962.
DOI:10.6038/cjg20150611 |
|
史勇军, 吴忠良, 白玲, 等.
2003. 位于预测区边缘附近的地震统计检验问题. 中国地震, 19(4): 351–357.
|
|
王鹏, 郑建常, 谭毅培.
2015. 山东乳山震群的震源参数及发震机理研究. 国际地震动态(9): 15.
|
|
武安绪, 张永仙, 周元泽, 等.
2011. 基于改进型图像信息方法的汶川地震前电离层参量时空特征研究. 地球物理学报, 54(10): 2445–2457.
DOI:10.3969/j.issn.0001-5733.2011.10.002 |
|
夏彩韵, 张永仙, 张小涛, 等.
2015a. 利用两次新疆于田MS7.3地震对图像信息方法可预测性的检验. 地震学报, 37(2): 312–322.
|
|
夏彩韵, 张永仙, 尼鲁帕尔·买买吐孙, 等.
2015b. 改进型图像信息方法提取地震电离层扰动异常研究进展. 地震学报, 37(1): 192–201.
|
|
严乐佳, 朱光, 林少泽, 等.
2014. 沂沭断裂带新构造活动规律与机制. 中国科学:地球科学, 44(7): 1452–1467.
|
|
张小涛, 张永仙, 夏彩韵, 等.
2014. 利用图像信息方法研究芦山MS7.0地震前川滇及附近地区的图像异常. 地震学报, 36(5): 780–789.
|
|
朱红彬, 邢成起, 李红, 等.
2010. 华北构造区主要地震带分段与强震活动. 地震学报, 32(6): 705–717.
|
|
 2017, Vol. 60

