 2017, Vol. 60


2. 武汉大学地球空间环境与大地测量教育部重点实验室, 武汉 430079;
3. 武汉大学地球空间信息技术协同创新中心, 武汉 430079
2. Key Laboratory of Geospace Environment and Geodesy, Ministry of Education, Wuhan University, Wuhan 430079, China;
3. Collaborative Innovation Center of Geospatial Technology, Wuhan 430079, China
2017年8月8日21时19分在四川省阿坝州九寨沟县发生了MW6.5地震,造成25人遇难,525人受伤,受灾区域涉及阿坝州九寨沟、松潘、若尔盖、红原等4个县53个乡镇309个村社区,绵阳市平武县有11个乡镇不同程度受灾.据中国地震台网测定,此次地震的震中位置为(103.82°E, 33.2°N),震中距离九寨沟县城35 km,距阿坝州210 km,距成都市290 km,距甘肃陇南市100 km.截至8月13日8时00分,共记录到余震总数为3286个,其中,4.0~4.9级地震3个,3.0~3.9级地震26个,最大余震为8月9日10时17分发生在四川阿坝州九寨沟县的4.8级地震.据中国地震局现场工作队对震区地震烈度调查结果,此次强震在震区造成的最大地震烈度为Ⅸ度,等震线长轴总体呈NNW走向,Ⅸ度区域涵盖了四川省阿坝藏族羌族自治州九寨沟县漳扎镇,面积139 km2.
地震波数据初步反演结果表明,该强震是一次北北西走向且具左旋兼正断层分量的地震破裂事件,地震断层走向150°,倾角78°,滑动角-13°,标量地震矩为7.62×10¹⁸ Nm(gCMT).该地震发生在巴颜喀拉块体东北缘、近南北向的岷江断裂和北西向的东昆仑断裂东部交汇地带(图 1a),岷江断裂、塔藏断裂和虎牙断裂附近(图 1b).岷江断裂是逆走滑型断裂,长期水平滑动速率为1 mm·a-1,垂直滑动速率为0.37~0.53 mm·a-1(赵小麟等, 1994; 任俊杰, 2013);塔藏断裂(北西向东昆仑断裂南东段)以左旋走滑为主,最大水平滑动速率约3 mm·a-1(何玉林, 2013);虎牙断裂是逆走滑型断裂,平均左旋滑动速率为1.4 mm·a-1,垂直滑动速率为0.3 mm·a-1 (周荣军等, 2006).九寨沟地震的发震构造初步推测为塔藏断裂南部分支和虎牙断裂北段(徐锡伟等, 2017),初期余震显示其沿着北西方向展布(图 1b).

|
图 1 2017年MW6.5九寨沟地震发震构造背景 (a)九寨沟地震震中位置及其邻近区域历史强震分布; (b)九寨沟地震区域地震构造和余震分布.图(a)中青色和红色震源球为1976年1月1日至2017年8月8日发生的M≥6强震(http://www.globalcmt.org);蓝色五角星为自1536年至1975年发生的6级以上强震(表 2).黑色实线为主要活动断层;黑色虚线为地缝合线(Taylor and Yin, 2009; Styron et al., 2010).红色箭头为九寨沟地震GPS同震位移场(http://www.neis.cn/chinsoftdmds/zxzxdt/1671.jhtml).图(b)中绿色实心点表示九寨沟地震后截至2017年8月21日9时27分(~12.7天)的余震,期间于8月9日10时17分发生了最大震级为ML4.8的余震.这些1867个余震精定位最大水平精度和垂直精度分别为±0.28 km、±0.68 km, 余震震级ML范围为-1.4~4.8(房立华, 2017, 个人通讯). Fig. 1 Seismogenic tectonic background of the 2017 MW6.5 Jiuzhaigou earthquake (China) (a) The epicenter of the 2017 MW6.5 Jiuzhaigou earthquake and M≥6 historic and instrumental strong earthquakes. The cyan and red beachballs are the focal mechanisms of the strong earthquakes with their magnitudes not smaller than six from 1 January 1976 to 8 August 2017 which are retrieved from the global CMT (gCMT) catalog (http://www.globalcmt.org/). The blue stars are M≥6 historic earthquakes over the period of 1536—1975 (Table 2). The solid lines are the major active faults in this region and the dashed line is one geological suture from the 'HimaTibetMap' database (Taylor and Yin, 2009; Styron et al., 2010). The arrows with red heads and black tails denote the preliminary coseismic deformation field of the Jiuzhaigou earthquake (http://www.neis.cn/chinsoftdmds/zxzxdt/1671.jhtml). (b) The local seismogenic tectonic background of the Jiuzhaigou earthquake and relocated aftershocks. The small green solid dots denote the aftershocks of the 2017 MW6.5 Jiuzhaigou earthquake up to 09:27 AM 21 August, 2017 (approximately within 12.7 days) (local time). During this time period a largest aftershock of the magnitude of ML4.8 occurred at 10:17AM, 9 August. The 1867 relocated aftershocks with magnitudes ranging from -1.4 to 4.8 over that time period have the maximum horizontal and vertical relocation precisions of 0.28 km and 0.68 km, respectively (Fang, 2017, personal communication). The solid black lines delineate some local major faults such as the Longriba fault, Minjiang fault, Huya fault, Xueshanliangzi fault and Bailongjiang fault (which is shown at the upper right corner of the figure but is not labeled for clarity).These faults are from the webpage 'http://www.eq-igl.ac.cn/upload/images/2017/8/991724632.jpg'. |
|
|
表 2 用于计算库仑应力变化的源断层模型 Table 2 Source fault models used for computing Coulomb stress changes |
合成孔径雷达干涉测量(InSAR)初步形变结果(单新建等, 2017)表明,此次地震造成的同震形变场发生在岷江断裂、塔藏断裂和虎牙断裂交汇地带,视线向同震形变场大小为-0.22~0.07 m,同震形变场显示地震断层运动性质总体以左旋走滑为主;基于该InSAR同震形变场的断层滑动分布初步反演结果显示,断层破裂模型长度为40 km、宽度为30 km、最大滑动量为0.86 m、矩震级为MW6.5,其滑动量集中分布于断层面上沿倾滑方向5~15 km的范围.
近年来巴颜喀拉块体周缘发生了多次强震,包括在其北部边界发生的2001年MW7.8可可西里地震,西部边界发生的2008年MW7.1和2014 MW6.9两次于田地震,南部边界发生的1997年MW7.6玛尼地震、2010年MW6.8玉树地震和2014年MW6.1康定地震,以及东部边界中南段发生的2008年MW7.9汶川地震和2013年MW6.6芦山地震(Wang et al., 2017).此次MW6.5九寨沟地震是巴颜喀拉块体北部边界最东段附近发生的又一次地震破裂事件,表明巴颜喀拉块体周缘主要活动断层的应力状态仍处于持续调整之中.
地震发生前后断层面上的应力变化通常采用库仑应力加以定量刻画,其为断层面上的剪切力和摩擦力的合力(King et al., 1994).近年来库仑应力被广泛应用于地震应力触发和主要活动断层上的应力扰动研究以及基于速率-状态摩擦模型和库仑应力模型的地震复发概率评估.例如,2008年MW7.9汶川大地震发生后,已有多位学者计算了该强震在周边主要活动断裂上的库仑应力变化(Parsons et al., 2008; 单斌等, 2009; Wan and Shen, 2010; 王凯英和马胜利, 2011),研究了该强震与其余震的库仑应力触发关系(解朝娣等, 2010; Xu et al., 2010),并评估了其邻近区域及周边主要活动断层的地震复发概率(Toda et al., 2008; 邵志刚等, 2010).2015年MW7.9尼泊尔地震发生后,一些学者同样采用库仑应力模型研究了该强震对中国大陆地区的静态应力触发(盛书中等, 2015),对中国大陆主要活动断层面上的静态应力扰动(万永革等, 2015)和对中国西部地区的同震效应(张贝等, 2015)以及对青藏高原活动断裂的同震和震后应力影响(熊维等, 2015).针对近年来青藏高原巴颜喀拉块体周缘强震频发现象,前人研究了鲜水河断裂带和鲜水河及小江断裂系统历史强震序列的同震、震后和震间库仑应力演化历史(Shan et al., 2013; Shao et al., 2016)以及巴颜喀拉块体周缘长地震序列内的库仑应力传输过程(Wang et al., 2017).此外,国内外学者也利用库仑应力进行了俯冲带地震应力触发研究.例如,Toda和Stein(2013)研究了2011年MW9.0日本Tohoku-Oki大地震在东京附近的关东地震带所激发的库仑应力变化,并评估出该区域2013—2018年间发生七级以上地震的概率约为17%.Herman等(2017)研究了2015年MW8.3智利伊亚佩尔俯冲带地震及其强余震在俯冲带上激发的同震库仑应力变化,发现55%的余震受到前面地震的库仑应力加载作用.林鑫等(2017)发现2010年发生在智利马乌莱地区的MW8.8地震导致2015年发生在智利中部伊拉佩尔地区发生的MW8.3地震震源区附近的库仑应力变化为(0.01~0.15)×105Pa,表明前者促进了后者的发生.程惠红等(2017)计算了2016年新西兰凯库拉MW7.8地震同震位移和同震库仑应力变化,发现新西兰北岛和南岛震中以南区域的库仑应力均增加,可能触发部分余震.
本文采用库仑应力模型研究2017年8月8日发生的MW6.5九寨沟地震库仑应力变化,包括:(1)该地震激发的同震库仑应力变化空间分布;(2)该地震与周边其他强震的应力触发关系,尤其是2008年MW7.9汶川地震和2013年MW6.6芦山地震对该地震的应力触发作用;(3)周边断层上的应力扰动变化.研究结果表明,2008年MW7.9汶川地震对2017年MW6.5九寨沟地震有一定的促进作用,2013年MW6.6芦山地震的应力触发作用可以忽略不计,但1654年M8.0甘肃天水南历史强震对九寨沟地震的发生有显著触发作用.
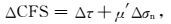
2 库仑应力模型和断层模型 2.1 库仑应力模型地震断层面上的库仑应力变化为(King et al., 1994; Steacy et al., 2005):
|
(1) |
其中,Δτ和Δσn分别为断层面上地震前后的剪应力变化和正应力变化,μ′为断层面上的有效摩擦系数.根据弹性力学采用张量运算记法,剪应力变化和正应力变化分别为:Δτ=s·σ·n且Δσn=n·σ·n,其中,s为断层滑动方向单位向量,n为断层面单位法向量,σ为地震激发的二阶应力张量.库仑应力模型具体可以表述为(Wang et al., 2014):

|
(2) |
其中,{σij|i, j∈{1, 2, 3}}为地震激发的二阶应力张量各分量,应力张量各分量位于局部笛卡尔直角坐标系,其坐标轴x、y和z分别指北、指东和垂直向上;φ、δ和λ分别为接收断层的走向、倾角和滑动角;本文有效摩擦系数参数μ′取0.4(King et al., 1994; Avouac et al., 2014; Hamling et al., 2017).有效摩擦系数经验参数对库仑应力空间分布影响不大,但对库仑应力的值有一定的影响(沈正康等,2003),它主要影响断层面上的剪切力和正应力的相对权重.本文数值试验表明该参数对库仑应力的值的影响约为0.01×10⁵Pa量级.
2.2 断层模型基于位错理论并结合源断层模型可以计算地震激发的应力张量,进而可以利用库仑应力模型计算库仑应力.因此,计算库仑应力需已知源断层模型.源断层模型采用两种方法实现:其一是采用Wells和Coppersmith(1994)的经验公式计算断层的长度、宽度和滑动量,并收集已有的相关研究断层参数(表 2);其二是对个别地震直接采用已有的精细断层滑动分布模型,如2008年MW7.9汶川地震(Wang et al., 2011)、2013年MW6.6芦山地震(Jiang et al., 2014)和2014年MW6.1康定地震(Jiang et al., 2015).
计算库仑应力除了需已知源断层,也需已知用于投影上述应力张量的接收断层.接收断层分为两类:一是采用九寨沟地震震源机制节面解(表 1);二是采用已有相关文献中的周边活动断层参数(Toda et al., 2008; 单斌等, 2009; Wan and Shen, 2010).收集完成源断层模型和接收断层模型后,利用基于Okada位错理论(Okada, 1992)的自编程序计算地震激发的应力张量,将其与其他相关参数(接收断层和有效摩擦系数)代入上述库仑应力模型即可求解指定接收断层面上的库仑应力变化,并以此定量结果分析九寨沟地震的主余震触发、主震间的触发以及周边主要活动断层上的应力扰动.
|
|
表 1 不同机构和个人发布的2017年MW6.5九寨沟地震震源机制 Table 1 Multiple seismic moment centroids and focal mechanisms of the 2017 MW6.5 Jiuzhaigou earthquake that were disseminated by different institutes or scientific workers |
图 2为2017年MW6.5九寨沟地震在不同深度所激发的同震库仑应力变化.库仑应力图像呈现走滑型地震造成的库仑应力象限交替分布.在发震断层两端库仑应力出现升高,而在震中垂直断层走向一定距离范围库仑应力呈现降低.此外,由于地震震级不是很高,主震所激发的同震库仑应力主要集中在局部区域,离开发震断层一定距离库仑应力很快衰减,九寨沟地震造成的应力场变化只在局部范围内比较显著.这同基于InSAR的形变场观测结果只在局部区域比较显著是一致的(单新建等,2017).此外,震后12天多时间内的1867个精定位余震(房立华,2017,个人通讯)并不都发生在库仑应力升高的区域,例如在深度平面5 km和10 km的余震大多数发生在库仑应力减小的区域(应力影区).这似乎与通常认为的大部分余震应落在正的库仑应力区域(King et al., 1994)不一致.

|
图 2 2017年MW6.5九寨沟地震在不同深度处激发的同震库仑应力变化和余震活动性 库仑应力变化的计算深度分别为:(a) 5 km、(b) 10 km、(c) 15 km和(d) 20 km.接收断层为155°/80°/-8°,九寨沟地震断层分布来自Zhao等(2017)1).图中红色和黄色区域表示库仑应力升高,蓝色区域表示库仑应力下降.黑色实线为主要活动断层(同图 1).绿色实线为九寨沟地震断层面所在平面与地表的交线. (e)九寨沟地震后截至2017年8月21日9时27分(~12.7天)的余震(同图 1b)震级-时间统计图. Fig. 2 Coseismic Coulomb stress changes induced by the 2017 MW6.5 Jiuzhaigou (China) earthquake at different depth levels and seismicity of aftershocks (a) 5 km, (b) 10 km, (c) 15 km and (d) 20 km. The strike angle, dip angle and rake angle of the receiver fault are 155°, 80° and -8°, respectively. The receiver fault is averaged using the finite-fault slip model of the Jiuzhaigou earthquake from Zhao et al. (2017)1). The red and yellow regions delineate positive Coulomb stress changes, while the blue regions represent negative Coulomb stress changes. The red beachball and black lines have the same meanings as Fig. 1. The bold green line is the segment of the intersection line between the plane including the fault plane of the mainshock and the Earth′s surface, which is the same as the upper edges of the profiles shown in Figs. 3 and 7. In subplot (e) is shown the relation between the magnitude of the relocated aftershocks and their occurrence time up to the time of 09:27AM, 21 August (local time) (~12.7 days) (same as Fig. 1b). |

|
图 7 同图 3,但其为周边1976—2017年M≥6强震和其他历史强震(图 1)所激发的库仑应力变化 Fig. 7 Same as Fig. 3 but now the compounded Coulomb stress changes are imparted by 12 gCMT M≥6 mainshocks during 1976—2017 before the mainshock and other 19 historic earthquakes that took place in the surrounding regions (Fig. 1) |

|
图 3 沿着主震断层面的剖面上的同震库仑应力变化 剖面上边界AA′为图 2中的绿色实线.绿色实线框为主震断层面.绿色五角星为断层面的gCMT矩心位置.黑色空心圆为九寨沟地震的余震(同图 1b). Fig. 3 Coseismic Coulomb stress changes on the profile with its upper edge being the intersection line of AA′ in Fig. 2 and including the fault plane of the MW6.5 Jiuzhaigou mainshock The fault plane is from Zhao et al. (2017)1), which is delineated as the bold green rectangle. The green star represents the projection of the hypocenter of the Jiuzhaigou earthquake (gCMT). The open black circles represent the projected aftershocks onto the profile. These relocated aftershocks are the same as those shown in Fig. 1b. |
1) Zhao D Z, Qu C Y, Shan X J, et al. 2017. Coseismic deformation and fault model of the 2017 MS7.0 Jiuzhaigou earthquake in the northeast Bayanhar block derived from InSAR and GPS data. Tectonophysics (under review).
图 3给出了2017年MW6.5九寨沟地震在断层面剖面上的库仑应力分布及余震在该剖面上的投影.主震断层面上正的库仑应力量值大的区域圈定了该时段内的所有余震.这表明九寨沟地震断层的同震错动在断层面周围区域激发了明显的正库仑应力变化,促进了这些区域的余震发生.这些余震的比例为75%,而其他余震则仍然发生在库仑应力减小的区域.断层面上及邻近区域内的余震发生可能与断层模型的滑动分布非均匀性有关(Steacy et al., 2004),也可能与余震的级联触发有关(Felzer et al., 2002; Marsan and Lengliné, 2008; Marsan and Helmstetter, 2017),还有可能与断层上的预应力状态、应力分布非均匀性和断层面摩擦性质有关(Helmstetter and Shaw, 2006; Barnhart et al., 2016).这些都有可能造成断层面内的局部应力集中,促进余震的发生.而库仑应力减小的区域的余震发生,也可能同余震的破裂面与主震断层面不一致有关.换言之,这些余震的破裂面可能受控于背景构造应力场,并在九寨沟地震的同震应力扰动下而产生.
图 4和图 5分别为不同构造背景应力场下不同深度平面最优破裂面上的库仑应力变化.对比图 2和图 4与图 5可以发现,图 4和图 5中较浅深度平面内有更多的余震落在库仑应力升高的区域.这是因为相比较于图 2中采用与九寨沟地震断层面相同的接收断层面,图 4和图 5中采用了顾及背景构造应力场和同震应力场的破裂面,此种接收断层面有更多的方向性,从而可以确定当库仑应力取最大值时的最优破裂面.采用最优破裂面上的库仑应力有利于提升库仑应力图像与余震的空间相关性(Mallman and Zoback, 2007).因此,余震的发生也可能是在背景构造应力场约束作用下,处于应力临界状态的余震破裂面经由九寨沟地震同震应力扰动而发生失稳所致.

|
图 4 2017年MW6.5九寨沟地震在不同深度处最优破裂面上的同震库仑应力变化 背景构造应力场如图所示.最大主应力σ1、中间主应力σ2和最小主应力σ3分别为-100×105Pa、-10×105Pa和0 Pa(Toda et al., 2005);最大、最小主应力方向分别为NE60°和NE150°(陈群策等, 2012;崔效锋等, 2017).绿色实线同图 2.黑色实线为主要活动断层(同图 2).黑色实心点为各深度h±2.5 km范围内的精定位余震(同图 1b). Fig. 4 Coseismic Coulomb stress changes on the 3D optimally oriented failure planes aroused by the 2017 MW6.5 Jiuzhaigou earthquake at different depth levels The regional tectonic stress is presented at the upper right corner for each snapshot. The magnitudes of the maximum, intermediate and minimum principal stresses are -100×105Pa, -10×105Pa and 0 Pa(positive in extension), respectively (Toda et al., 2005). The azimuths of the horizontal maximum and minimum principal stresses are NE60° and NE150°, respectively (Chen et al., 2012; Cui et al., 2017). The red beachball delineates the MW6.5 Jiuzhaigou earthquake. The bold green line is the same as Fig. 2. The black lines are some major active faults that are the same as Fig. 2. The black solid dots represent the relocated aftershocks (Fang, 2017, personalcommunication) within the range of h±2.5 km for each snapshot. These aftershocks are the same as Fig. 1b. |

|
图 5 同图 4,但背景构造应力场最大、最小主应力方向分别为NE30°和NE120° Fig. 5 Same as Fig. 4 but the azimuths of the maximum and minimum principal stresses for the regional tectonic stress field are NE30° and NE120°, respectively. |
图 6是周边地震在2017年MW6.5九寨沟地震接收断层面上激发的同震库仑应力变化.这些周边地震既包括自1976年以来九寨沟地震周边区域6级及以上强震12个,其中近年来发生的典型强震包括2008年MW7.9汶川地震、2013年MW6.6芦山地震和2014年MW6.1康定地震,另外也包括1654年M8.0甘肃天水南地震、1879年M8.0甘肃武都地震两次历史强震和1933年M7.5四川叠溪地震, 以及其他诸如在鲜水河断裂、安宁河断裂、马边—盐津断裂附近发生的系列强震.以上所有地震在2017年MW6.5九寨沟地震处造成净库仑应力为正,并且沿着源断层面的剖面上的库仑应力图也显示2017年MW6.5九寨沟地震处的库仑应力变化也为正(图 7).

|
图 6 周边区域强震对2017年MW6.5地震激发的同震库仑应力变化 库仑应力计算深度为10 km.周边强震包括1976—2017年gCMT目录中的12次M≥6强震(青色和红色震源球)和其他19次M≥6历史强震(黑色五角星).接收断层参数同图 2. 2017年MW6.5九寨沟地震落在显著的库仑应力增加的区域. Fig. 6 Coseismic Coulomb stress changes at a depth of 10 km induced by the surrounding M≥6 earthquakes including 12 earthquakes during 1976—2017 (cyan and red beachballs) and other 19 historic earthquakes (black stars). The receiver fault is the same as Fig. 2.The 2017 MW6.5 Jiuzhaigou earthquake lies in the stress-triggering zone with significant positive Coulomb stress changes. |
具体分析单个地震的同震库仑应力触发结果表明,并不是所有以上地震都对2017年MW6.5九寨沟地震有促进作用.1654年M8.0甘肃天水南地震、1879年M8.0甘肃武都地震、1933年M7.5四川叠溪地震和2008年MW7.9汶川地震在2017年MW6.5九寨沟地震处产生了较为显著的库仑应力变化(图 8),其分别为1.171×10⁵Pa、1.363×10⁵Pa、0.080×10⁵Pa和0.092×10⁵Pa,而其他诸如在鲜水河断裂、安宁河断裂、马边—盐津断裂附近1976年前发生的系列强震则对2017年MW6.5九寨沟地震的应力加卸载作用非常微弱(均不超过0.1×10⁵Pa),这些地震造成的净库仑应力约为-0.03×10⁵Pa;1976—2017年gCMT地震目录中的其他地震造成的库仑应力变化均不超过0.01×10⁵Pa,这些地震造成的净库仑应力约为0.002 ×10⁵Pa.2013年MW6.6芦山地震对2017年MW6.5九寨沟地震几乎没有影响( < 0.001×10⁵Pa).因此,同震库仑应力结果表明:2017年MW6.5九寨沟地震可能主要受到来自1654年M8.0甘肃天水南地震和1879年M8.0甘肃武都地震的应力触发作用,而2008年MW7.9汶川地震对2017年MW6.5九寨沟地震有一定的促进作用.

|
图 8 四个典型强震在九寨沟地震处激发的同震库仑应力变化 库仑应力投影至gCMT震源机制节面(表 1).各子图中的红色震源球表示九寨沟地震的震源机制.黑线代表主要活动断层.黑色和绿色五角星代表周边强震震中位置,其中每个子图中的绿色五角星表示在九寨沟地震处激发同震库仑应力变化的各主震的震中位置. Fig. 8 Coseismic Coulomb stress changes induced by the four significant large mainshocks (1654 M8.0, 1879 M8.0, 1933 M7.5 and 2008 M7.9) The Coulomb stress changes are projected onto the gCMT nodal plane at the hypocenter of the Jiuzhaigou earthquake (Table 1). The red beachball in each snapshot is the focal mechanism of the Jiuzhaigou earthquake. The black lines denote some major active faults. The black and green stars are the epicenters of the significant large mainshocks. The green star in each snapshot is the mainshock that is regarded as source fault imparting Coulomb stress changes onto the focal plane of the Jiuzhaigou earthquake at corresponding centroid depth. |
图 9为2017年MW6.5九寨沟地震对周边断层上的同震库仑应力变化.该地震仅对邻近的岷江断裂北段、塔藏断裂和虎牙断裂南段有一定的应力加载作用,平均库仑应力变化分别为0.09×10⁵Pa、(0.14~2.03)×105Pa和0.25×10⁵Pa,而其他周边主要活动断层上的库仑应力变化则可以忽略不计.这表明地震震级大小是决定地震激发的库仑应力辐射范围的重要参量.

|
图 9 2017年MW6.5九寨沟地震在周边主要断层上造成的同震库仑应力变化 断层数据来自Toda等(2008)、单斌等(2009)、Wan和Shen(2010).各断层简称为:鲜水河断裂北段(XSHN);鲜水河断裂南段(XSHS);龙门山断裂西南段(LMSS);龙门山断裂东北段(LMSN);龙日坝断裂西南段(LRBS);龙日坝断裂东北段(LRBN);岷江断裂(MJ);东昆仑断裂东段(EKE);小金河断裂(XJH);安宁河断裂(ANH);大凉山断裂(DLS);马边—盐津断裂(MY);日月山断裂(RYS);青海南山—循化南山断裂(QNXN);西秦岭北缘断裂西段(WQNFW);西秦岭北缘断裂东段(WQNFE);秦岭南缘断裂西段(QSFW);秦岭南缘断裂东段(QSFE);塔藏断裂(TZ);虎牙断裂(HY).为测试库仑应力变化随计算深度的敏感性,计算了不同深度(5 km、15 km和20 km)主要活动断层上的库仑应力变化(为篇幅计,未给出相关图).经测试后得出的基本结论是:计算深度并不显著改变断层上的库仑应力变化空间分布,不过会略微改变库仑应力变化值的大小.采用同样的测试方法,图 10—12也有类似基本结论. Fig. 9 Coseismic Coulomb stress changes imparted by the 2017 MW6.5 Jiuzhaigou (China) earthquake on surrounding major active faults at a depth of 10 km (commonly a half of the seismogenic depth range) The fault geometries of these faults are primarily from Wan and Shen (2010) as well as Toda et al. (2008) and Shan et al. (2009). Each major fault is termed as follows: Xianshuihe (N) (XSHN); Xianshuihe (S) (XSHS); Longmen Shan (SW) (LMSS); Longmen Shan (NE) (LMSN); Longriba (SW) (LRBS); Longriba (NE) (LRBN); Minjiang (MJ); East Kunlun (East) (EKE); Xiaojinhe (XJH); Anninghe (ANH); Daliangshan (DLS); Mabian-Yanjin (MY); Riyue Shan (RYS); Qinghai Nanshan-Xunhua Nanshan (QNXN); West Qinling Northern Frontal (West) (WQNFW); West Qinling Northern Frontal (East) (WQNFE); Qinling Southern Frontal (West) (QSFW); Qinling Southern Frontal (East) (QSFE); Tazang (TZ); Huya fault (Huya). Note that for testing the sensitivity of Coulomb stress changes to depth level, Coulomb stress changes on these major faults at depths of 5 km, 15 km and 20 km have also been computed, which are not presented for the sake of concise presentation for the overall content. The basic conclusion for the testing is that: the spatial patterns of the Coulomb stress changes are not significantly altered, though the values of the Coulomb stress changes can vary slightly; Figs. 10 to 12 behave likewise. |

|
图 10 同图 9,但其为图中所有地震激发的同震库仑应力变化总和 总的同震库仑应力变化为所有强震(图中红色五角星)所激发的同震库仑应力变化之和. 2008年MW7.9汶川地震、2013年MW6.6芦山地震和2014年MW6.1康定地震的滑动分布模型分别采用文献中的结果(Wang et al., 2011; Jiang et al., 2014; Jiang et al., 2015). Fig. 10 Same as Fig. 9 but the source faults comprise all of the earthquakes shown as red stars and their fault models are presented in Table 2 Accordingly, the compounded Coulomb stress changes on the major faults are generated. Note that the slip models of the 2008 MW7.9 Wenchuan earthquake, 2013 MW6.6 Lushan earthquake and 2014 MW6.1 Kangding earthquake are not from the empirical relations of Wells and Coppersmith (1994) but are updated by using the results from Wang et al. (2011), Jiang et al. (2014) and Jiang et al. (2015), respectively. |
图 10为研究区域范围内的所有32次M≥6强震在周边断层上造成的同震库仑应力变化.部分断层段存在很高的应力加载水平.例如,鲜水河断裂南段道孚—康定段的北侧平均库仑应力增加9.0×10⁵Pa,而鲜水河断裂北段南侧库仑应力增加23.0×10⁵Pa; 小金河断裂北段平均库仑应力变化为1.7×10⁵Pa;安宁河断裂北段平均库仑应力变化为1.6×10⁵Pa;龙门山断裂带中段的北侧平均库仑应力变化为(6.1~7.4)×105Pa;西秦岭北缘断裂东段的平均库仑应力变化为4.4×10⁵Pa;岷江断裂北段的南侧和岷江断裂南段的平均库仑应力变化分别为5.6×10⁵Pa和9.8×10⁵Pa;龙日坝断裂北段最北侧的平均库仑应力变化为2.0×10⁵Pa;虎牙断裂上的库仑应力变化为(3.8~19.5)×105Pa;塔藏断裂库仑应力升高(7.3~18.1)×105Pa.另外,对比图 9和图 10可知,岷江断裂北段的库仑应力变化仍然为负.因此,尽管2017年MW6.5九寨沟地震对该段有一定的应力加载作用,但仍不足以抵消其他周边强震对该段的应力卸载作用.
4 讨论地震发生后会对周边地壳应力场产生扰动作用.利用库仑应力模型进行地震库仑应力变化分析有助于认识地震应力的传输过程,也为后续潜在地震危险性分析提供定量分析依据.2017年MW6.5九寨沟地震发生后,针对该地震的快速库仑应力变化分析有助于理解其与周边若干强震的应力触发关系,获得基于初始断层模型、震源机制和余震分布数据的库仑应力图像,为后续基于更多的大地测量和地震波观测数据约束结果的库仑应力分析提供对比参考,从而深化对库仑应力模型参数敏感性的认识.若基于库仑应力模型中的必要初始输入数据(源断层滑动分布、接收断层和有效摩擦系数)即可构制合理的、可应用于实际地震预测的库仑应力图像,则将来库仑应力完全可以被用于快速地震灾害准确预测分析.本文利用基于经验关系得到的均匀滑动断层模型、余震精定位数据和全球矩心地震矩张量统一目录数据,研究了2017年MW6.5九寨沟地震的主余震间触发、该地震与周边强震的应力触发以及强震对周边主要活动断层上的应力扰动,发现2017年MW6.5九寨沟地震受到1654年M8.0甘肃天水南地震的明显同震应力触发作用,2008年MW7.9汶川地震对2017年MW6.5九寨沟地震的发生有一定的促进作用,而2013年MW6.6芦山地震则对九寨沟地震的发生几乎没有影响.
4.1 汶川地震源断层模型对九寨沟地震同震应力触发作用的影响2008年MW7.9汶川地震激发的同震库仑应力变化采用了基于Wells和Coppersmith (1994)的经验关系得到的均匀滑动源断层模型.然而,前人的研究结果表明库仑应力变化与源断层的选择有关(Steacy et al., 2004; Toda et al., 2011; Wang et al., 2014).例如,Steacy等(2004)对1992年美国MW7.3 Landers地震的库仑应力震例研究表明:利用基于断层模型的经验公式和震源机制解或者地震矩张量解得到的源断层模型,计算得到的库仑应力变化空间分布和余震空间分布不一致.但顾及了正确断层破裂几何结构和简单滑动位错量的源断层模型,可以提高二者间的空间分布相关性.因此,2008年MW7.9汶川地震断层的几何结构也可能会对2017年MW6.5九寨沟地震的应力触发作用产生一定的影响.利用2008年MW7.9汶川地震的五个断层模型计算得到的库仑应力变化范围为(0.054~0.263)×105Pa(表 3).其中,基于WA11的汶川地震断层模型计算的库仑应力值最大(0.263×10⁵Pa),而采用WC94的经验关系得到的汶川地震均匀滑动断层模型在2017年MW6.5九寨沟地震处的库仑应力变化为0.092×10⁵Pa,其与基于HA10断层模型得到的库仑应力变化相当(0.080×10⁵Pa).库仑应力变化最大差异可达0.21×10⁵Pa(WA11与SH09).因此,不同的源断层滑动模型的确会导致库仑应力变化的差异性.
|
|
表 3 利用不同的2008 MW7.9汶川地震断层滑动分布模型计算的,在2017年MW6.5九寨沟地震处的剪应力变化、正应力变化和库仑应力变化 Table 3 Shear stress changes, normal stress changes and Coulomb stress changes aroused by the 2008 MW7.9 Wenchuan earthquake on the receiver fault plane of the 2017 MW6.5 Jiuzhaigou earthquake (China) |
以上五种源断层可分为两类:基于地震波观测的断层模型(SL08、JH08)和基于大地测量观测的断层模型(SH09、HA10、WA11).前者采用远震波形进行断层滑动分布反演,而后者则采用GPS、InSAR和水准数据进行单独或联合反演.由于先验的断层几何结构、观测数据的类型和空间分布的差异以及反演方法的不同,源断层模型差异也可能比较显著.在库仑应力触发领域,源断层差异性问题通常有三种处理手法:(1)直接选用多个源断层模型之一(Parsons et al., 2008; Toda and Stein, 2013);(2)利用余震相对触发率评价最佳源断层(Toda et al., 2011);(3)将所有源断层视作源断层样本空间的一次采样,从而将所有源断层激发的库仑应力进行叠加并求解其对应格网点处的库仑应力平均值和标准差(Hainzl et al., 2009; Cattania et al., 2014; Wang et al., 2014).由于WA11模型对应的余震触发率最高(Wang et al., 2014),因此采用该模型计算的2017年MW6.5九寨沟地震处的库仑应力可能相对较为合理.
4.2 接收断层参数对九寨沟地震同震应力触发作用的影响库仑应力除了受源断层模型差异的影响外,也会随接收断层参数变化而不同.2017年MW6.5九寨沟地震发生后,一些机构快速发布了该地震的震源机制解(表 1).采用表 1中的接收断层模型和表 3中的汶川地震源断层模型,分别计算了汶川地震在九寨沟地震处产生的库仑应力变化.库仑应力变化如表 4.5个汶川地震源断层模型和8个九寨沟地震接收断层的各种组合情形表明:汶川地震激发的库仑应力变化均为正((0.026~0.263)×105Pa).因此,即便顾及2008年MW7.9汶川地震源断层和2017年MW6.5九寨沟地震接收断层各自差异性,汶川地震对九寨沟地震的发生也有一定的促进作用.
|
|
表 4 利用2008年MW7.9汶川地震断层滑动分布模型计算的2017年MW6.5九寨沟地震不同接收断层上的同震库仑应力变化(单位:×105Pa) Table 4 Coseismic Coulomb stress changes imparted by the 2008 MW7.9 Wenchuan earthquake on each of the receiver plane of the 2017 MW6.5 Jiuzhaigou earthquake (unit:×105Pa) |
接收断层参数变化也会不同程度地影响周边31次M≥6强震在MW6.5九寨沟地震断层面上的同震库仑应力变化(表 5).这些强震在不同接收断层面上激发的净库仑应力变化的变动范围为(-0.026~3.078)×105Pa.八组接收断层面上的库仑应力变化有七组均为正((0.047~3.078)×105Pa),只有采用第2组接收断层面时,净库仑应力变化为负值(-0.026×10⁵Pa).这主要是由于采用此接收断层面时,1879年M8.0甘肃武都地震造成了显著的库仑应力下降(-1.326×10⁵Pa),超过了1654年M8.0甘肃天水南地震的库仑应力加载作用(1.266×10⁵Pa).采用第7组接收断层面时,尽管1879年M8.0甘肃武都地震也造成了显著的库仑应力下降(-0.454×10⁵Pa),但是由于1654年M8.0甘肃天水南地震造成了正库仑应力(0.410×10⁵Pa),加之2008年汶川地震的作用(0.099×10⁵Pa),使得九寨沟地震处的净库仑应力仍然出现升高(0.047×10⁵Pa).
|
|
表 5 历史和近年来强震在2017年MW6.5九寨沟地震不同接收断层面上造成的同震库仑应力变化(单位:×105Pa) Table 5 Significant coseismic Coulomb stress changes induced by some historic and recent strong earthquakes (unit:×105Pa). The Coulomb stress changes are resolved on the receiver planes of the 2017 MW6.5 Jiuzhaigou earthquake |
由于下地壳和上地幔震后黏弹性松弛作用,震后黏弹性库仑应力会对九寨沟地震的发生产生影响(表 6),其对九寨沟地震的影响与同震库仑应力对九寨沟地震的影响类似:1654年M8.0甘肃天水南地震、1879年M8.0甘肃武都和2008年汶川地震对九寨沟地震的影响比较显著.这三个地震在不同的九寨沟地震接收断层面上造成的黏弹性库仑应力变化分别为:(0.147~0.490)×105Pa、(-1.593~1.072)×105Pa和(0.010~0.032)×105Pa.而对应的同震库仑应力变化分别为:(0.410~1.266)×105Pa、(-1.326~2.364)×105Pa和(0.055~0.099)×105Pa(表 5).总体上,九寨沟地震周边强震对其净同震库仑应力影响大于其净黏弹性库仑应力影响(表 6).七组不同九寨沟接收断层面上、所有周边强震造成的同震库仑应力变化和黏弹性库仑应力变化之和为:(0.926~3.234)×105Pa,只有在采用第七组接收断层面时,总库仑应力变化为-0.793×10⁵Pa(表 6).采用该组接收断层面时九寨沟地震处的净震后库仑应力变化为-0.840×10⁵Pa,主要是由于1879年地震造成了显著的负黏弹性库仑应力变化(-1.227×10⁵Pa).
|
|
表 6 历史和近年来强震在2017年MW6.5九寨沟地震接收断层面上造成的震后库仑应力变化及总库仑应力变化(单位:×105Pa) Table 6 Same as Table 5 but for significant postseismic Coulomb stress changes induced by the 31 historic and recent strong earthquakes and the compounded coseismic and postseismic Coulomb stress changes (unit:×105Pa) |
上面分析表明,震后黏弹性库仑应力变化和同震库仑应力变化均与接收断层选择有关.其原因在于计算库仑应力时需要将震后黏弹性应力张量和同震应力张量投影至指定的接收断层面.前人的研究结果也表明,如上两种库仑应力变化与接收断层选择有关.例如,Nalbant和McCloskey (2011)分别采用两种汶川地震接收断层参数计算得到1786—1976年11次强震激发的同震库仑应力变化和黏弹性库仑应力变化,其分别为:(-0.0073~0.0415)×105Pa和(-0.045~-0.050)×105Pa.Pollitz等(2003)采用两种接收断层模型计算了1905—1950年MW≥7地震序列在1957年MW8.1蒙古戈壁—阿尔泰地震处的库仑应力变化,其同震库仑应力变化和震后黏弹性库仑应力变化分别为:(-0.03~-0.01)×105Pa和(-0.37~0.13)×105Pa.
4.4 震后黏弹性松弛效应对周边断层的黏弹性库仑应力扰动震后黏弹性松弛效应不仅影响地震的发生,而且可能改变主要活动断裂上的应力状态.例如,沈正康等(2003)研究了青藏高原北部东昆仑破裂带1937年至2001年间5次七级及以上强震的黏弹性库仑应力触发作用,发现该强震序列在东昆仑断层中段的东大滩—西大滩断层段造成(0.5~1.0)×105Pa的黏弹性库仑应力变化.万永革等(2007)研究了青藏高原东北部1920年以来20次M≥7强震的黏弹性库仑应力和构造应力加载作用,发现有17次地震均发生在累积库仑应力为正的区域.Nalbant和McCloskey (2011)计算了2008年汶川地震激发的库仑应力变化,其结果显示岷江断裂和虎牙断裂最南端,均因汶川地震震后黏弹性松弛效应使得黏弹性库仑应力增加;东昆仑断裂东段同震库仑应力为0.015×10⁵Pa,12年后黏弹性库仑应力可以累积至0.028×10⁵Pa,22年后可至0.038×10⁵Pa.单斌等(2013)计算了2008年汶川地震和2013年芦山地震造成的周边断层上的库仑应力变化,其结果显示北川—映秀断裂西南端数十年后库仑应力变化由负值变成正值,鲜水河断裂康定段库仑应力变化在2028年左右大于0.1×10⁵Pa.
九寨沟地震及周边强震激发的震后20年黏弹性库仑应力变化在鲜水河断裂带、龙门山断裂带中段、秦岭南缘断裂西段、塔藏断裂和龙日坝断裂南段上比较明显(图 11),其中,鲜水河断裂北段平均黏弹性库仑应力变化为3.0×10⁵Pa、南段为2.6×10⁵Pa;龙门山断裂中段平均黏弹性库仑应力变化为2.8×10⁵Pa;塔藏断裂平均黏弹性库仑应力变化为(2.3~2.7)×105Pa;龙日坝断裂南段平均黏弹性库仑应力变化为0.6×10⁵Pa.另外,东昆仑断裂除最南端黏弹性库仑应力变化为0.2×10⁵Pa外,其余黏弹性库仑应力均为负值;岷江断裂除其南段北侧附近黏弹性库仑应力变化为0.4×10⁵Pa外,其余黏弹性库仑应力也均为负值.而Nalbant和McCloskey (2011)计算了2008年汶川地震震后22年周边断层上的黏弹性库仑应力变化,其结果显示:东昆仑断裂、龙门山断裂南段和鲜水河断裂带道孚至康定段的黏弹性库仑应力均为正值;鲜水河断裂带同震库仑应力变化为0.09×10⁵Pa,22年后的黏弹性库仑应力变化为0.11×10⁵Pa.

|
图 11 九寨沟地震及周边强震激发的震后20年黏弹性库仑应力变化 震后库仑应力采用VISCO1D软件(Pollitz, 1997)计算.球体分层黏弹性地球模型来自Wang等(2017).值得注意的是,九寨沟地震刚发生前周边强震已造成了累积的震后库仑应力变化.周边强震(见图 1)在本图中采用红色五角星来表示. Fig. 11 Postseismic Coulomb stress changes associated with the Jiuzhaigou earthquake and surrounding large earthquakes (red stars) after 20 years since 8 August 2017 Postseismic Coulomb stress changes are computed using the VISCO1D software (Pollitz, 1997) based on the viscoelastic Earth′s model from Wang et al. (2017). Note that just before of the Jiuzhaigou earthquake, there have had accumulated postseismic Coulomb stress changes due to the prior earthquakes (as shown in Fig. 1 and also marked with red stars here). |
Nalbant和McCloskey (2011)也计算了1786—1976年11次强震同震库仑应力变化和震后库仑应力变化,其结果显示:鲜水河断裂道孚至康定段库仑应力增加、岷江断裂和虎牙断裂库仑应力均减小、东昆仑断裂东段库仑应力增加.而本文顾及了32次强震同震库仑应力变化和震后20年黏弹性库仑应力变化共同作用(图 12),发现鲜水河断裂北段南侧库仑应力增加25.1×10⁵Pa、南段康定至道孚分段北侧库仑应力增加10.1×10⁵Pa;龙门山断裂中段北侧库仑应力升高9.3 ×10⁵Pa;岷江断裂南段和其北段南侧库仑应力分别增加9.1×10⁵Pa和4.7×10⁵Pa;塔藏断裂库仑应力增加(5.4~20.1)×105Pa;虎牙断裂库仑应力增加10.7×10⁵Pa.

|
图 12 九寨沟地震及周边强震在主要活动断裂上激发的同震库仑应力和震后20年黏弹性库仑应力变化之和 Fig. 12 Compounded Coulomb stress changes of the coseismic Coulomb stress changes induced by the Jiuzhaigou earthquake and surrounding large earthquakes (Fig. 10) and the postseismic Coulomb stress changes after 20 years since 8 August 2017 (Fig. 11) |
此外,对比图 10和图 12可以发现,由于黏弹性库仑应力作用,除了个别断裂(如龙日坝断裂、东昆仑断裂、青海南山—循化南山断裂、秦岭南缘断裂西段、塔藏断裂和马边—盐津断裂)分段上的总库仑应力变化空间分布相较于同震库仑应力变化空间分布发生变化外,整体上周边各断裂分段上的同震库仑应力变化空间分布和总的库仑应力变化空间分布大体一致.前人研究也有类似发现.例如,Nalbant和McCloskey(2011)计算的汶川地震及周边11次强震的同震库仑应力变化空间分布和顾及同震库仑应力及22年后的震后黏弹性库仑应力的总库仑应力变化空间分布大体一致.这表明强震序列的同震库仑应力变化在该时间尺度内相对黏弹性库仑应力变化占优.
然而,同震库仑应力相对黏弹性库仑应力的比重可能同具体的地震序列有关.例如,沈正康等(2003)分析了东昆仑断裂带1937年M7.5花石峡地震、1963年MS7.1都兰地震、1973年MS7.3玛尼地震、1997年MW7.5玛尼地震和2001年MW7.8可可西里地震的同震库仑应力变化和震后黏弹性库仑应力变化,就发现前四次地震处的同震库仑应力变化所占比重分别为11.5%、27.2%、34.8%和79.6%.亦即,震后时间越长,黏弹性库仑应力的作用就愈发明显.Freed等(2007)计算了1812—2004年美国南加州地区的同震、震后和震间库仑应力变化,在2003年MW6.6 San Simeon地震处的同震库仑应力和震后黏弹性库仑应力分别为:-0.35×10⁵Pa和0.53×10⁵Pa,而在2004年MW6.0 Parkfield地震处的同震库仑应力和震后黏弹性库仑应力分别为:14.8×10⁵Pa和2.17×10⁵Pa.因此,同震库仑应力变化和黏弹性库仑应力变化在总库仑应力中所占份额随震后时间演变模式同被分析的地震序列有关.
5 结论本文通过对2017年MW6.5九寨沟地震有关的库仑应力触发研究,得到如下结论:
(1) 2017年MW6.5地震激发的同震库仑应力变化在局部范围内比较显著(>0.1×10⁵Pa),其仅在附近的岷江断裂北段、塔藏断裂和虎牙断裂南段有一定的应力加载作用,平均库仑应力变化分别为0.09×10⁵Pa、(0.14~2.03)×105Pa和0.25 ×10⁵Pa.
(2) 2008年MW7.9汶川地震对九寨沟地震的发生有一定的促进作用.同震库仑应力变化范围为(0.026~0.263)×105Pa.震后库仑应力变化范围为(0.010~0.032)×105Pa.汶川地震断层滑动分布模型和九寨沟地震的震源机制节面以及九寨沟地震的震中位置都会对激发的同震库仑应力变化的大小有一定的影响,但对库仑应力变化的符号没有影响.2013年芦山地震对九寨沟地震的发生则几乎没有影响( < 0.001×10⁵Pa).
(3) 1654年M8.0甘肃天水南地震对九寨沟地震的发生有显著触发作用,造成的同震库仑应力变化范围为(0.410~1.266)×105Pa,震后库仑应力变化范围为(0.147~0.490)×105Pa.而1879年M8.0甘肃武都地震对九寨沟地震的库仑应力作用虽然比较明显,但是由于九寨沟地震接收断层选择的不同,该地震可能造成九寨沟地震发生处的同震库仑应力下降((-1.326~-0.454)×105Pa)和震后库仑应力下降((-1.593~-0.106)×105Pa),也可能造成九寨沟地震发生处的同震库仑应力升高((0.913~2.364)×105Pa)和震后库仑应力升高((0.094~1.072)×105Pa).1933年叠溪地震对九寨沟地震的发生有微弱的影响,同震库仑应力变化为(0.015~0.080)×105Pa,震后库仑应力变化为(-0.029~0.025)×105Pa.
(4) 九寨沟地震及周边31个M≥6强震造成了周边主要活动断层的同震应力扰动,其中鲜水河断裂南段道孚—康定段的北侧和鲜水河断裂北段南侧库仑应力分别升高9.0×10⁵Pa和23.0×10⁵Pa;龙门山断裂带中段的北侧库仑应力升高(6.1~7.4)×105Pa;岷江断裂北段南侧和岷江断裂南段的库仑应力分别增加5.6×10⁵Pa和9.8×10⁵Pa;龙日坝断裂北段最北侧的库仑应力变化为2.0×10⁵Pa;小金河断裂北段库仑应力升高1.7×10⁵Pa;安宁河断裂北段库仑应力升高1.6×10⁵Pa.九寨沟地震震后20年黏弹性库仑应力在鲜水河断裂、龙门山断裂中段、塔藏断裂和秦岭南缘断裂西段比较显著,其黏弹性库仑应力分别为:(1.0~3.0)×105Pa、2.8×10⁵Pa、(2.3~2.7)×105Pa和0.9×10⁵Pa.黏弹性库仑应力累积并不显著改变强震序列造成的周边断层上的同震库仑应力变化.鲜水河断裂北段南侧和南段道孚至康定段北侧、龙门山断裂中段北侧、岷江断裂南段和北段南侧、虎牙断裂、塔藏断裂以及西秦岭北缘东段总的库仑应力显著升高,这些断裂分段上的未来潜在地震危险性值得进一步关注.
致谢衷心感谢两位审稿专家和编辑的有益意见和建议.房立华研究员提供了九寨沟地震及余震精定位数据.单新建研究员InSAR研究组提供了九寨沟地震断层滑动分布结果.本文图件采用GMT作图(Wessel and Smith, 1998).
Avouac J P, Ayoub F, Wei S J, et al.
2014. The 2013, MW7.7 Balochistan earthquake, energetic strike-slip reactivation of a thrust fault. Earth and Planetary Science Letters, 391: 128-134.
DOI:10.1016/j.epsl.2014.01.036 |
|
Barnhart W D, Murray J R, Briggs R W, et al.
2016. Coseismic slip and early afterslip of the 2015 Illapel, Chile, earthquake: Implications for frictional heterogeneity and coastal uplift. Journal of Geophysical Research, 121(8): 6172-6191.
DOI:10.1002/2016JB013124 |
|
Cattania C, Hainzl S, Wang L, et al.
2014. Propagation of Coulomb stress uncertainties in physics-based aftershock models. Journal of Geophysical Research, 119(10): 7846-7864.
DOI:10.1002/2014JB011183 |
|
Chen Q C, Feng C J, Meng W, et al.
2012. Analysis of in situ stress measurements at the northeastern section of the Longmenshan fault zone after the 5.12 Wenchuan earthquake. Chinese Journal of Geophysics (in Chinese), 55(12): 3923-3932.
DOI:10.6038/j.issn.0001-5733.2012.12.005 |
|
Cheng H H, Zhang B, Zhang H, et al.
2017. Calculation of the co-seismic deformation and stress changes of the Kaikoura MW7.8 earthquake, Nov 13, 2016. Chinese Journal of Geophysics (in Chinese), 60(7): 2641-2651.
DOI:10.6038/cjg20170712 |
|
Cui X F, Hu X P, Chen J W. 2017. Regional tectonic stress field map surrounding the 2017/08/08 M7.0 Jiuzhaigou earthquake (in Chinese). http://www.eq-icd.cn/showinfo.asp?ArticleID=24695.
|
|
Deng Q D, Cheng S P, Ma J, et al.
2014. Seismic activities and earthquake potential in the Tibetan Plateau. Chinese Journal of Geophysics (in Chinese), 57(7): 2025-2042.
DOI:10.6038/cjg20140701 |
|
Felzer K R, Becker T W, Abercrombie R E, et al.
2002. Triggering of the 1999 MW7.1 Hector Mine earthquake by aftershocks of the 1992 MW7.3 Landers earthquake. Journal of Geophysical Research, 107(B9): 2190.
DOI:10.1029/2001JB000911 |
|
Freed A M, Ali S T, Bürgmann R.
2007. Evolution of stress in Southern California for the past 200 years from coseismic, postseismic and interseismic stress changes. Geophysical Journal International, 169(3): 1164-1179.
DOI:10.1111/j.1365-246X.2007.03391.x |
|
Hainzl S, Enescu B, Cocco M, et al.
2009. Aftershock modeling based on uncertain stress calculations. Journal of Geophysical Research, 114(B5): B05309.
DOI:10.1029/2008JB006011 |
|
Hamling I J, Hreinsdóttir S, Clark K, et al.
2017. Complex multifault rupture during the 2016 MW7.8 Kaikõura earthquake, New Zealand. Science, 356(6334).
DOI:10.1126/science.aam7194 |
|
Hashimoto M, Enomoto M, Fukushima Y.
2010. Coseismic deformation from the 2008 Wenchuan, China, earthquake derived from ALOS/PALSAR images. Tectonophysics, 491(1-4): 59-71.
DOI:10.1016/j.tecto.2009.08.034 |
|
He J K, Xia W H, Lu S J, et al.
2011. Three-dimensional finite element modeling of stress evolution around the Xiaojiang fault system in the southeastern Tibetan plateau during the past ~500 years. Tectonophysics, 507(1-4): 70-85.
DOI:10.1016/j.tecto.2011.05.009 |
|
He Y L. 2013. Study on the main fault activities and tectonic deformation: Tectonics in the eastern margin of the Qinghai-Tibet Plateau [Ph. D. thesis] (in Chinese). Chengdu: Chengdu University of Technology.
|
|
Helmstetter A, Shaw B E.
2006. Relation between stress heterogeneity and aftershock rate in the rate-and-state model. Journal of Geophysical Research, 111: B07304.
DOI:10.1029/2005JB004077 |
|
Herman M W, Nealy J L, Yeck W L, et al.
2017. Integrated geophysical characteristics of the 2015 Illapel, Chile, earthquake. Journal of Geophysical Research, 122(6): 4691-4711.
DOI:10.1002/2016JB013617 |
|
Ji C, Hayes G. 2008. Preliminary result of the May 12, 2008 MW7.9 earthquake Sichuan, China earthquake. Available at https://earthquake.usgs.gov/earthquakes/eventpage/usp000g650 finite-fault.
|
|
Jiang G Y, Wen Y M, Liu Y J, et al.
2015. Joint analysis of the 2014 Kangding, southwest China, earthquake sequence with seismicity relocation and InSAR inversion. Geophysical Research Letters, 42(9): 3273-3281.
DOI:10.1002/2015GL063750 |
|
Jiang Z S, Wang M, Wang Y Z, et al.
2014. GPS constrained coseismic source and slip distribution of the 2013 MW6.6 Lushan, China, earthquake and its tectonic implications. Geophysical Research Letters, 41(2): 407-413.
DOI:10.1002/2013GL058812 |
|
King G C P, Stein R S, Lin J.
1994. Static stress changes and the triggering of earthquakes. Bulletin of the Seismological Society of America, 84(3): 935-953.
|
|
Lin X, Hao J L, Yao Z X.
2017. Rupture process and Coulomb stress change of the MW8.3 earthquake and the MW8.8 earthquake, Chile. Chinese Journal of Geophysics (in Chinese), 60(7): 2680-2692.
DOI:10.6038/cjg20170715 |
|
Mallman E P, Zoback M D.
2007. Assessing elastic Coulomb stress transfer models using seismicity rates in southern California and southwestern Japan. Journal of Geophysical Research, 112: B03304.
DOI:10.1029/2005JB004076 |
|
Marsan D, Lengliné O.
2008. Extending earthquakes' reach through cascading. Science, 319(5866): 1076-1079.
DOI:10.1126/science.1148783 |
|
Marsan D, Helmstetter A.
2017. How variable is the number of triggered aftershocks?. Journal of Geophysical Research, 122: 5544-5560.
DOI:10.1002/2016JB013807 |
|
Molnar P, Deng Q D.
1984. Faulting associated with large earthquakes and the average rate of deformation in central and eastern Asia. Journal of Geophysical Research, 89(B7): 6203-6227.
DOI:10.1029/JB089iB07p06203 |
|
Nalbant S S, McCloskey J.
2011. Stress evolution before and after the 2008 Wenchuan, China earthquake. Earth and Planetary Science Letters, 307(1-2): 222-232.
DOI:10.1016/j.epsl.2011.04.039 |
|
Okada Y.
1992. Internal deformation due to shear and tensile faults in a half-space. Bulletin of the Seismological Society of America, 82(2): 1018-1040.
|
|
Parsons T, Ji C, Kirby E.
2008. Stress changes from the 2008 Wenchuan earthquake and increased hazard in the Sichuan basin. Nature, 454(7203): 509-510.
DOI:10.1038/nature07177 |
|
Pollitz F F.
1997. Gravitational viscoelastic postseismic relaxation on a layered spherical earth. Journal of Geophysical Research, 102(B8): 17921-17941.
DOI:10.1029/97JB01277 |
|
Pollitz F, Vergnolle M, Calais E.
2003. Fault interaction and stress triggering of twentieth century earthquakes in Mongolia. Journal of Geophysical Research, 108(B10): 2503.
DOI:10.1029/2002JB002375 |
|
Ren J J. 2013. Late Quaternary activity of the Longriba fault zone and its kinematic relations with adjacent faults [Ph. D. thesis] (in Chinese). Beijing: Institute of Geology, China Earthquake Administration.
|
|
Shan B, Xiong X, Zheng Y, et al.
2009. Stress changes on major faults caused by MW7.9 Wenchuan earthquake, May 12, 2008. Science in China Series D: Earth Sciences, 52(5): 593-601.
DOI:10.1007/s11430-009-0060-9 |
|
Shan B, Xiong X, Wang R J, et al. 2013. Coulomb stress evolution along Xianshuihe-Xiaojiang Fault System since 1713 and its interaction with Wenchuan earthquake, May 12, 2008. Earth and Planetary Science Letters, 377-378: 199-210, doi: 10.1016/j.epsl.2013.06.044.
|
|
Shan B, Xiong X, Zheng Y, et al.
2013. Stress changes on major faults caused by 2013 Lushan earthquake and its relationship with 2008 Wenchuan earthquake. Science China: Earth Sciences, 56(7): 1169-1176.
DOI:10.1007/s11430-013-4642-1 |
|
Shan B, Xiong X, Wang R J, et al.
2015. Stress evolution and seismic hazard on the Maqin-Maqu segment of East Kunlun Fault zone from co-, post-and interseismic stress changes. Geophysical Journal International, 200(1): 244-253.
DOI:10.1093/gji/ggu395 |
|
Shan X J, Qu C Y, Gong W Y, et al. 2017. http://www.eq-igl.ac.cn/upload/files/2017/8/15151711397.pdf.
|
|
Shao Z G, Zhou L Q, Jiang C S, et al.
2010. The impact of Wenchuan MS8.0 earthquake on the seismic activity of surrounding faults. Chinese Journal of Geophysics (in Chinese), 53(8): 1784-1795.
DOI:10.3969/j.issn.0001-5733.2010.08.004 |
|
Shao Z G, Xu J, Ma H S, et al.
2016. Coulomb stress evolution over the past 200 years and seismic hazard along the Xianshuihe fault zone of Sichuan, China. Tectonophysics, 670: 48-65.
DOI:10.1016/j.tecto.2015.12.018 |
|
Shen Z K, Wan Y G, Gan W J, et al.
2003. Viscoelastic triggering among large earthquakes along the East Kunlun fault system. Chinese Journal of Geophysics (in Chinese), 46(6): 786-795.
|
|
Shen Z K, Sun J B, Zhang P Z, et al.
2009. Slip maxima at fault junctions and rupturing of barriers during the 2008 Wenchuan earthquake. Nature Geoscience, 2(10): 718-724.
DOI:10.1038/ngeo636 |
|
Sheng S Z, Wan Y G, Jiang C S, et al.
2015. Preliminary study on the static stress triggering effects on China mainland with the 2015 Nepal MS8.1 earthquake. Chinese Journal of Geophysics (in Chinese), 58(5): 1834-1842.
DOI:10.6038/cjg20150534 |
|
Sladen A. 2008. Available at http://www.tectonics.caltech.edu/slip_history/2008_e_sichuan/e_sichuan.html.
|
|
Steacy S, Marsan D, Nalbant S S, et al.
2004. Sensitivity of static stress calculations to the earthquake slip distribution. Journal of Geophysical Research, 109: B04303.
DOI:10.1029/2002JB002365 |
|
Steacy S, Gomberg J, Cocco M.
2005. Introduction to special section: Stress transfer, earthquake triggering, and time-dependent seismic hazard. Journal of Geophysical Research, 110: B05S01.
DOI:10.1029/2005JB003692 |
|
Styron R, Taylor M, Okoronkwo K.
2010. Database of active structures from the Indo-Asian collision. EOS, 91(20): 181-182.
DOI:10.1029/2010EO200001 |
|
Taylor M, Yin A.
2009. Active structures of the Himalayan-Tibetan orogen and their relationships to earthquake distribution, contemporary strain field, and Cenozoic volcanism. Geosphere, 5(3): 199-214.
DOI:10.1130/GES00217.1 |
|
Toda S, Stein R S, Richards-Dinger K, et al.
2005. Forecasting the evolution of seismicity in southern California: Animations built on earthquake stress transfer. Journal of Geophysical Research, 110: B05S16.
DOI:10.1029/2004JB003415 |
|
Toda S, Lin J, Meghraoui M, et al.
2008. 12 May 2008 M=7.9 Wenchuan, China, earthquake calculated to increase failure stress and seismicity rate on three major fault systems. Geophysical Research Letters, 35(17).
DOI:10.1029/2008GL034903 |
|
Toda S, Lin J, Stein R S.
2011. Using the 2011 MW9.0 off the Pacific coast of Tohoku Earthquake to test the Coulomb stress triggering hypothesis and to calculate faults brought closer to failure. Earth, Planets and Space, 63: 725-730.
DOI:10.5047/eps.2011.05.010 |
|
Toda S, Stein R S.
2013. The 2011 M=9.0 Tohoku oki earthquake more than doubled the probability of large shocks beneath Tokyo. Geophysical Research Letters, 40(11): 2562-2566.
DOI:10.1002/grl.50524 |
|
Wan Y G, Shen Z K, Zeng Y H, et al.
2007. Evolution of cumulative Coulomb failure stress in northeastern Qinghai-Xizang (Tibetan) Plateau and its effect on large earthquake occurrence. Acta Seismologica Sinica (in Chinese), 29(2): 115-129.
|
|
Wan Y G, Shen Z K.
2010. Static Coulomb stress changes on faults caused by the 2008 MW7.9 Wenchuan, China earthquake. Tectonophysics, 491(1-4): 105-118.
DOI:10.1016/j.tecto.2010.03.017 |
|
Wan Y G, Sheng S Z, Li X, et al.
2015. Stress influence of the 2015 Nepal earthquake sequence on Chinese mainland. Chinese Journal of Geophysics (in Chinese), 58(11): 4277-4286.
DOI:10.6038/cjg20151132 |
|
Wang J J, Xu C J, Freymueller J T, et al.
2014. Sensitivity of Coulomb stress change to the parameters of the Coulomb failure model: A case study using the 2008 MW7.9 Wenchuan earthquake. Journal of Geophysical Research, 119(4): 3371-3392.
DOI:10.1002/2012JB009860 |
|
Wang J J, Xu C J, Freymueller J T, et al.
2017. Probing Coulomb stress triggering effects for a MW>6.0 earthquake sequence from 1997 to 2014 along the periphery of the Bayan Har block on the Tibetan Plateau. Tectonophysics, 694: 249-267.
DOI:10.1016/j.tecto.2016.11.009 |
|
Wang K Y, Ma S L.
2011. Analysis of co-seismic rupture models for 2008 Wenchuan earthquake and relations with aftershock. Chinese Journal of Geophysics (in Chinese), 54(6): 1511-1516.
DOI:10.3969/j.issn.0001-5733.2011.06.010 |
|
Wang Q, Qiao X J, Lan Q G, et al.
2011. Rupture of deep faults in the 2008 Wenchuan earthquake and uplift of the Longmen Shan. Nature Geoscience, 4(9): 634-640.
DOI:10.1038/ngeo1210 |
|
Wells D L, Coppersmith K J.
1994. New empirical relationships among magnitude, rupture length, rupture width, rupture area, and surface displacement. Bulletin of the Seismological Society of America, 84(4): 974-1002.
|
|
Wessel P, Smith W H F.
1998. New, improved version of generic mapping tools released. EOS, 79(47): 579.
DOI:10.1029/98EO00426 |
|
Xie C D, Zhu Y Q, Lei X L, et al.
2010. Pattern of stress change and its effect on seismicity rate caused by MS8.0 Wenchuan earthquake. Science China: Earth Sciences, 53(9): 1260-1270.
DOI:10.1007/s11430-010-4025-9 |
|
Xiong W, Tan K, Liu G, et al.
2015. Coseismic and postseismic Coulomb stress changes on surrounding major faults caused by the 2015 Nepal MW7.9 earthquake. Chinese Journal of Geophysics (in Chinese), 58(11): 4305-4316.
DOI:10.6038/cjg20151135 |
|
Xu C J, Wang J J, Li Z H, et al.
2010. Applying the Coulomb failure function with an optimally oriented plane to the 2008 MW7.9 Wenchuan earthquake triggering. Tectonophysics, 491(1-4): 119-126.
DOI:10.1016/j.tecto.2009.09.019 |
|
Xu X W, Yu G H, Wu X Y. 2017. http://www.eq-igl.ac.cn/upload/images/2017/8/991724632.jpg.
|
|
Zhang B, Cheng H H, Shi Y L.
2015. Calculation of the co-seismic effect of MS8.1 earthquake, April 25, 2015, Nepal. Chinese Journal of Geophysics (in Chinese), 58(5): 1794-1803.
DOI:10.6038/cjg20150529 |
|
Zhao X L, Deng Q D, Chen S F.
1994. Tectonic geomorphology of the Minshan uplift in western Sichuan, southwestern China. Seismology and Geology (in Chinese), 16(4): 429-439.
|
|
Zhou R J, Li Y, Densmore A L, et al.
2006. Active tectonics of the eastern margin of the Tibet Plateau. Journal of Mineralogy and Petrology (in Chinese), 26(2): 40-51.
|
|
陈群策, 丰成君, 孟文, 等.
2012. 5.12汶川地震后龙门山断裂带东北段现今地应力测量结果分析. 地球物理学报, 55(12): 3923–3932.
DOI:10.6038/j.issn.0001-5733.2012.12.005 |
|
程惠红, 张贝, 张怀, 等.
2017. 2016年11月13日新西兰凯库拉(Kaikoura)MW7.8地震同震位移和应力数值分析. 地球物理学报, 60(7): 2641–2651.
DOI:10.6038/cjg20170712 |
|
崔效锋, 胡幸平, 陈佳维. 2017. 2017年8月8日四川九寨沟7. 0级地震周边构造应力场图. http://www.eq-icd.cn/showinfo.asp?ArticleID=24695.
|
|
邓起东, 程绍平, 马冀, 等.
2014. 青藏高原地震活动特征及当前地震活动形势. 地球物理学报, 57(7): 2025–2042.
DOI:10.6038/cjg20140701 |
|
何玉林. 2013. 青藏高原东缘主干断裂活动性及其构造变形模式研究[博士论文]. 成都: 成都理工大学.
|
|
林鑫, 郝金来, 姚振兴.
2017. 智利MW8.3地震与MW8.8地震的震源过程及其引起的库仑应力特征. 地球物理学报, 60(7): 2680–2692.
DOI:10.6038/cjg20170715 |
|
任俊杰. 2013. 龙日坝断裂带晚第四纪活动及与其周边断裂的运动学关系[博士论文]. 北京: 中国地震局地质研究所.
|
|
单斌, 熊熊, 郑勇, 等.
2009. 2008年5月12日MW7.9汶川地震导致的周边断层应力变化. 中国科学D辑:地球科学, 39(5): 537–545.
|
|
单斌, 熊熊, 郑勇, 等.
2013. 2013年芦山地震导致的周边断层应力变化及其与2008年汶川地震的关系. 中国科学D辑:地球科学, 43(6): 1002–1009.
|
|
单新建, 屈春燕, 龚文瑜等. 2017. 2017年8月8日四川九寨沟7. 0级地震InSAR初步分析结果. http://www.eq-igl.ac.cn/upload/files/2017/8/15151711397.pdf.
|
|
邵志刚, 周龙泉, 蒋长胜, 等.
2010. 2008年汶川MS8.0地震对周边断层地震活动的影响. 地球物理学报, 53(8): 1784–1795.
DOI:10.3969/j.issn.0001-5733.2010.08.004 |
|
沈正康, 万永革, 甘卫军, 等.
2003. 东昆仑活动断裂带大地震之间的黏弹性应力触发研究. 地球物理学报, 46(6): 786–795.
|
|
盛书中, 万永革, 蒋长胜, 等.
2015. 2015年尼泊尔MS8.1强震对中国大陆静态应力触发影响的初探. 地球物理学报, 58(5): 1834–1842.
DOI:10.6038/cjg20150534 |
|
万永革, 沈正康, 曾跃华, 等.
2007. 青藏高原东北部的库仑应力积累演化对大地震发生的影响. 地震学报, 29(2): 115–129.
|
|
万永革, 盛书中, 李祥, 等.
2015. 2015年尼泊尔强震序列对中国大陆的应力影响. 地球物理学报, 58(11): 4277–4286.
DOI:10.6038/cjg20151132 |
|
王凯英, 马胜利.
2011. 2008年汶川地震的破裂模型及引起的余震活动分析. 地球物理学报, 54(6): 1511–1516.
DOI:10.3969/j.issn.0001-5733.2011.06.010 |
|
解朝娣, 朱元清, LeiX L, 等.
2010. MS8.0汶川地震产生的应力变化空间分布及其对地震活动性的影响. 中国科学D辑:地球科学, 40(6): 688–698.
|
|
熊维, 谭凯, 刘刚, 等.
2015. 2015年尼泊尔MW7.9地震对青藏高原活动断裂同震、震后应力影响. 地球物理学报, 58(11): 4305–4316.
DOI:10.6038/cjg20151135 |
|
徐锡伟, 于贵华, 吴熙彦. 2017. 2017年8月8日四川九寨沟7. 0级地震区域地震构造图. http://www.eq-igl.ac.cn/upload/images/2017/8/991724632.jpg.
|
|
张贝, 程惠红, 石耀霖.
2015. 2015年4月25日尼泊尔Ms8.1大地震的同震效应. 地球物理学报, 58(5): 1794–1803.
DOI:10.6038/cjg20150529 |
|
赵小麟, 邓起东, 陈社发.
1994. 岷山隆起的构造地貌学研究. 地震地质, 16(4): 429–439.
|
|
周荣军, 李勇, DensmoreA L, 等.
2006. 青藏高原东缘活动构造. 矿物岩石, 26(2): 40–51.
|
|