2. 中国地震台网中心, 北京 100045
2. China Earthquake Network Center, Beijing 100045, China
近年来,随着大尺度密集地震台网和科学探测台阵的发展,利用远震波形记录叠加来估计大地震破裂轨迹的方法得到了迅速的发展应用.该方法具有处理速度快、结果不确定性小的优势,最初由Ishii和Krüger(Ishii et al.,2005;Krüger and Ohrnberger,2005)等提出,用于研究2004年12月苏门答腊MW9.3地震的破裂轨迹,后续也多次被成功地运用于大地震的破裂研究.如2008年的汶川MS8.0地震(Xu et al.,2009;杜海林等,2009)、2010年的智利MW8.8地震(Kiser and Ishii,2011;刘宁等,2010)、2011年的日本本州MW9.0地震(Koper et al.,2011a,2011b;Meng et al.,2012;Maercklin et al.,2012).也有不少学者对方法进行了改进,使成像精度进一步提高,获得了更多的破裂过程的细节(Yagi et al.,2012;Meng et al.,2012;Wang et al.,2012).
据中国地震台网测定,北京时间2015年4月25日14点11分在尼泊尔发生了MS8.1(MW7.9)地震,震中位置为东经84.65°,北纬28.15°.该地震造成重大人员伤亡和财产损失,并引发珠峰北坡雪崩.2015年5月12日在主震东南方向发生了一次MW7.3强余震. 此次尼泊尔地震发生在喜马拉雅构造带在印度洋板块与亚欧板块相互挤压碰撞作用下产生的主喜马拉雅逆冲断裂带(MHT)上.其从南至北依次由喜马拉雅主前缘断裂(MFT)、喜马拉雅主边界断裂(MBT)和喜马拉雅主中央断裂(MCT)三条主要逆冲断裂构成(邓起东等,2014).美国地质调查局(USGS)公布的结果显示(http://earthquake.usgs.gov/research/fy16-nepal2015/),4月25日的MW7.9级主震,及5月12日主震东南方向的MW7.3级强余震均发生在更深的主喜马拉雅逆冲断裂带(MHT)上(见图 1).GPS观测研究(Ader et al.,2012)也表明该断裂从地表沿倾向100 km是被锁住的区域,其闭锁导致了巨大的滑移亏欠,本次地震的发生正是该地区应力长期积累的结果.

|
图 1 主喜马拉雅逆冲断裂带(MHT)、喜马拉雅主前缘断裂(MFT)、喜马拉雅主边界断裂(MBT)、喜马拉雅主中央断裂(MCT)以及主震、最大余震滑移近似定位的横截面示意图. 图片来源:美国地质调查(USGS)(http://earthquake.usgs.gov/research/fy16-nepal2015/[2016-04-25]) Fig. 1 Generalized cross section demonstratesthe Main Himalayan Thrust(MHT),the Main Frontal Thrust(MFT),the Main Boundary Thrust(MBT),the Main Central Thrust(MCT),and the approximate locations of slip during the mainshock and largest aftershock,whichacquire from the U.S. geological survey(USGS).(http://earthquake.usgs.gov/research/fy16-nepal2015/) |
本文应用远震波形聚束的方法(Krüger and Ohrnberger,2005),使用欧洲台网的宽频带波形数据,得到了该次主震破裂释放能量中心的轨迹,并对所得到的结果进行了分析及讨论.
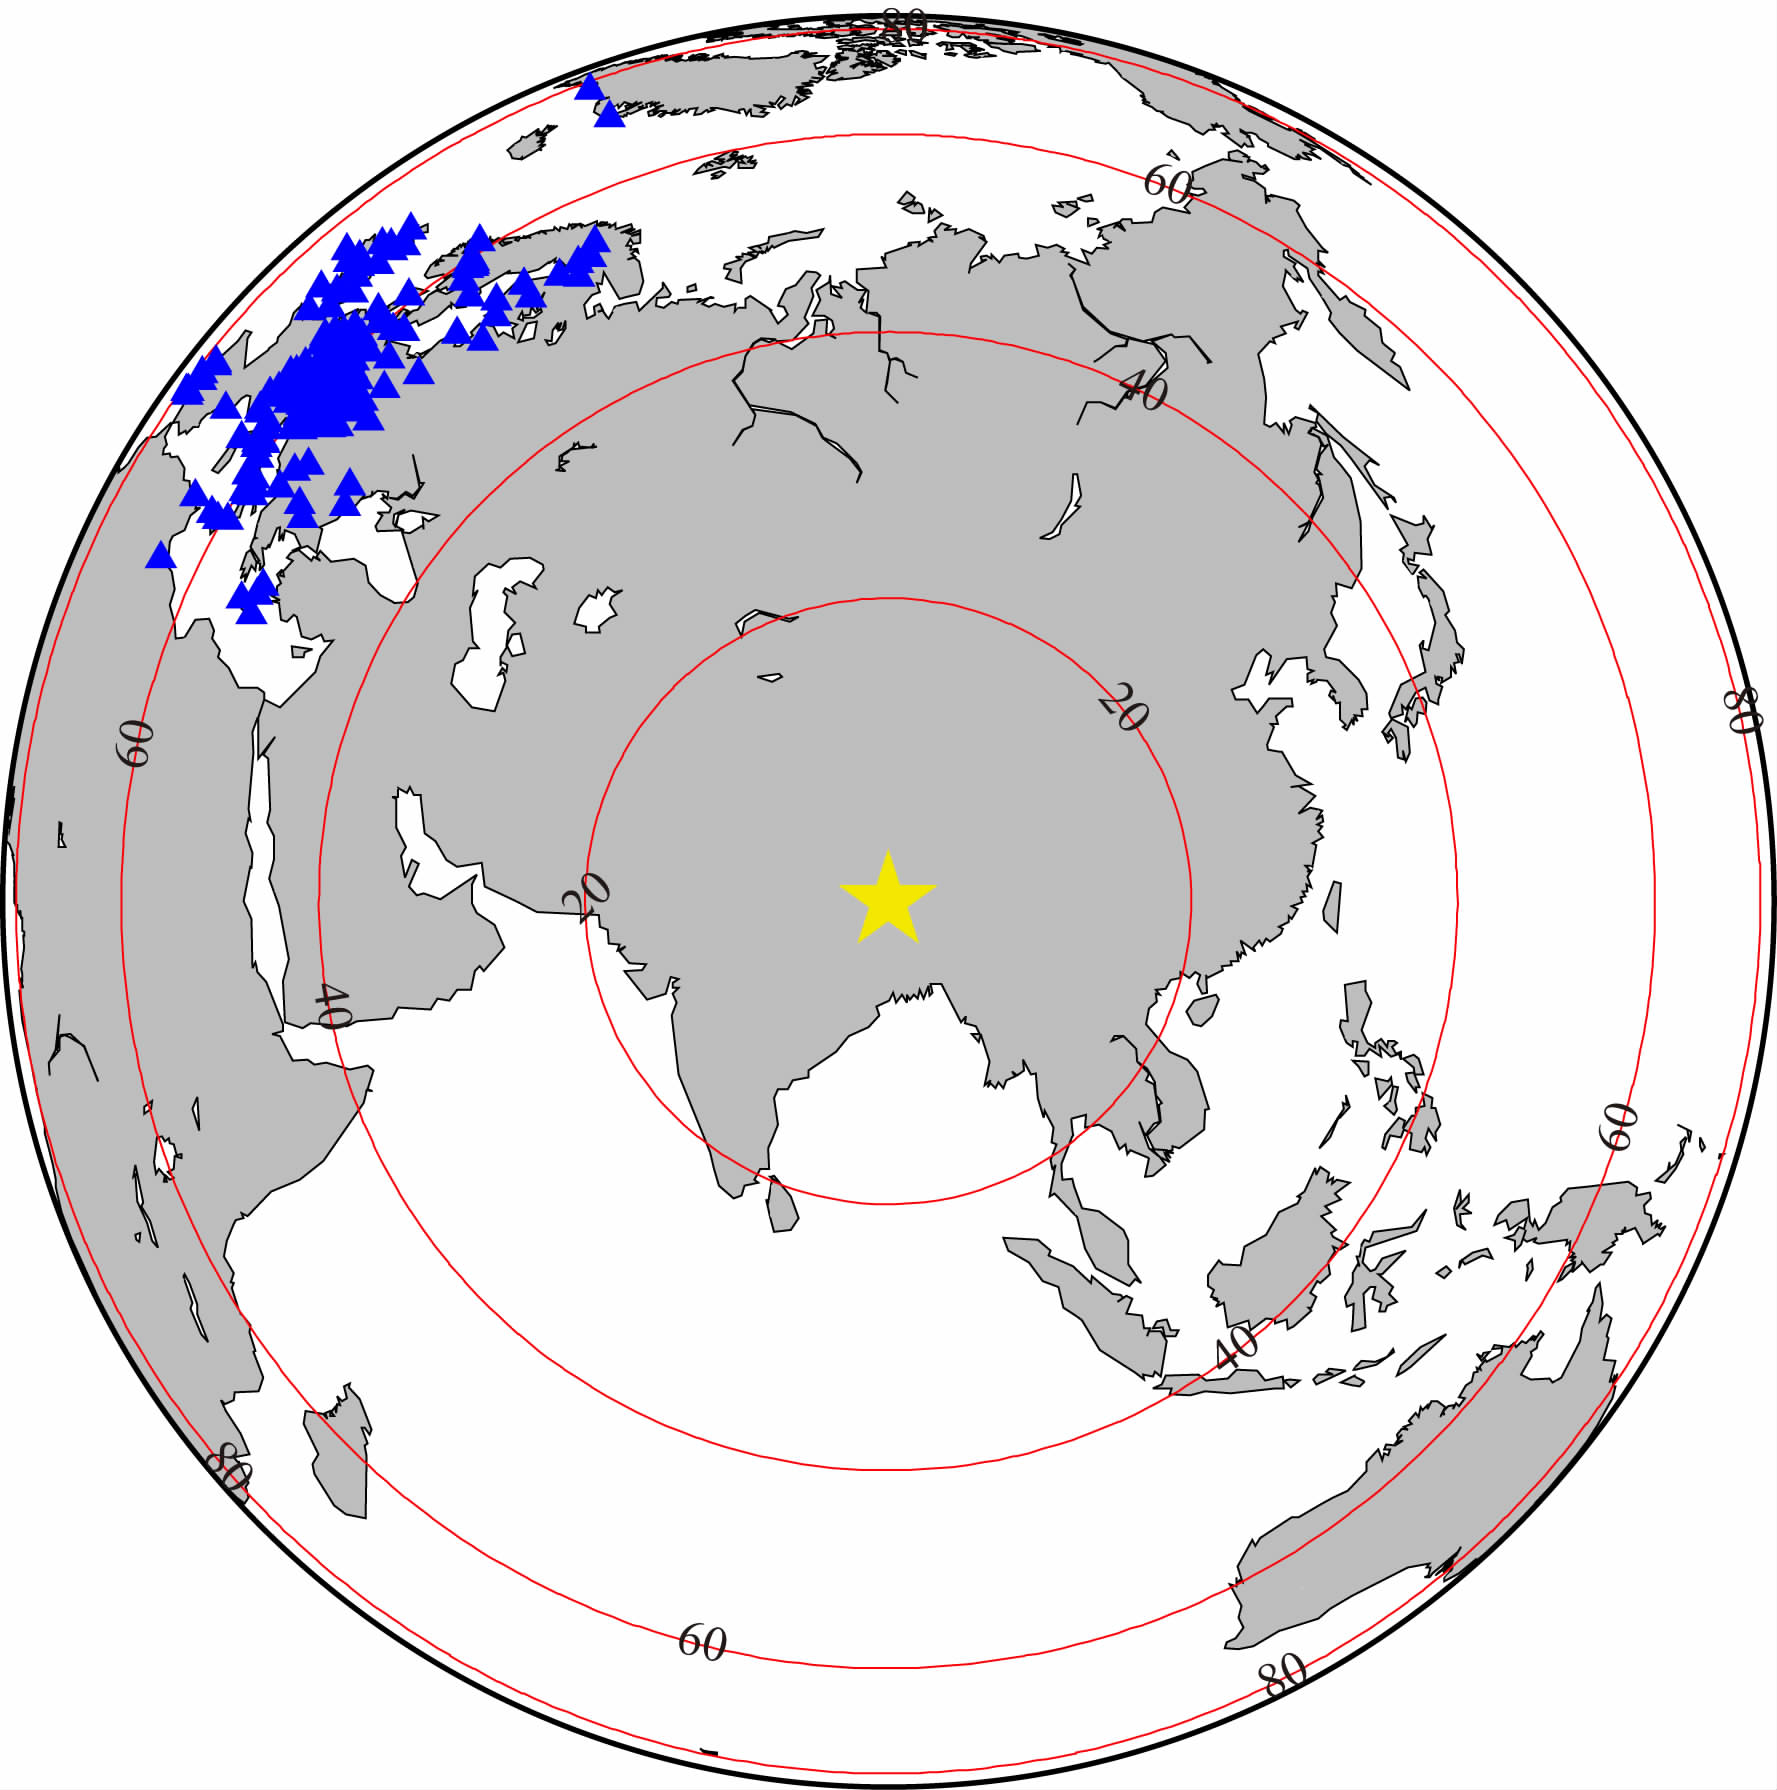
2 资料选取本文的研究方法需要使用远场地震观测资料,欧洲地震观测与研究实验室(ORFEUS)数据中心可以很方便地获取欧洲地震台网的地震波形数据,我们选用欧洲地区204个台站的宽频带数字地震资料,台站的震中距范围为47°~77°,方位角范围为284°~337°,台站分布见图 2.

|
图 2 台站分布图,蓝色三角为欧洲台网台站,黄色五角星为震中位置,红色圆圈标示了震中距范围. Fig. 2 Map of the distribution of stations. Blue triangles denoteEuropean network′s stations. Yellow star is epicenter. The epicentral distance indicated by the red solid circles. |
对于此次尼泊尔地震而言,欧洲地震台记录的地震波路径主要在地幔中传播,PP波相对到达较晚,主要破裂的信息能在PP波到达前被台站记录到,对波形的一致性的影响较小.我们使用垂直向宽频带P波记录对此次尼泊尔地震前80 s的数据进行了分析处理.由于所使用台网的横向尺度大,我们使用AIMBAT程序(Lou et al.,2013)提供的多通道互相关(MCCC)和迭代互相关叠加(ICCS)相结合的方法,通过自动和人机交互相结合的方式拾取远震初至P波到时,并根据波形相似程度(≥0.7)对数据进行了挑选.将所有波形按拾取到的P波初至到时对齐,以此减弱地球结构的横向不均匀性对结果的影响.
我们对原始数据分频段滤成两个频段滤波,较低频部分(0.01~0.2 Hz)和较高频部分(0.2~0.8 Hz)分别进行了处理分析.在处理低频部分时,时窗长度设置为15 s,在处理高频部分时,时窗长度选择为5 s.时间窗的选择,经过人工处理比对波形确定,确保时间窗长度能够包括一次破裂完整一个周期的波形.滑移窗均以0.5 s为步长滑动.由于使用的是远震数据,无法对震源深度给出约束,破裂深度固定为初始震源深度15 km.我们还尝试了其他,更高的滤波频段,由于波形间的相似程度低,达不到我们要求的相似程度0.7这一阈值,而没有采用.这两个滤波频段在波形图(见图 3)按P波初至到时对齐后,均可以明显看到多次破裂且波形间具有高度相似性.

|
图 3 通过多通道互相关(MCCC)拾取初至P波到时对齐后的波形图 (a)0.2~0.8 Hz;(b)0.01~0.2 Hz. Fig. 3 Waveforms are aligned byMCCC of P onset time |
2005年,Krüger(Krüger and Ohrnberger,2005)提出了基于台阵聚束(Beamforming)技术寻找破裂能量中心相对于震中的位置的方法(Krüger and Ohrnberger,2005).选取一个台站为参考台站,对参考台站波形中每一个滑移窗内的记录段通过网格搜索法来确定其辐射源的位置.将目标研究区域划分成网格,网格上的每一点均视为潜在破裂源位置.选定任一格点i,可以计算出每个台站n的滑移窗相对于当前参考台滑移窗的相对延迟量:

|
(1) |
式中,o代表震源位置,ti,n、ti,ref、to,n、to,ref分别表示从第i个潜在破裂位置到第n个台站和到参考台站的理论走时,以及从震源位置o到第n个台站和参考台的理论走时;tnobs-trefobs为台站n和参考台的观测走时差,如果i点正好位于o点处,那么上式中的理论走时相对残差为0,台站n相对于参考台的延迟量由观测初至走时差决定.
我们选用相位加权叠加(PWS)这种非线性的台阵处理方法,对滑动窗内的波形进行叠加(Schimmel and Paulssen,1997;Rost and Thomas,2002).通过叠加信号的瞬时相位,可以估算波形间的一致性程度.通过在震源区寻找一致性程度最大的位置,来确定此时破裂瞬间能量中心的位置.

|
(2) |

|
(3) |
公式(2)中,由原始信号s(t)作为实部,其对应的希尔伯特变换作为虚部构建新的解析信号S(t).其中A(t)为振幅,Φ(t)为瞬时相位.公式(3)中,Φk(t)为第k个台站的瞬时相位,N为台站数目,v作为指数因子用于调节信号相似及非相似间过渡带的宽度.c(t)的取值在0和1之间,由除去包络后的解析信号叠加构成,用于估计波束组的相似程度.对于大尺度台阵数据,PWS叠加方法相对于倾斜叠加或其他方法,具有更高的精度.该方法对记录波形的形状较波形幅度更为敏感,对于提取幅度较弱但波形形状一致的信号比较有利(Schimmel and Paulssen,1997).
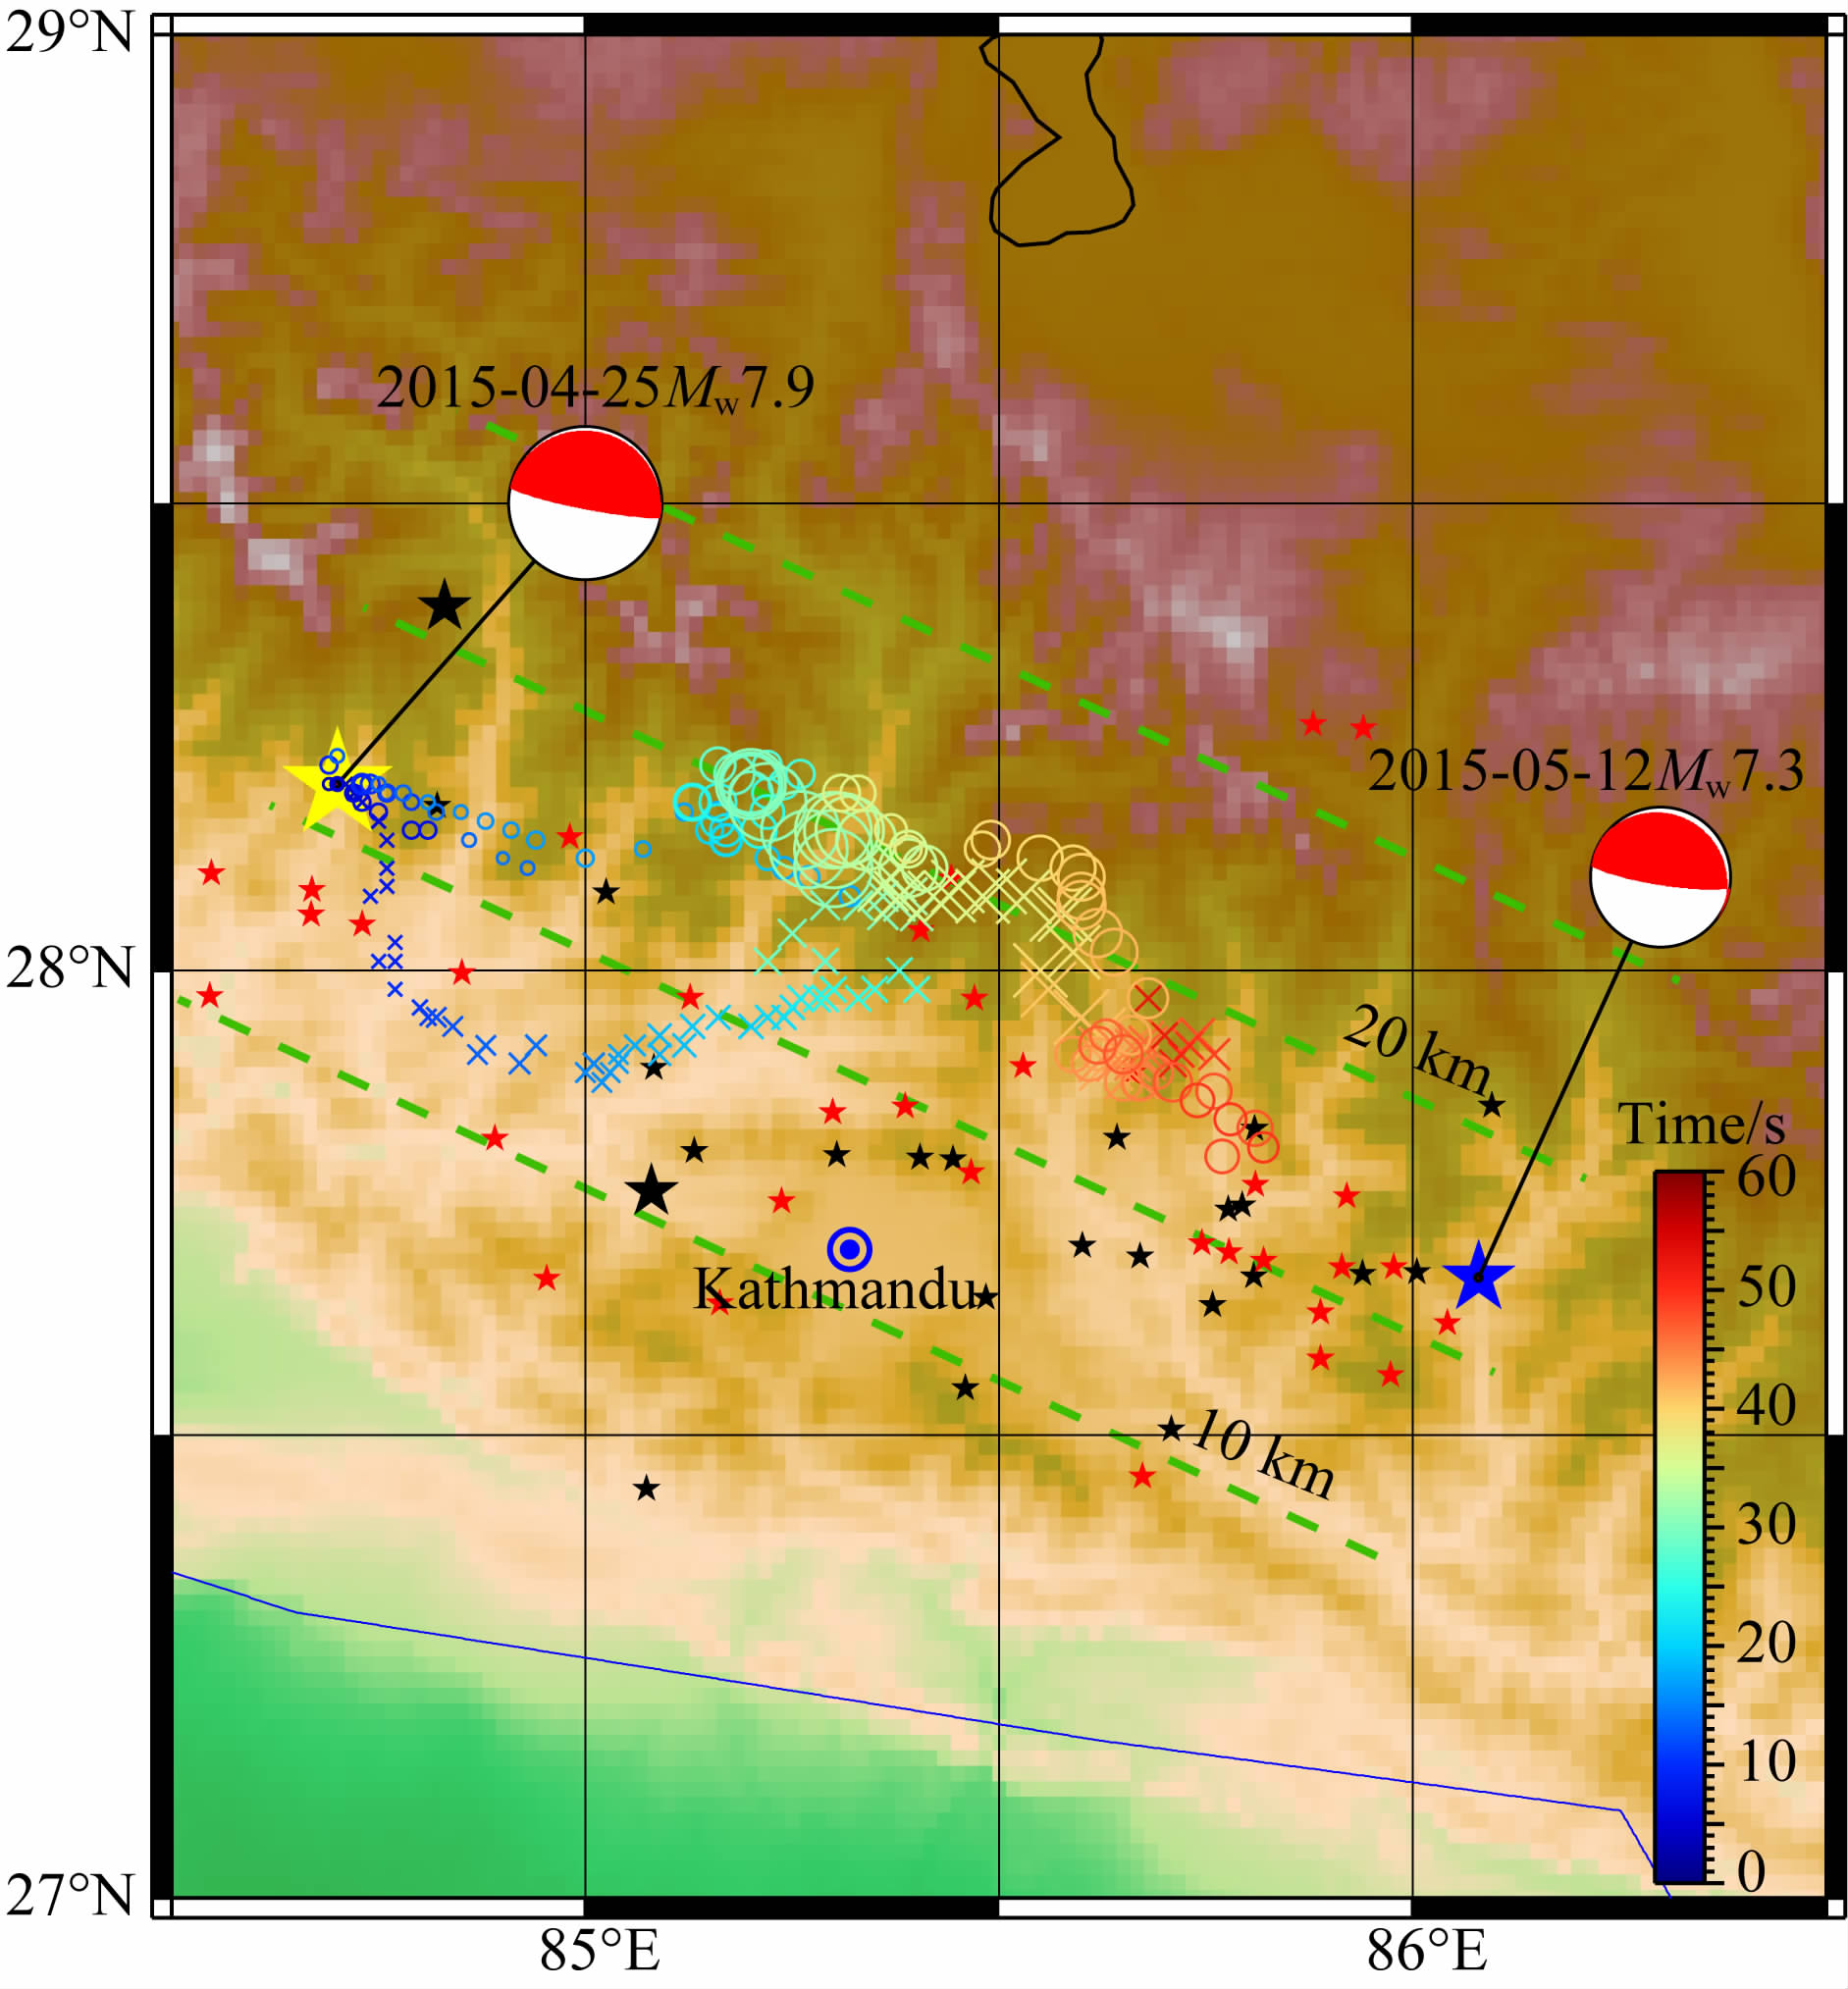
4 结果分析本文应用非线性台阵叠加方法,结合OpenMP并行计算技术,使用欧洲地震台网204个台站的宽频带数字地震资料,对2015年4月25日尼泊尔MW7.9地震的破裂轨迹进行了分频段追踪.经过实际计算我们最终分别得到了该次尼泊尔地震相对低频部分(0.01~0.2 Hz)及相对高频部分(0.2~0.8 Hz)的破裂成像,能量破裂中心随时间迁移的具体结果见图 4.可以看出,此次地震断层错动主要向南东东方向传播,属单侧破裂,破裂时间持续约50 s,破裂尺度达到120 km.在破裂的前半阶段,高频数据定出的能量中心集中在相对深部,低频能量中心则集中在浅部.破裂的后半段,两个频段能量中心的位置趋于一致,均集中在深部.

|
图 4 破裂成像结果.图中黄色五角星为4月25日MW7.9级主震位置,蓝色五角星为5月12日最大的MW7.3级余震位置,黑色五角星为主震发生后2 h内5.0级以上余震位置,红色五角星为主震发生后2 h至24 h内5.0级以上余震发生位置.绿色虚线为MHT断层深度.色标条为破裂时间,单位是s.空心圆圈为高频能量中心的运动轨迹,X为低频能量中心的运动轨迹.符号的大小由线形叠加得到的能量震幅决定(余震目录来源ISC网站,http://isc-mirror.iris.washington.edu/iscbulletin/search/bulletin/,MHT断层等深线数据来源 Galetzka et al.,2015) Fig. 4 The rupture track ofthe Nepal earthquake. Yellow star denotesMW7.9 mainshock location. Blue star denotes MW7.3 largest aftershock location. Black stars showaftershocks above magnitude 5 within 2 hours. Red stars give locations from 2 hours to 1 day after mainshock. Green dash lines show the depths of the Main Himalayan Thrust. Color bar means rupture time. The track from high frequency datais indicated by circles,while the track from low frequency data is indicated by crosses. Symbols size are decided by linear stacking energy′s amplitude.(Aftershocks catalogue get from ISC website: http://isc-mirror.iris.washington.edu/iscbulletin/search/bulletin/.The depth coutoursof the Main Himalayan Thrust fault from Galetzka et al.,2015) |
我们分别使用高频(0.2~0.8 Hz)和低频(0.01~0.2 Hz)资料对破裂方向、尺度、时间及速度等参数进行了对比分析,结果如图 5所示.从中可以看出,此次地震的破裂主要包括三个阶段.第一阶段破裂前20 s主要集中在震中附近释放小部分能量,随后高频结果显示,能量中心在震中以东,震中距20~40 km处发生了跳跃.第二阶段为20~40 s.高频结果显示,20~30 s能量中心在震中以东40~60 km处晃动,表明破裂前锋同时向四周扩散.线性拟合该阶段破裂中心的视速度为1.4 km·s-1.低频结果先向浅部之后再向深部迁移,线形拟合破裂速度为2.8km·s-1.第三阶段40~50 s,破裂继续以2.6 km·s-1的速度向东南方向破裂.可以看出,高频结果中含有更多的细节如能量中心点的跳跃,而低频结果较为连续,测得的传播速度比较可靠.

|
图 5 尼泊尔地震破裂阶段、方向、尺度、时间及速度的估计 横轴为时间,纵轴为破裂尺度,色标代表定位结果相对主震的方位,破裂速度由最小二乘拟合给出.(a)0.2~0.8 Hz;(b)0.01~0.2 Hz. Fig. 5 The stages of the Nepal earthquake′s rupture process and the estmation of rupture direction,duration,length and speed The timing ofenergy center′s positions are plotted against their epicentral distance. The colors denote their azimuths with respect to the epicenter. The rupture speed,i.e. the slop of each rupture segment,get from the least square fitting. |
为了验证上述结果的可靠性,我们通过计算台阵响应函数(ARF)对结果的能量中心定位结果的不确定程度进行了估计,且通过对理论地震波形应用同样的叠加处理,验证了该方法的可靠性.
(1) 台阵响应函数(ARF)
通过计算台阵响应函数(ARF),可以得到台阵或密集地震台网分布对于破裂能量中心定位结果不确定性的影响(Rost and Thoms,2002).

|
(4) |
其中

|
(5) |
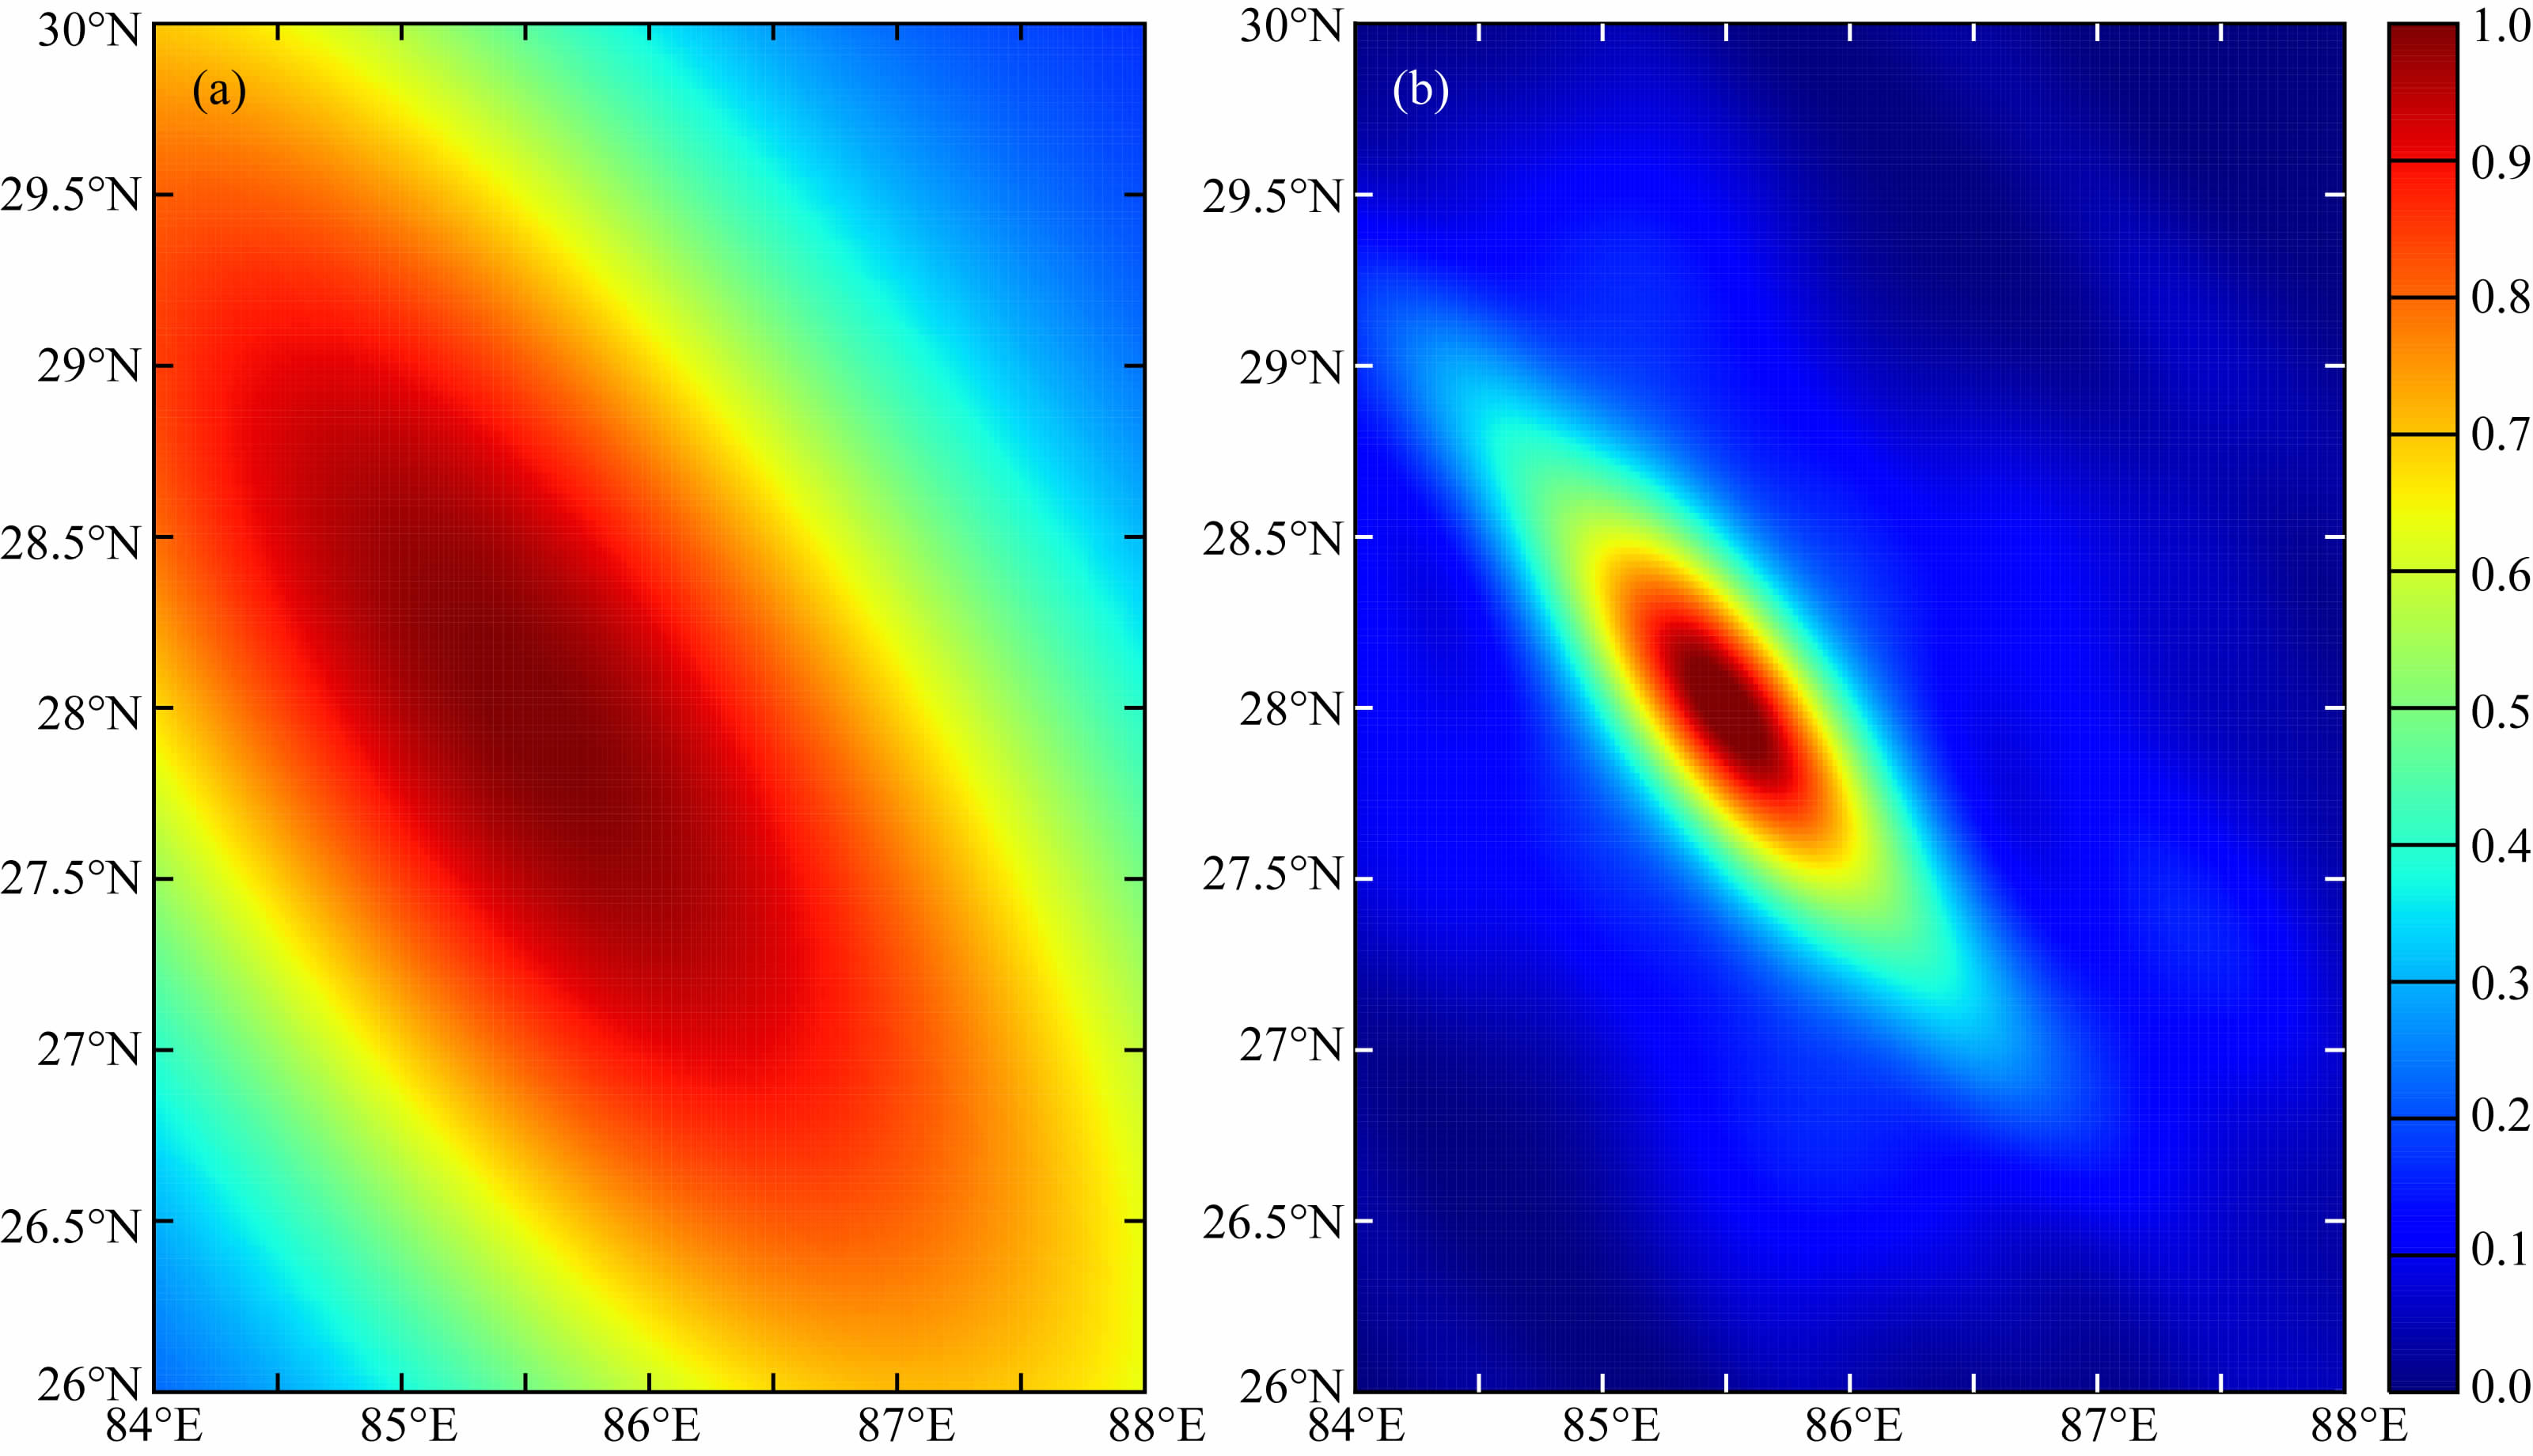
(4)式中,θ,φ为经纬度,h为深度,f为频率,N为台站数量,Δtj(θ,φ,h)为当前瞬时能量中心周边一点到台站j的走时tj(θ,φ,h)与能量中心到台站j的走时tj(energy center)之差.由于选取的台阵尺度很大,入射波为平面波的假设不再适用,这里使用一维球层模型IASPI91(Kennett and Engdahl,1991)来计算走时.将适用于中小尺度台阵的ARF公式推广到大尺度台阵,在空间域中计算(Xu et al.,2009).该公式反映了在某一特定台站分布下,偏离真实的瞬时能量中心位置后对于频率f定位精度衰减的快慢,当Δt为0时,ARF的值等于1.我们以频率0.5 Hz和0.1 Hz为例分别计算了台阵响应函数,见图 6.其定位不确定性的长轴方向取决于所用台网(台阵)相对震中所处的方向.可以看出,对于更长的波长具有更慢的衰减,其定位的不确定性也更大.引入相位加权叠加后,增加对波形相似程度的估计可以有效地降低不确定性,从而对低频能量也可以更好地定位,图 7中展示了在0.01~0.2 Hz频率段追踪结果中,第45 s时间窗对应的波形一致性分布,可以看出不确定范围的缩小.

|
图 6 台阵响应函数(ARF) (a)0.1 Hz;(b)0.5 Hz. Fig. 6 Array response functions |

|
图 7 在0.01~0.2 Hz频率段追踪结果中,参考台第45 s时间窗对应的波形一致性分布图 图中黄色五角星为震中位置,蓝色圆圈为当前能量中心位置. Fig. 7 Waveform semblance map for the time window started from 45 s in the frequency range 0.01~0.2 Hz. Blue circle is the location of energy maximum. Yellow star is epicenter |
(2) 理论地震波形的处理验证
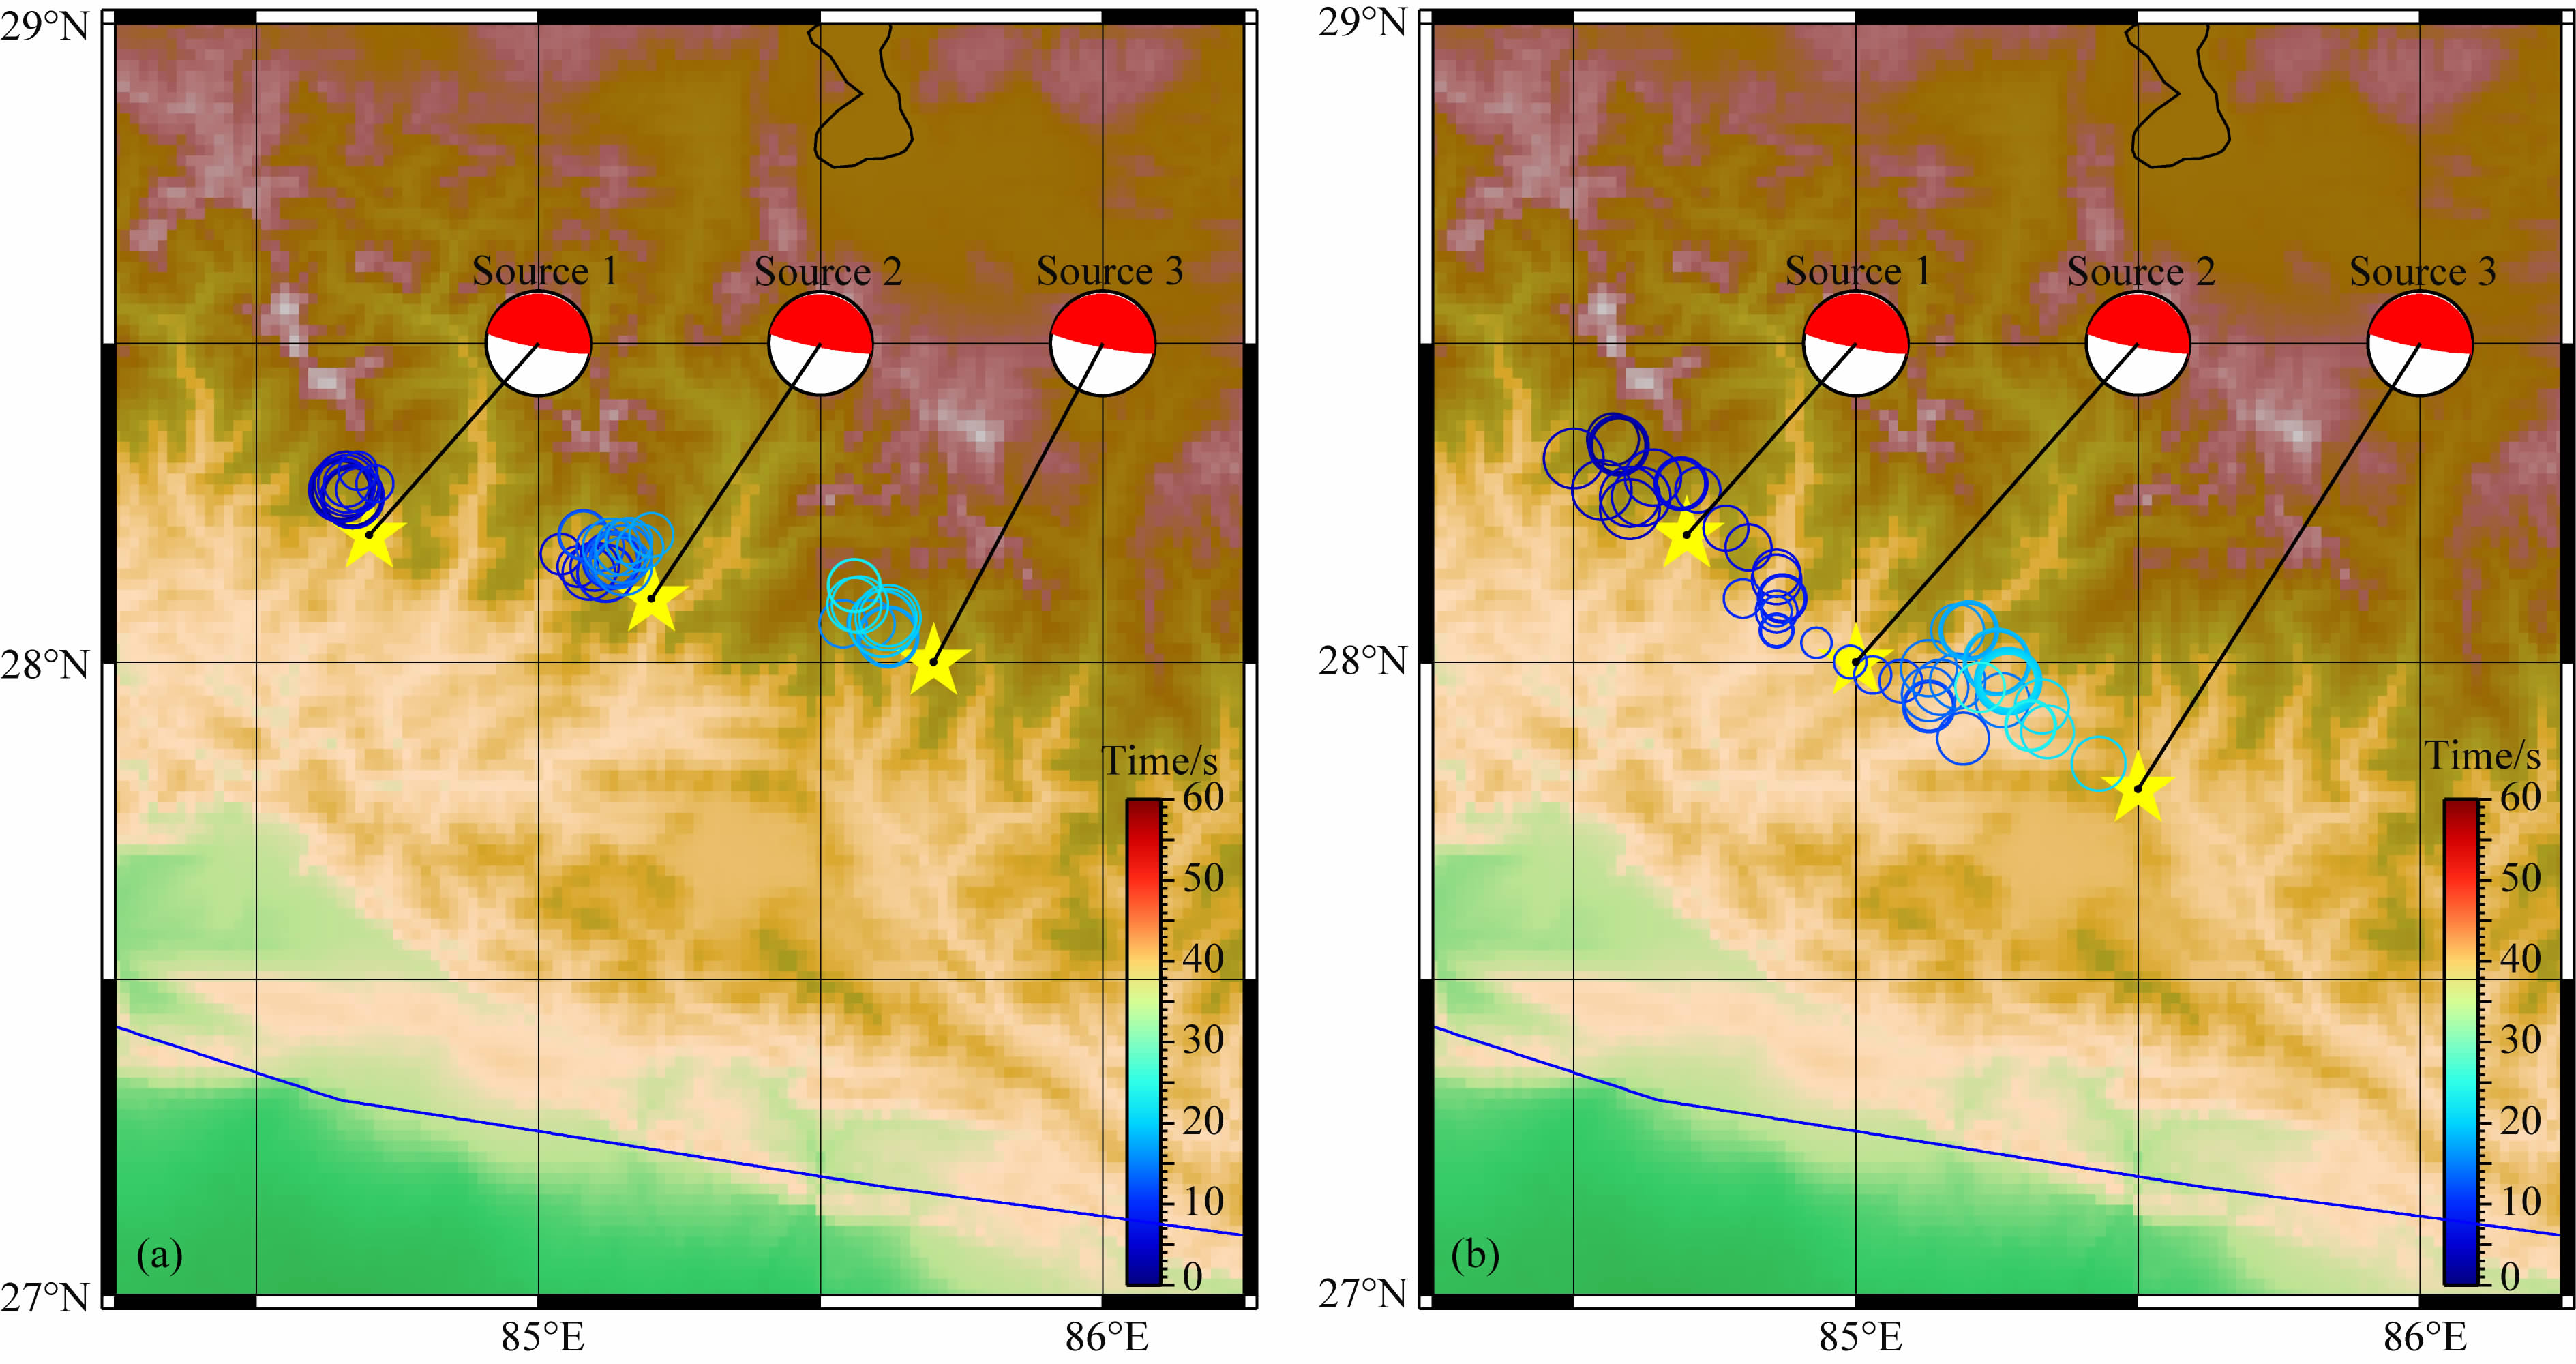
在破裂位置预先给定的情况下,我们通过计算理论地震图(YASEIS程序),由叠加产生的合成地震记录图数据作为输入数据,使用与实际数据相同的叠加处理方法,看计算程序能否恢复事先给定的子事件位置.由于之前的结果得出该次尼泊尔地震以东南向单侧破裂为主,因此在震源区域内沿东南方向预先放置了三个点源,具体位置和震源机制见图 8.第一个点源的发震时间为主震发震时刻,第二个点源的设置为发震后10 s,第三个点源的设置为发震后20 s.使用与实际数据处理同样的台站配置来计算3个子事件的理论地震图波形后相加.得到的定位结果如图 8所示.可以看到,文中使用的方法能够很好地恢复破裂的位置和传播方向.

|
图 8 理论地震图验证(黄色五角星是预先给定的位置,色标条为破裂时间,空心圆圈为我们测定的能量中心随时间的运动轨迹) (a)0.2~0.8 Hz计算理论地震图得到的结果;(b)0.01~0.2 Hz计算理论地震图得到的结果. Fig. 8 Synthetic seismogram test. Yellow stars arepre-set locations. Colorbar means rupture time. Circles indicate the rupture energy center′s spatiotemporal track. (a)Resultsfor 0.2~0.8 Hz;(b)Results for 0.01~0.2 Hz. |
本文利用远震波形非线性聚束方法,得到了该次大地震能量中心的运动轨迹.结果表明该次地震断层错动主要向南东东方向进行,是一次单侧破裂.破裂时间持续约50 s,破裂尺度约120 km,破裂轨迹的终点与1934年MW8.1地震破裂范围的西缘相连(Kumar et al.,2010).这与国内外学者利用不同方法对此次地震主要破裂的判定基本一致(张勇等,2015;刘志鹏和盖增喜,2015;张旭和许力生,2015;Galetzka et al.,2015;Zhang et al.,2016;Tung and Masterlark,2016).使用近场GPS反演得到的破裂模型(Galetzka et al.,2015)的结果显示,大部分滑移发生在MHT深度10~20 km范围的区域内,在破裂后半段滑动区域变得更窄,这与我们得到的能量中心运动轨迹吻合.
对于低频能量中心在破裂后半时段向深部迁移的现象,一种可能是破裂向深部发展,另一种可能是深部和浅部同时破裂且深部破裂强于浅部.使用近场资料以及联合反演结果(Galetzka et al.,2015;Tung and Masterlark,2016)显示在深部存在另一片发生较大滑动的区域,这与我们得到的能量中心向深部迁移的结果相一致.在图 5中沿着我们的轨迹追踪终点继续向东南方向展布的主震发生后2 h及2~24 h内余震位置以及5月13日MW7.3级最大强余震位置,可以证明破裂继续向东南方向迁移的特征.
我们方法仅定位出了破裂能量中心的轨迹,相比之下余震分布在更为广泛的范围.我们得到了破裂沿断层走向的发展尺度,但无法约束破裂沿倾向的展布范围,这可以结合我们的结果与余震分布综合得出,或是通过进一步收集到更多数据后,对断层面上的滑动分布进行反演分析获得.滑移时间窗的选取会对破裂时间的估算造成影响,误差为1/2窗长.当双侧破裂发生时,破裂的瞬时能量中心会在某一固定位置附近晃动,所以这里对于破裂尺度及速度的估计应是真实破裂尺度和速度的下限值.
由于沿着俯冲板块大型逆冲断层其孕震区的压力、温度、沉积物的性质、断层形状、岩性会随着深度发生改变,而这些特性均会对摩擦滑动行为造成影响,因此观测到随着深度辐射频率发生变化也是合理的(Lay et al.,2012).这一现象在多个发生在俯冲带的大地震中均被观测到,特别是对海洋俯冲板块大地震的研究(Koper et al.,2011a;Lay et al.,2012; Yao et al.,2013).我们在此次发生在大陆俯冲板块的尼泊尔地震中也发现了这种现象.另外有学者认为高频能量集中在俯冲板块更深处的现象,可能与孕震区深部塑性块体中小脆性凹凸体的破碎有关(Meng et al.,2011).
本文使用的台阵叠加技术及其他背投影技术,所得到的破裂轨迹直接由远震观测波形叠加得到,不依赖于断层的产状以及矩张量解,处理速度快且结果不唯一性小.另一种获得破裂过程的方法是有限断层反演方法,所得到的滑动分布既要满足对观测波形的拟合,又要有一定光滑和阻尼的约束,因此当不同研究使用不同数据时往往存在不一致(Mai et al.,2016).通过破裂中心的运动轨迹估计得到的破裂速度及持续时间也可做为后续有限断层反演的约束(Lay et al,2010).然而如何进一步将两种方法的优势相结合,还有待于进一步探索.
致谢本文使用的地震数据来自欧洲ORFEUS数据中心,部分图形绘制使用GMT绘图软件,初至到时拾取使用AIMBAT软件(https://seiscode.iris.washington.edu/projects/pysmo-aimbat).理论地震图计算使用YASEIS软件(https://seiscode.iris.washington.edu/projects/yaseis).感谢两位审稿专家对本文提出的修改意见.
| Ader T, Avouac J P, Jing L Z, et al. 2012. Convergence rate across the Nepal Himalaya and interseismic coupling on the Main Himalayan Thrust:Implications for seismic hazard. J. Geophys. Res., 117: B04403. DOI:10.1029/2011JB009071 | |
| Deng Q D, Cheng S P, Ma J, et al. 2014. Seismic activities and earthquake potential in the Tibetan Plateau. Chinese J. Geophys. (in Chinese), 57(7): 2025-2042. DOI:10.6038/cjg20140701 | |
| Du H L, Xu L S, Chen Y T. 2009. Rupture process of the 2008 great Wenchuan earthquake from the analysis of the Alaska-array data. Chinese J. Geophys. (in Chinese), 52(2): 372-378. | |
| Galetzka J, Melgar D, Genrich J F, et al. 2015. Slip pulse and resonance of the Kathmandu basin during the 2015 Gorkha earthquake, Nepal. Science, 349(6252): 1091-1095. DOI:10.1126/science.aac6383 | |
| Ishii M, Shearer P M, Houston H, et al. 2005. Extent, duration and speed of the 2004 Sumatra-Andaman earthquake imaged by the Hi-net array. Nature, 435(7044): 933-936. DOI:10.1038/nature03675 | |
| Kennett B L N, Engdahl E R. 1991. Traveltimes for global earthquake location and phase identification. Geophys. J. Int., 105(2): 429-465. DOI:10.1111/j.1365-246X.1991.tb06724.x | |
| Kiser E, Ishii M. 2011. The 2010 MW8.8 Chile earthquake:triggering on multiple segments and frequency-dependent rupture behavior. Geophys. Res. Lett, 38: L07301. DOI:10.1029/2011GL047140 | |
| Koper K D, Hutko A R, Lay T. 2011a. Along-dip variation of teleseismic short-period radiation from the 11 March 2011 Tohoku earthquake (MW9.0). Geophys. Res. Lett, 38: L21309. DOI:10.1029/2011GL049689 | |
| Koper K D, Hutko A R, Lay T, et al. 2011b. Frequency-dependent rupture process of the 2011 MW9.0 Tohuku Earthquake:comparison of short-period P wave back projection images and broadband seismic rupture models. Earth, Planets and Space, 63(7): 599-602. DOI:10.5047/eps.2011.05.026 | |
| Krüger F, Ohrnberger M. 2005. Tracking the rupture of the MW=9.3 Sumatra earthquake over 1,150 km at teleseismic distance. Nature, 150(7044): 937-939. DOI:10.1038/nature03696 | |
| Kumar S, Wesnousky S G, Jayangondaperumal R, et al. 2010. Paleoseismological evidence of surface faulting along the northeastern Himalayan front, India:Timing, size, and spatial extent of great earthquakes. J. Geophys. Res, 115: B12422. DOI:10.1029/2009JB006789 | |
| Lay T, Ammon C J, Kanamori H, et al. 2010. Teleseismic inversion for rupture process of the 27 February 2010 Chile (MW8.8) earthquake. Geophys. Res. Lett, 37: L13301. DOI:10.1029/2010GL043379 | |
| Lay T, Kanamori H, Ammon C J, et al. 2012. Depth-varying rupture properties of subduction zone megathrust faults. J. Geophys. Res., 117: B04311. DOI:10.1029/2011JB009133 | |
| Liu N, Niu F L, Chen Q F, et al. 2010. Imaging the rupture of the 2010 M8. 8 Chile earthquake with a broadband seismic array. Chinese J. Geophys. (in Chinese), 53(7): 1605-1610. DOI:10.3969/j.issn.0001-5733.2010.07.011 | |
| Liu Z P, Gai Z X. 2015. Rupturing process of the MW7. 9 Nepal earthquake inverted by the multi-array compressive sensing method. Chinese J. Geophys. (in Chinese), 58(6): 1891-1899. DOI:10.6038/cjg20150605 | |
| Lou X T, van der Lee S, Lloyd S. 2013. AIMBAT:A python/matplotlib tool for measuring teleseismic arrival times. Seismol. Res. Lett., 84(1): 85-93. DOI:10.1785/0220120033 | |
| Maercklin N, Festa G, Colombelli S, et al. 2012. Twin ruptures grew to build up the giant 2011 Tohoku, Japan, earthquake. Sci. Rep., 2: 709. DOI:10.1038/srep00709 | |
| Mai P M, Schorlemmer D, Page M, et al. 2016. The Earthquake-Source Inversion Validation (SIV) Project. Seismol. Res. Lett., 87(3): 690-708. DOI:10.1785/0220150231 | |
| Meng L S, Inbal A, Ampuero J P. 2011. A window into the complexity of the dynamic rupture of the 2011 MW9 Tohoku-Oki earthquake. Geophys. Res. Lett., 38: L00G07. DOI:10.1029/2011GL048118 | |
| Meng L S, Ampuero J P, Luo Y D, et al. 2012. Mitigating artifacts in back-projection source imaging with implications for frequency-dependent properties of the Tohoku-Oki earthquake. Earth, Planets and Space, 64(12): 1101-1109. DOI:10.5047/eps.2012.05.010 | |
| Rost S, Thomas C. 2002. Array seismology:Methods and applications. Rev. Geophys., 40(3): 2-1. DOI:10.1029/2000RG000100 | |
| Schimmel M, Paulssen H. 1997. Noise reduction and detection of weak, coherent signals through phase-weighted stacks. Geophys. J. Int., 130(2): 497-505. DOI:10.1111/gji.1997.130.issue-2 | |
| Tung S, Masterlark T. 2016. Coseismic slip distribution of the 2015 MW7. 8 Gorkha, Nepal, earthquake from joint inversion of GPS and InSAR data for slip within a 3-D heterogeneous Domain. J. Geophys. Res.:Solid Earth, 121(5): 3479-3503. DOI:10.1002/2015JB012497 | |
| Wang D, Mori J, Uchide T. 2012. Supershear rupture on multiple faults for the MW8.6 off Northern Sumatra, Indonesia earthquake of April 11, 2012. Geophys. Res. Lett, 2012: L21307. DOI:10.1029/2012GL053622 | |
| Xu Y, Koper K D, Sufri O, et al. 2009. Rupture imaging of the MW7.9 12 May 2008 Wenchuan earthquake from back projection of teleseismic P waves. Geochem. Geophys. Geosyst, 10: Q04006. DOI:10.1029/2008GC002335 | |
| Yagi Y, Nakao A, Kasahara A. 2012. Smooth and rapid slip near the Japan Trench during the 2011 Tohoku-oki earthquake revealed by a hybrid back-projection method. Earth Planet. Sci. Lett., 355-356: 94-101. DOI:10.1016/j.epsl.2012.08.018 | |
| Yao H J, Shearer P M, Gerstoft P. 2013. Compressive sensing of frequency-dependent seismic radiation from subduction zone megathrust ruptures. Proceedings of the National Academy of Sciences of the United States of America, 110(12): 4512-4517. DOI:10.1073/pnas.1212790110 | |
| Zhang H, van der Lee S, Ge Z X. 2016. Multiarray rupture imaging of the devastating 2015 Gorkha, Nepal, earthquake sequence. Geophys. Res. Lett., 43(2): 584-591. DOI:10.1002/2015GL066657 | |
| Zhang X, Xu L S. 2015. Inversion of the apparent source time functions for the rupture process of the Nepal MS8. 1 earthquake. Chinese J. Geophys. (in Chinese), 58(6): 1881-1890. DOI:10.6038/cjg20150604 | |
| Zhang Y, Xu L S, Chen Y T. 2015. Rupture process of the 2015 Nepal MW7. 9 earthquake:Fast inversion and preliminary joint inversion. Chinese J. Geophys. (in Chinese), 58(5): 1804-1811. DOI:10.6038/cjg20150530 | |
| 邓起东, 程绍平, 马冀, 等. 2014. 青藏高原地震活动特征及当前地震活动形势. 地球物理学报, 57(7): 2025–2042. DOI:10.6038/cjg20140701 | |
| 杜海林, 许力生, 陈运泰. 2009. 利用阿拉斯加台阵资料分析2008年汶川大地震的破裂过程. 地球物理学报, 52(2): 372–378. | |
| 刘宁, 钮凤林, 陈棋福, 等. 2010. 地震台阵对2010 M8.8智利地震破裂过程的直接成像. 地球物理学报, 53(7): 1605–1610. DOI:10.3969/j.issn.0001-5733.2010.07.011 | |
| 刘志鹏, 盖增喜. 2015. 利用多台阵压缩传感方法反演尼泊尔MW7.9地震破裂过程.. 地球物理学报, 58(6): 1891–1899. DOI:10.6038/cjg20150605 | |
| 张旭, 许力生. 2015. 利用视震源时间函数反演尼泊尔MS8.1地震破裂过程.. 地球物理学报, 58(6): 1881–1890. DOI:10.6038/cjg20150604 | |
| 张勇, 许力生, 陈运泰. 2015. 2015年尼泊尔MW7. 9地震破裂过程:快速反演与初步联合反演. 地球物理学报, 58(5): 1804–1811. DOI:10.6038/cjg20150530 | |
 2017, Vol. 60


