2. 中国科学院中-法生物矿化与纳米结构联合实验室, 北京 100029;
3. 中国科学院大学地球科学学院, 北京 100049;
4. 岩石圈演化国家重点实验室, 北京 100029;
5. 中国科学院地球与行星物理重点实验室, 北京 100029
2. France-China Biomineralization and Nano-Structure Laboratory, Chinese Academy of Sciences, Beijing 100029, China;
3. School of Earth Sciences, University of Chinese Academy of Sciences, Beijing 100049, China;
4. State Key Laboratory of Lithospheric Evolution, Institute of Geology and Geophysics, Chinese Academy of Sciences, Beijing 100029, China;
5. CAS Key Laboratory of Earth and Planetary Physics, Institute of Geology and Geophysics, Chinese Academy of Sciences, Beijing 100029, China
沉积物和岩石中磁性矿物颗粒的化学成分、粒径、含量、磁性等特征蕴含着丰富的古环境信息和古地磁场信息,准确鉴别岩石和沉积物中磁性矿物的来源和组成特征是环境磁学和古地磁学研究的重要基础.自然样品中磁性矿物的来源复杂,既有经风力搬运、流水搬运的碎屑组分,又有在原地经物理化学作用形成的自生组分.越来越多的研究发现,海洋和湖泊沉积物中存在生物成因的磁性矿物(如化石磁小体)(Petersen et al.,1986; Stolz et al.,1986; 潘永信等,2004; Kopp and Kirschvink,2008; Roberts et al.,2012; Liu et al.,2015).磁小体是由趋磁细菌在细胞体内合成的纳米级(50~120 nm)、 生物膜包被、多呈链状排列的磁铁矿或胶黄铁矿颗粒,细菌死后有机质降解,但这些磁性矿物可在沉积物中保存,成为沉积物磁性信号载体,即化石磁小体.化石磁小体不仅可能记录古地磁场信息,而且是重建古环境甚至是寻找地球早期生命和地外生命的重要研究对象(Hesse,1994; 潘永信等,2004; Kopp and Kirschvink,2008;潘永信和朱日祥,2011;Chang et al.,2012;Liu et al.,2015).岩石磁学方法因其快速、无损、有效等优点,被广泛地应用于确定岩石和沉积物中磁性矿物的成分、粒径、含量等特征(符超峰等,2009; Liu et al.,2012).然而,岩石磁学方法获得的是样品中磁性矿物的总体信号,较难准确区分不同来源的磁性矿物信息,而厘清不同物源磁性矿物所携带的磁学信息对环境磁学和古地磁学研究 均有重要的意义(胡守云等,2001; 夏敦胜等,2006; 张卫国等,2007; 符超峰等,2009;韩玉林等,2010; Liu et al.,2011,2012; Chen et al.,2013; Tang et al.,2015). 例如,对于湖相沉积物,许多情况下都是碎屑和生物成因磁性矿物共存,只有剔除生物成因组分后才能揭示碎屑来源组分信息(Hatfield and Masher,2009).另一方面,定量估计样品中生物成因磁性矿物有助于评价古地磁记录的可靠性(Heslop et al.,2013).透射电镜显微学方法能够提供磁性矿物的超微观结构、形貌、晶体成分等信息,因此是鉴别化石磁小体不可或缺的手段(李金华和潘永信,2015).在过去三十年中,通过透射电子显微镜和岩石磁学方法,前人对纳米尺度的(化石)磁小体进行了研究,使人们对(化石)磁小体的微观结构、形貌、晶体特征、生长拉长方向都有了深入的认 识(Stolz et al.,1986; Mann et al.,1984,1987; Hesse,1994; Isambert et al.,2007; Schumann et al.,2008; Kopp and Kirschvink,2008; Chang et al.,2012;Li et al.,2010,2015; Liu et al.,2015).
本文将结合透射电子显微学和岩石磁学两种方法对密云水库沉积物的磁性矿物进行研究.我们首先对沉积物中的磁性矿物进行磁选,然后对磁选前、磁选物和磁选后的残余样品进行系统的岩石磁学分析,同时对磁选获得的磁性矿物进行透射电子显微镜学分析,并通过对比磁选前后样品的磁学参数和透射电镜分析结果评估了所建立磁选方法的效率.
2 材料与方法研究样品取自北京市密云水库的表层沉积物(0~20 cm).密云水库流域由潮河、白河两大水系组成,西北部流域基岩主要为燕山期的花岗岩和二长花岗岩,而东部流域多低山、丘陵,基岩以太古宇的麻粒岩相变质岩为主.前人已在该水库沉积物中发现了多种不同类型的趋磁细菌(Lin et al.,2009),暗示密云水库沉积物中可能有(化石)磁小体.因此,密云水库表层沉积物中的磁性矿物来源复杂,既可能有碎屑成因、自生成因,还可能有生物成因.
2.1 样品磁选处理方法将沉积物样品在厌氧条件下自然风干,然后进行如下处理:(1) 研磨:将沉积物样品研磨至200目(~70 μm);(2) 原样岩石磁学测量:称取0.5 g研磨样品8份,8份原样分别记作MYbn(n=1~8),并分别用塑料薄膜包好装入2 cm×2 cm×2 cm无磁塑料盒中进行岩石磁学测量;(3) 水溶液分散: 将岩石磁学测量后的8个原样分别倒入8个500 mL 烧杯中,加入250 mL蒸馏水,用无磁性玻璃棒充分搅拌;(4) 超声分散:将装有样品的烧杯放入超声波清洗机(40 kHz,200 W)中超声20 min(清洗机中加入足量冰块,防止超声过程中样品受热氧化),超声分散过程中继续用玻璃棒不断搅拌;(5) 静置磁选:将装有钕铁硼强磁铁(圆片状,直径24 mm,高度4 mm,中心磁场强度约200 mT,边缘磁场强度约270 mT)的塑料管放入超声分散处理后的样品中静置10~12 h;(6) 纯化富集:将吸附在塑料管表面的颗粒用蒸馏水冲洗在50 mL烧杯中,缩短静置时间至10 min 再重复收集5次;(7) 离心收集:将50 mL烧杯中的溶液转移到1 mL离心管中,在8000 r·min-1速度下离心2 min,收集离心管下部的沉淀物(磁选物)并在厌氧箱中自然风干后称重,磁选物分别对应地记做MYen(n=1~8).磁选后剩下的残余物全部收集并在厌氧箱中自然风干并称重,残余物分别对应记为MYrn(n=1~8).最后将磁选物和残余物样品作岩石磁学测量和透射电子显微镜观察.
2.2 磁学测量磁化率()测量由卡帕桥多频磁力仪(AGICO MFK1-FA)完成,使用的测量频率为976 Hz和15616 Hz,施加的磁场强度为200 A·m-1.频率磁化率百分数(fd%)定义为:Χfd% =(lf -Χhf)/Χlf ×100%,式中Χlf为低频磁化率,Χhf为高频磁化率.超顺磁(SP)/单畴(SD)临界点(25 nm)附近的颗粒对频率磁化率百分数的影响最大,因此频率磁化率百分数主要反映了25 nm左右粒径颗粒的贡献(Thompson and Oldfield,1986).
磁化率随温度变化曲线(κ-T)由卡帕桥多频磁力仪(AGICO MFK1-FA)完成.测量所加的磁场强度为200 A·m-1,频率为976 Hz,测量温度区间为25~700 ℃,温度变化率约为12 ℃/min,所有测量均在氩气环境中进行.通过κ-T曲线可判断样品中磁性矿物的种类、粒径等信息(Deng et al.,2001).
磁滞回线、反向场退磁曲线、等温剩磁获得曲线和一阶反转曲线(FORC)均通过MicroMag 3900振动样品磁力仪测量完成,该仪器灵敏度为5×10⁻¹⁰Am2. 通过磁滞回线、反向场退磁曲线的测量可得到矫顽力(Bc)、剩磁矫顽力(Bcr)、饱和磁化强度(Ms)和饱和等温剩磁(Mrs)等磁学参数.FORC测量使用的饱和磁场强度为1 T,步长(δH)为1.31 mT,测量条数为150条(Roberts et al.,2000).采用FORCme软件对FORC测量数据进行 处理,并可得到95%的置信区间(Heslop and Roberts,2012).
2.3 透射电子显微镜观察透射电子显微学分析由JEM-2100HR型透射电子显微镜完成,该仪器的电子发射源为六硼化镧,最大加速电压为200 kV,点分辨率为0.23 nm,线分辨率为0.14 nm.该透射电镜还装配有Oxford X-MAX能量色散谱仪(EDS),允许对样品进行微观形貌电镜观测的同时进行化学成分分析.透射电子显微镜观察样品为磁选后的样品MYe1-MYe8.
3 结果 3.1 κ-T曲线图 1为样品MY8的κ-T曲线.原样样品MYb8(图 1a)和残余物样品MYr8(图 1c)的升温曲线显示磁化率从室温逐渐升高至285 ℃和265 ℃,这可能是样品中的细颗粒(SP/SD)磁性矿物受热逐渐解阻所致(Deng et al.,2005).随后磁化率稳步降低到400~450 ℃,这通常被认为是亚稳态的磁赤铁矿分解为赤铁矿的信号(Stacey and Banerjee,1974; Deng et al.,2001).随后磁化率急剧升高,530~ 555 ℃左右出现明显的峰值,该温度段(450~550 ℃)磁化率随温度的变化受样品中含铁盐/粘土矿物受热分解以及磁性颗粒解阻效应的双重影响.在580 ℃附近磁化率急剧下降,指示样品的载磁矿物为磁铁矿.磁选物样品MYe8(图 1b)的升温曲线显示磁化率从室温逐渐升高至285 ℃,随后稳步降低到400 ℃附近,与样品MYb8和MYr8的变化趋势一致.随 后磁化率逐渐升高至580 ℃附近急剧下降,在600 ℃ 附近接近零.磁选物样品MYe8的升温曲线中,在400~580 ℃的变化主要由磁性矿物的受热解阻导致,显示出明显的Hopkinson峰,说明主要的磁性矿物为磁铁矿.MYb8、MYe8、MYr8(图 1(a—c))降温曲线均显示加热后样品中磁铁矿占主导,证明加热过程中有磁铁矿生成.

|
图 1 密云水库沉积物代表样品磁化率(κ)随温度(T)变化曲线 实线(虚线)为样品的升温(降温)曲线,MYb8、MYe8和MYr8分别为第8号样品的原样、磁选物和残余物. Fig. 1 Temperature-dependence of magnetic susceptibility of representative samples of Miyun Lake Solid(dashed)lines represent heating(cooling)cycles,MYb8,MYe8 and MYr8 represent the No.8 bulk sample,extract and residue,respectively. |
图 2a—2f显示沉积物原样(如MYb1、MYb8)和磁选物样品(如MYe1、MYe8)的磁滞回线均在接近300 mT时闭合,矫顽力为9~10 mT;残余物样品(如MYr1、MYr8)的磁滞回线在接近500 mT时闭合,矫顽力为13~16 mT.说明残余物样品中硬磁组分含量比原样和磁选物高,但所有样品均以软磁性矿物为主.表 1为MYb(原样)、MYe(磁选物)以 及MYr(残余物)的主要岩石磁学参数数据.从表中 数据看,磁选物样品的Bc和Bcr均比原样和残余物 样品小(同号样品比较),磁选物的Ms和Mrs接近于原样样品,而残余物的Ms和Mrs远远小于原样样品.Mrs/Ms和Bcr/Bc这两个比值对各种磁畴状态和磁性矿物浓度(磁相互作用)反应灵敏,因此可用来指示磁性矿物的粒径或浓度变化(Day et al.,1977; Dunlop,2002a,2002b; Li et al.,2012).Day图(图 2g—2h)显示原样和磁选样品中磁性矿物以假单畴(PSD)为主,磁选物与原样相似,而残余物的投点位置则更接近SD区域.

|
图 2 密云水库沉积物代表样品的磁滞回线及Day图 a)—(f)顺磁校正后的磁滞回线,实验中最大加场为1T,图中原样和磁选物展示,残余物展示 ;(g)—(h)所有样品的Day-plot投图结果(样品见表一),其中(h)为(g)的局部放大图,(h)图例参考(g); MYb1(MYb8),MYe1(MYe8)和MYr1(MYr8)分别为第1(8)号样品的原样、磁选物和残余物. Fig. 2 The hysteresis loops and Day-plot of representative samples of Miyun Lake (a)—(f)Hysteresis loops after paramagnetic adjustment,the top magnetic field in measurement is 1T;(g)—(h)Day-plot for all samples(see Table 1),(h)is partial enlarged image of(g),the legend of(g)and(h)are same. MYb1(MYb8)、MYe1(MYe8)and MYr1(MYr8) represent No.1(8)bulk sample,extract and residue. |
|
|
表 1 密云水库沉积物磁选样品的岩石磁学数据 Table 1 Rock magnetism parameters of magnetically extracted samples of Miyun Lake |
另外,表 1中数据显示原样(MYb)和磁选物(MYe)的Χfd%值比较接近,而残余物(MYr)的Χfd%值相对更大,说明原样和磁选物样品中SP/SD磁性颗粒含量接近,而残余物样品中SP/SD磁性颗粒含量更多,与Day图指示的信息一致.
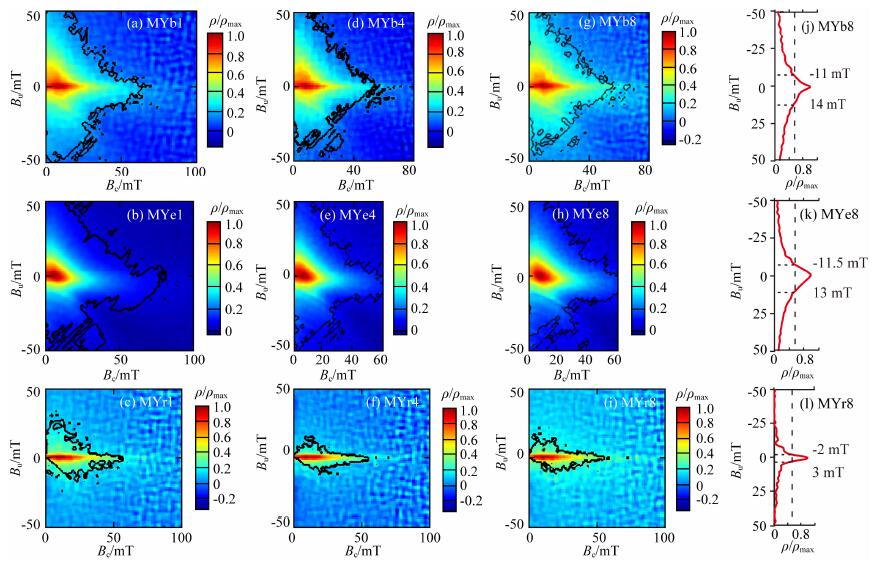
3.3 FORC图图 3a—3i为MY1、MY4、MY8样品的一阶反转曲线(FORC)图,FORC图的横纵坐标分别代表磁性矿物的矫顽力(Bc)和磁相互作用力(Bu).图中显示,原样(MYb1、MYb4、MYb8)与磁选样品(MYe1、MYe4、MYe8)的峰值矫顽力约为10 mT,在中间存在闭合的等值线(单畴颗粒特征),外围存在不闭合的大开口等值线(多磁畴颗粒特征),指示原样样品与磁选样品的磁性颗粒整体上表现出单磁畴(SD)与多磁畴(MD)颗粒混合的特征(Pike et al.,1999;Roberts et al.,2000).残余物样品(MYr1、MYr4、MYr8)的FORC图显示为闭合的等值线,矫顽力峰值约为12 mT,中央区域的矫顽力较原样和磁选物分布更宽且磁相互作用力更小,指示SD颗 粒的存在(Egli et al.,2010;Li et al.,2012).图 3j-3l 为样品MY8的磁相互作用力分布图,原样样品(MYb8)、磁选样品(MYe8)、残余物样品(MYr8)相互作用力最大强度的50%分布范围分别为为[-11mT,14mT]、[-11.5mT,13mT]、[-2mT、3mT],说明残余物样品(MYr)的磁相互作用力最小,磁选物样品(MYe)的磁相互作用力略小于原样样品(MYb)的磁相互作用力.

|
图 3 密云水库沉积物代表样品的一阶反转曲线 (a)—(f)FORC图(图中加粗实线代表 95%置信区间),FORC图处理过程中平滑因子(SF)均为3;(j)、(k)、(l)分别为(g)、(h)、(i)等值线中心处沿纵轴的磁相互作用力分布图;MYbn、MYen和MYrn分别为第n号样品的原样、磁选物和残余物. Fig. 3 FORC diagrams of representative sample of Miyun Lake (a)—(f)FORC diagrams(the thick contour lines indicate the regions of the FORC distribution that are significant at the 0.05),the smoothing factor are 3;(j)、(k)、(l)represent magnetostatic interactions distribution of(g)、(h)、(i),respectively.MYbn,MYen and MYrn represent No.n bulk sample,extract and residue. |
利用累积对数高斯模型(Robertson and France,1994; Stockhausen,1998; Kruiver et al.,2001)对样品的等温剩磁获得曲线(IRM)进行矫顽力谱分析,可得到样品中磁性矿物的不同矫顽力组分.一般将B1/2作为衡量矫顽力大小的参数(Kruiver et al.,2001),B1/2为每种组分的饱和等温剩磁(SIRM)获得一半时外场的大小,理论上与剩磁矫顽力(Bcr)相等.根据不同矫顽力组分的饱和等温剩磁大小,还可以定量地计算不同矫顽力组分的百分含量.图 4a—4c表明,原样、磁选物与残余物中的矫顽力均可分解成低(<20 mT)、中(约60 mT)、高(>600 mT)三种组分.图 4d展示了所有样品不同矫顽力组分的平均百分含量,原样样品的低、中、高三种矫顽力组分的百分含量为13.7%、82.9%、3.4%,磁选物样品低、中、高三种矫顽力组分的百分含量为16.9%、82.5%、0.6%,残余物样品低、中、高三种矫顽力组分的百分含量为9.6%、81.8%、8.6%.磁选物与原样不同矫顽力组分之间的比例十分接近,说明磁选物具有较理想的代表性(详见下文讨论部分).原样样品中高矫顽力组分(631 mT)可能为赤铁矿.

|
图 4 密云水库沉积物样品矫顽力谱分析结果 (a)—(c)IRM获得曲线及其分解曲线;(d)所有原样、磁选物以及残余物样品不同矫顽力组分的百分含量统计结果.MYb8、MYe8和MYr8分别为第8号样品的原样、磁选物和残余物. Fig. 4 Isothermal remanent magnetization(IRM)acquisition curves and gradient of acquisition plots(GAD)of representative sample from Miyun Lake (a)—(c)Isothermal remanent magnetization acquisition curves and gradient of acquisition plots;(d)The percent result of different coercivity components of all samples. MYb8,MYe8 and MYr8 represent No.8 bulk sample,extract and residue. |
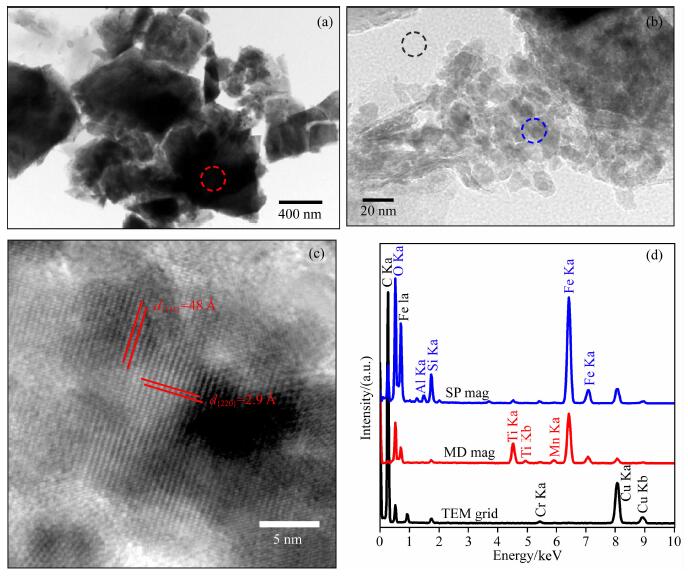
图 5为磁选物MYe8的透射电子显微镜照片及X-射线能谱图(EDS,Energy Dispersive Spectra).图 5a中的矿物呈棱角状、大小混杂、粒径0.4~1 μm,图 5d显示其主要组成元素为Fe、O、Ti,再结合κ-T曲线信息,可判断图 5a中的矿物是碎屑成因的MD钛磁铁矿,很可能为流域附近的火山碎屑钛磁铁矿经河流搬运至密云水库中沉积下来的.图 5b中的矿物粒径较小,约为5~20 nm,图 5d指示其主要组成元素为Fe和O,再结合图 5c计算出的晶面间距参数,可判断图 5b中的矿物为SP磁铁矿.另外,图 5d指示图 5b中的矿物含有Si、Al等元素,证明这种SP磁铁矿很可能是沉积物中的含铁硅酸盐/粘土矿物(如绿泥石)经过化学作用、生物作用和生物化学作用形成.图 5、6表明磁选物中包含有SP、SD、MD等不同粒径范围的磁铁矿,且X-射线能谱图揭示了磁性矿物的元素信息,为研究磁性矿物的物源、赋存状态提供了线索.

|
图 5 密云水库沉积物磁选样品MYe8的透射电镜照片及X-射线能谱图 (a)碎屑状MD磁铁矿晶体;(b)自生SP磁铁矿晶体;(c)为(b)的局部放大图,(c)中的平行线代表晶面间距,(d)中的蓝色曲线为(b)中蓝色虚线圆圈采点处的能谱结果、红色曲线为(a)中红色虚线圆圈采点处的能谱结果、 黑色曲线代表(b)中黑色虚线圆圈采点处的能谱结果(铜网,背景值). Fig. 5 Transmission electron microscopy(TEM)analyses and X-ray energy dispersive spectra(EDS)of the extract MYe8 (a)Detrital MD magnetite;(b)Authigenic SP magnetite;(c)Enlarged image of(b);(d)EDS results of selected areas in(a)and(b). Blue,red,and black curve in(d)represents the X-ray EDS of the area indicated by the blue,red,and black dashed circles in (a)and(b). Note the black curve in(d)from copper grid. |
磁选物是否具有代表性可从磁选物中磁性矿物 的总量、成分、粒径及其分布等方面来考量.Hounslow和Maher(1996)将磁选物中磁性矿物总量占原样的百分比用参数Eff(efficiency)表达.EffMs、EffSUS、EffSIRM分别代表磁选物的饱和磁化强度(Ms)、磁化率(susceptibility)以及饱和等温剩磁(SIRM)占原样的百分比.如:EffMs=Ms(磁选物)/Ms(原样)×100%.本文将残余物中磁性矿物总量占原样的百分比也用该参数表示.计算参数Eff均不需质量归一化,即计算时Ms和SIRM的单位是Am2,磁化率为体积磁化率(单位是1).Ms可以衡量磁选物/残余物中磁性矿物的总含量.而磁化率不但与磁性矿物的类型和含量相关,还与磁性颗粒的粒径、测量的温度和频率相关(刘青松和邓成龙,2009),本实验均在常温(25 ℃)测量,且EffSUS采用低频磁化率(lf,976 Hz)计算,因此本实验参数EffSUS的主要影响因素为磁性矿物类型和粒径.饱和等温剩磁(SIRM)反映的是磁性矿物的剩磁强度,因此EffSIRM参数表达的是磁选物/残余物中除SP颗粒外其他磁性矿物的含量百分比.
从表 2可得,磁选物的质量百分比(M%)为1.78%±0.30%,而其EffMs、EffSUS、EffSIRM分别为 84.75%±2.21%、75.90%±4.71%、72.21%±4.26%(n=8).说明:1)原样中约85%的磁性矿物被磁选 出来,且得到很大程度上的纯化(饱和磁化强度质量 归一化后,磁选物约为原样的43倍).2)磁选物EffSUS、EffSIRM值比EffMs低,很可能是粒径因素引起,从磁滞参数和FORC图看,残余物中含有更高比例的细颗粒(SP和SD),即相对于MD颗粒,磁选物丢失了更多的SD和SP颗粒.而相对于MD颗粒,SP颗粒具有更高的磁化率,SD颗粒具有更稳定的携带剩磁能力,因此磁选物EffSUS、EffSIRM值比EffMs低.
|
|
表 2 密云水库沉积物样品磁选效率参数值 Table 2 Parameters of magnetic extraction efficiency for surface sediments of Miyun Lake |
κ-T曲线中的Hopkinson峰以及最大解阻温度指示原样和磁选物中的主要载磁矿物为磁铁矿,透射电镜观察也表明磁选物中的磁性矿物主要为碎屑成因的(钛)磁铁矿以及少量生物成因的SD磁铁矿(见图 6)和自生成因的SP磁铁矿,说明原样样品和磁选物样品在成分信息上具有一致性.从Day图、Χfd%、FORC图等可以反映磁性矿物粒径的结果来看,磁选物与原样中的磁铁矿为SD和MD颗粒,再结合矫顽力谱分析结果来看,磁选物与原样不同粒 径组分的百分含量相当.因此,从成分、粒径和含量等信息来看,磁选物中磁性颗粒的信息可以代表原 样磁性矿物的信息,说明本磁选方法对密云水库表层沉积物中磁性矿物的分离富集是有效的.

|
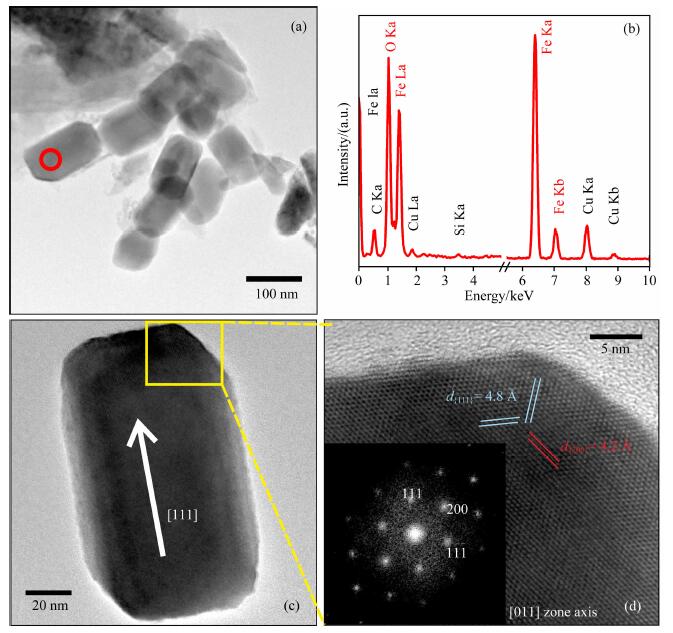
图 6 密云水库沉积物磁选样品MYe8中化石磁小体TEM照片及X射线能谱图 (a)链状排列的化石磁小体;(b)为(a)中红色圆圈采点处的能谱结果;(c)棱柱形磁小体,沿[111]晶轴拉长;(d)为(c)的局部放大图,(d)图左下角为晶体的傅里叶变换. Fig. 6 Transmission electron microscopy(TEM)analyses and X-ray energy dispersive spectra(EDS) of magnetofossils in sample MYe8 (a)Chain-arranged structure of magnetofossils;(b)EDS of the area indicated by the red circle in(a);(c)High resolution TEM image of a typical prismatic magnetite recorded from [011] zone axis,and the Fast Fourier Transform(FFT)pattern indicate that this particle is elongated along the [111] direction of magnetite;(d)Enlarged image of(c). The image at the left bottom of(d) is FFT of the magnetite crystal. |
另外,FORC图和矫顽力谱分析结果显示残余物中含有SD颗粒磁铁矿和高矫顽力弱磁性矿物(可能为赤铁矿).部分SD颗粒磁铁矿很可能是在其形成过程中被含铁硅酸盐/粘土矿物包裹,所以没有被磁选出来.另外,由于该磁选方法对弱磁性矿物(如赤铁矿、针铁矿)效果不理想,所以当原样中主要的载磁矿物为赤铁矿或针铁矿等弱磁性矿物时,本磁选方法获得的磁选物可能难以代表原样信息.
比较而言,本研究建立的磁选流程耗时较短,而Hounslow和Maher(1996)的实验流程需耗时7天,且他们实验的EffSUS值主要在20%~60%范围,只有极少样品能达到75%,EffSIRM值为60%~80%. 另外,本磁选方法不需添加醋酸等物质溶解样品中的碳酸盐(Sun and Jackson,1994;Hounslow and Maher,1996),避免了细小铁氧化物的溶解.但是,我们的方法对于其他类型沉积物和沉积岩的实用性和效率值得今后进一步对比研究.
4.2 化石磁小体的识别问题由于碎屑来源磁性矿物的混合,沉积物中化石磁小体的识别往往比较困难.FORC图是目前判别化石磁小体是否存在最有效的岩石磁学手段之一,一般将磁相互作用力微弱且等值线主要沿中央脊展 布的FORC图认为是化石磁小体存在的标志(Egli et al.,2010; Kind et al.,2011; Roberts et al.,2011,2012).但是,FORC图的这种展布特征并不为化石磁小体所特有,相互作用力微弱的非生物成因的SD磁铁矿也可能呈现出相似特征(Su et al.,2013;Wang et al.,2013).另外,磁小体链的坍塌聚集也可能产生相互作用力较大的FORC分布(Li et al.,2012).因此,仅仅依据FORC图的形态还无法断定样品中是否存在化石磁小体,还必须结合透射电子显微学方法对样品中的磁性矿物进行进一步的确认(Li et al.,2013).图 6a中的矿物颗粒尺寸均一(约120 nm)、棱柱状且成链状排列,图 6b显示其组成元素为Fe和O,图 6c指示其晶体沿其[111]晶轴拉长,图 6d的晶面间距参数以及傅里叶变化均指示矿物为磁铁矿,上述信息指示图 6中的矿物为生物成因的SD磁铁矿(化石磁小体)(Pósfai,2007;Li et al.,2013;Liu et al.,2015).然而,透射电子显微学方法的缺点是耗时和昂贵,如果对大量样品进行观察,成本会非常高.如果先对样品进行系统的岩石磁学工作,再结合磁学信息对样品进行有针对性的透射电子显微学观察,往往可以取得较好的效果.化石磁小体的低含量以及磁小体链的断裂、坍塌、部分氧化等因素,都可能会导致其磁学特征信息不明显,磁选和透射电子显微学工作(如图 6)则有助于识别化石磁小体.如何实现沉积物中化石磁小体的快速和准确定量分析仍然具有挑战性,值得进一步研究.需要指出,海洋中化石磁小体对沉积物磁性贡献大小比湖泊沉积物可能更为重要.以上研究表明,磁选、岩石磁学和透射电子显微学方法的联用可以更好地揭示样品中磁性矿物的成分、含量、粒径甚至是物源等信息.
5 结论(1) 本实验建立的磁选方法可将密云水库表层沉积物中约70%~85%的磁性矿物分离出来,达到了很好的富集纯化效果.岩石磁学数据证明磁选物与原样的成分、粒径、含量等特征非常一致,说明该磁选方法有效,获得的磁选物可以代表原样的磁性矿物信息.
(2) 岩石磁学结果表明,密云水库表层沉积物中的主要磁性矿物为单畴和多畴磁铁矿.
(3) 透射电子显微学结果表明,沉积物中含有不规则形状、微米尺寸、碎屑成因的(钛)磁铁矿,棱柱状、纳米尺寸、化学纯度高的化石磁小体,以及自生成因的超顺磁颗粒磁铁矿.研究表明,岩石磁学和透射电子显微学方法的联用可以更好地揭示磁性矿物的物源信息以及赋存状态,从而为环境磁学和古地磁学研究提供更为详细、准确的基础信息.
致谢感谢Greig A. Paterson、张春霞、刘素贞和谷立新等的有益讨论.感谢两位匿名审稿专家提出的宝贵修改建议.
| Chang L, Roberts A P, Williams W, et al. 2012. Giant magnetofossils and hyperthermal events. Earth &Planetary Science Letters , 351-352: 258–269. | |
| Chen F H, Liu J B, Xu Q H, et al. 2013. Environmental magnetic studies of sediment cores from Gonghai Lake:implications for monsoon evolution in North China during the late glacial and Holocene. Journal of Paleolimnology , 49(3): 447–464. | |
| Day R, Fuller M, Schmidt V A. 1977. Hysteresis properties of titanomagnetites:Grain-size and compositional dependence. Physics of the Earth &Planetary Interiors , 13(4): 260–267. | |
| Deng C L, Zhu R X, Jackson M J, et al. 2001. Variability of the temperature-dependent susceptibility of the Holocene eolian deposits in the Chinese loess plateau:A pedogenesis indicator. Physics and Chemistry of the Earth, Part A , 26(11-12): 873–878. | |
| Deng C L, Vidic N J, Verosub K L, et al. 2005. Mineral magnetic variation of the Jiaodao Chinese loess/paleosol sequence and itsbearing on long-term climatic variability. J. Geophys. Res. , 110: B03103. doi: 10.1029/2004JB003451. | |
| Dunlop D J. 2002a. Theory and application of the Day plot (Mrs/Msversus Hcr/Hc) 1. Theoretical curves and tests using titanomagnetite data. Journal of Geophysical Research Solid Earth , 107(B3): EPM 4-1–EPM 4-22. | |
| Dunlop D J. 2002b. Theory and application of the Day plot (Mrs/Ms versus Hcr/Hc) 2. Application to data for rocks, sediments, and soils. Journal of Geophysical Research Solid Earth , 107(B3): EPM 5-1–EPM 5-15. | |
| Egli R, Chen A P, Winklhofer M, et al. 2010. Detection of noninteracting single domain particles using first-order reversal curve diagrams. Geochemistry, Geophysics, Geosystems , 11: Q01Z11. | |
| Fu C F, Song Y G, Qiang X K, et al. 2009. Environmental magnetism and its application progress in Paleoclimatic and Paleoenvironmental changes. Journal of Earth Sciences and Environment (in Chinese) , 31(3): 312–322. | |
| Han Y L, Tan X D, Chen Z, et al. 2010. Magnetic granulometry of recent sediments from the Huguang Maar and its implication for provenience. Chinese Science Bulletin , 55(4): 418–424. | |
| Hatfield R G, Maher B A. 2009. Fingerprinting upland sediment sources:particle size-specific magnetic linkages between soils, lake sediments and suspended sediments. Earth Surface Processes &Landforms , 34(10): 1359–1373. | |
| Heslop D, Roberts A P. 2012. Estimation of significance levels and confidence intervals for first-order reversal curve distributions. Geochemistry, Geophysics, Geosystems , 13(5): Q12Z40. | |
| Heslop D, Roberts A P, Liao C, et al. 2013. Quantifying magnetite magnetofossil contributions to sedimentary magnetizations. Earth &Planetary Science Letters , 382: 58–65. | |
| Hesse P P. 1994. Evidence for bacterial palaeoecological origin of mineral magnetic cycles in oxic and sub-oxic Tasman Sea sediments. Marine Geology , 117(1-4): 1–17. | |
| Hounslow M W, Maher B A. 1996. Quantitative extraction and analysis of carriers of magnetization in sediments. Geophysical Journal International , 124(1): 57–74. | |
| Hu S Y, Deng C L, Appel E, et al. 2001. Environmental magnetic properties of the lake sediments. Chinese Science Bulletin (in Chinese) , 46(17): 1491–1494. | |
| Isambert A, Menguy N, Larquet E, et al. 2007. Transmission electron microscopy study of magnetites in a freshwater population of magnetotactic bacteria. Am. Mineral. , 92(4): 621–630. | |
| Kind J, Gehring A U, Winklhofer M, et al. 2011. Combined use of magnetometry and spectroscopy for identifying magnetofossils in sediments. Geochem.Geophys.Geosyst. , 12(8): Q08008. | |
| Kopp R E, Kirschvink J L. 2008. The identification and biogeochemical interpretation of fossil magnetotactic bacteria. Earth Science Reviews , 86(1-4): 42–61. | |
| Kruiver P P, Dekkers M J, Heslop D. 2001. Quantification of magnetic coercivity components by the analysis of acquisitioncurves of isothermal remanent magnetisation. Earth &Planetary Science Letters , 189(3-4): 269–276. | |
| Li J H, Pan Y X, Liu Q S, et al. 2010. Biomineralization,crystallography and magnetic properties of bullet-shaped magnetite magnetosomesin giant rod magnetotactic bacteria. Earth &Planetary Science Letters , 293(3-4): 368–376. | |
| Li J H, Wu W F, Liu Q S, et al. 2012. Magnetic anisotropy, magnetostatic interactions and identification of magnetofossils. Geochemistry, Geophysics, Geosystems , 13: Q151. | |
| Li J H, Benzerara K, Bernard S, et al. 2013. The link between biomineralization and fossilization of bacteria:Insights from field and experimental studies. Chemical Geology , 359: 49–69. | |
| Li J H, Pan Y X. 2015. Applications of transmission electron microscopy in the earth sciences. Scientia Sinica Terrae (in Chinese) , 45(9): 1359–1382. | |
| Li J H, Menguy N, Gatel C, et al. 2015. Crystal growth of bullet-shaped magnetite in magnetotactic bacteria of the Nitrospirae phylum. Journal of the Royal Society Interface , 12(103): 20141288. | |
| Lin W, Li J H, Schüler D, et al. 2009. Diversity analysis of magnetotactic bacteria in Lake Miyun, northern China, byrestriction fragment length polymorphism. Systematic &Applied Microbiology , 32(5): 342–350. | |
| Liu J B, Chen F H, Chen J H, et al. 2011. Humid Medieval Warm Period recorded by magnetic characteristics of sediments from Gonghai Lake, Shanxi, North China. Chinese Science Bulletin , 56(23): 2464–2474. | |
| Liu Q S, Deng C L. 2009. Magnetic susceptibility and its environmentalsignificances. Chinese J. Geophys. , 52(4): 1041–1048. doi: 10.3969/j.issn.0001-5733.2009.04.021. | |
| Liu Q S, Roberts A P, Larrasoaña J C, et al. 2012. Environmentalmagnetism:Principles and applications. Reviews of Geophysics , 50(4): RG4002. | |
| Liu S Z, Deng C L, Xiao J L, et al. 2015. Insolation driven biomagnetic response to the Holocene Warm Period in semi-arid East Asia. Scientific Reports , 5: 8001. | |
| Mann S, Frankel R B, Blakemore R P. 1984. Structure, morphologyand crystal growth of bacterial magnetite. Nature , 310(5976): 405–407. | |
| Mann S, Sparks N H C, Blakemore R P. 1987. Structure, morphology and crystal growth of anisotropic magnetite crystalsin magnetotactic bacteria. Proc. R. Soc. B:Biol. Sci. , 231(1265): 477–487. | |
| Pan Y X, Deng C L, Liu Q S, et al. 2004. Biomineralization andmagnetism of bacterial magnetosomes. Chinese Science Bulletin , 49(24): 2563–2568. | |
| Pan Y X, Zhu R X. 2011. A review of biogeophysics:The establishment of a new discipline and recent progress. Chinese Science Bulletin (in Chinese) , 56(17): 1335–1344. | |
| Petersen N, von Dobeneck T, Vali H. 1986. Fossil bacterial magnetite in deep-sea sediments from the South Atlantic Ocean. Nature , 320(6063): 611–615. | |
| Pike C R, Roberts A P, Verosub K L. 1999. Characterizing interactionsin fine magnetic particle systems using first order reversal curves. Journal of Applied Physics , 85(9): 6660–6667. | |
| Pósfai M, Kasama T, Dunin-Borkowski R E. 2007. Characterization of bacterial magnetic nanostructures using high-resolutiontransmission electron microscopy and off-axis electron holography.//Schüler Ded.Magnetoreception and Magnetosomes in Bacteria.Berlin Heidelberg:Springer-Verlag, 197-225. | |
| Roberts A P, Pike C R, Verosub K L. 2000. First-order reversal curve diagrams:a new tool for characterizing the magneticproperties of natural samples. Journal of Geophysical Research , 105(B12): 28461–28475. | |
| Roberts A P, Florindo F, Villa G, et al. 2011. Magnetotactic bacterial abundance in pelagic marine environments is limited by organic carbon flux and availability of dissolved iron. Earth Planet.Sci. Lett. , 310(3-4): 441–452. | |
| Roberts A P, Chang L, Heslop D, et al. 2012. Searching for single domain magnetite in the "pseudo-single-domain" sedimentary haystack:Implications of biogenic magnetite preservation for sediment magnetism and relative paleointensity determinations. Journal of Geophysical Research:Solid Earth , 117: B08104. doi: 10.1029/2012JB009412. | |
| Robertson D J, France D E. 1994. Discrimination of remanence-carrying minerals in mixtures, using isothermal remanentmagnetisation acquisition curves. Physics of the Earth &Planetary Interiors , 82(3-4): 223–234. | |
| Schumann D, Raub T D, Kopp R E, et al. 2008. Gigantismin unique biogenic magnetite at the Paleocene-Eocene ThermalMaximum. Proc. Natl. Acad. Sci. USA , 105(46): 17648–17653. | |
| Stacey F D, Banerjee S K. The Physical Principles of Rock Magnetism. Amsterdam: Elsevier, 1974 . | |
| Stockhausen H. 1998. Some new aspects for the modelling ofisothermal remanent magnetization acquisition curves by cumulative log Gaussian functions. Geophysical Research Letters , 25(12): 2217–2220. | |
| Stolz J F, Chang S B R, Kirschvink J L. 1986. Magnetotactic bacteria and single-domain magnetite in hemipelagic sediments. Nature , 321(6073): 849–851. | |
| Su Y L, Gao X, Liu Q S, et al. 2013. Mineral magnetic study of lacustrine sediments from Lake Pumoyum Co, southern Tibet, over the last 19ka and paleoenvironmental significance. Tectonophysics , 588: 209–221. | |
| Sun W W, Jackson M. 1994. Scanning electron microscopy and rock magnetic studies of magnetic carriers in remagnetized early Paleozoic carbonates from Missouri. Journal of Geophysical Research , 99(B2): 2935–2942. | |
| Tang L, Wang X S, Zhang S Q, et al. 2015. High-resolution magnetic and palynological records of the last deglaciation and Holocene from Lake Xiarinur in the Hunshandake Sandy Land, Inner Mongolia. Holocene , 25(5): 844–856. | |
| Thompson R, Oldfield F. 1986. Environmental Magnetism. Allen und Unwin. London. | |
| Wang H P, Kent D V, Jackson M J. 2013. Evidence for abundantisolated magnetic nanoparticles at the Paleocene-Eocene boundary. Proceedings of the National Academy of Sciencesof the United States of America , 110(2): 425–430. | |
| Xia D S, Ma J Y, Wang G, et al. 2006. Environmental magnetismconcepts and their applications to environmental studies in arid regions, Northwest China. Earth Science Frontiers (in Chinese) , 13(3): 168–179. | |
| Zhang W G, Dai X R, Zhang F R, et al. 2007. Magnetic properties of sediments from the Chaohu Lake for the last 7000 years andtheir implications for the evolution of Asian monsoon. Quaternary Sciences (in Chinese) , 27(6): 1053–1062. | |
| 符超峰, 宋友桂, 强小科, 等. 2009. 环境磁学在古气候环境研究中的回顾与展望. 地球科学与环境学报 , 31(3): 312–322. | |
| 韩玉林, 谈晓冬, 陈忠, 等. 2010. 湖光岩玛珥湖表层沉积物磁性粒度特征及其来源. 科学通报 , 55(3): 261–267. | |
| 胡守云, 邓成龙, AppelE, 等. 2001. 湖泊沉积物磁学性质的环境意义. 科学通报 , 46(17): 1491–1494. | |
| 李金华, 潘永信. 透射电子显微镜在地球科学研究中的应用. 中国科学: 地球科学, 2015 : 1359 -1382. | |
| 刘青松, 邓成龙. 2009. 磁化率及其环境意义. 地球物理学报 , 52(4): 1041–1048. | |
| 潘永信, 邓成龙, 刘青松, 等. 2004. 趋磁细菌磁小体的生物矿化作用和磁学性质研究进展. 科学通报 , 49(24): 2505–2510. | |
| 潘永信, 朱日祥. 2011. 生物地球物理学的产生与研究进展. 科学通报 , 56(17): 1335–1344. | |
| 夏敦胜, 马剑英, 王冠, 等. 2006. 环境磁学及其在西北干旱区环境研究中的问题. 地学前缘 , 13(3): 168–179. | |
| 张卫国, 戴雪荣, 张福瑞, 等. 2007. 近7000年巢湖沉积物环境磁学特征及其指示的亚洲季风变化. 第四纪研究 , 27(6): 1053–1062. | |
 2016, Vol. 59


