地球物理学报  2016, Vol. 59 Issue (8): 2911-2921   PDF    
南海珠江口盆地钻井BHT温度校正及现今地温场特征
唐晓音1,2 , 黄少鹏1 , 杨树春3 , 姜光政2 , 胡圣标2     
1. 西安交通大学人居环境与建筑工程学院, 西安 710049;
2. 岩石圈演化国家重点实验室, 中国科学院地质与地球物理研究所, 北京 100029;
3. 中海油研究总院, 北京 100027
摘要: 温度是盆地现今地温场研究最重要的基础参数之一,针对钻井井底温度(BHT)一般低于地层真实温度的情况,本文对珠江口盆地16口钻井的BHT数据进行了校正,并根据校正后的温度数据采用最小二乘法新增计算了16个地温梯度及大地热流数据.结合前人发表数据,本文绘制了珠江口盆地最新地温梯度等值线图及大地热流等值线图.除此之外,系统收集整理了盆地钻井大地热流、生热率以及热导率等参数,利用一维热传导方程计算了盆地1~5 km深度处的温度,并绘制了盆地深部温度等值线图.在此基础上,分析了盆地现今地温场特征及其成因,以期为珠江口盆地地球动力学背景研究及油气资源评价与勘探提供地热学参数.
关键词: BHT校正      地温梯度      大地热流      温度      珠江口盆地     
Correcting on logging-derived temperatures of the Pearl River Mouth Basin and characteristics of its present temperature field
TANG Xiao-Yin1,2, HUANG Shao-Peng1, YANG Shu-Chun3, JIANG Guang-Zheng2, HU Sheng-Biao2     
1. School of Human Settlements and Civil Engineering, Xi'an Jiaotong University, Xi'an 710049, China;
2. State Key Laboratory of Lithospheric Evolution, Institute of Geology and Geophysics, Chinese Academy of Sciences, Beijing 100029, China;
3. CNOOC Research Center, Beijing 100027, China
Abstract: Temperature data is one of the most important parameters in the present geothermal field research of basin, which includes the analysis of deep temperature, thermal gradient, heat flow. Temperature data commonly derived from continuous logging, drill stem test temperature (DST), bottom hole temperature (BHT) and so on. BHT, which is always lower than the real strata temperature, should be corrected before utilization in the present geothermal field research. In this paper, we are aiming to correct the BHT data of the Pearl River Mouth Basin and calculate new geothermal gradient data as well as new heat flow data. In combination with the previous data and parameters, we will estimate the temperature at the depth at 1 km, 2 km, 3 km, 4 km and 5 km, depict the counter map of geothermal gradient, heat flow and temperature, and further analyze the characteristics and genesis of the present geothermal field, hoping to provide the basic geothermal parameters for geodynamic research and hydrocarbon resources estimation and exploration of the Pearl River Mouth Basin.In this paper, two correct methods that is the Horner-plot method and the Waples method have been chosen for BHT correction. The new thermal gradient data have been calculated by the least square fitting based on the corrected BHT data, and the deep temperature have been acquired by the 1-D heat conduction equation. Thermal gradient of the Pearl River Mouth Basin ranges from 24.7℃/km to 60.8℃/km, with the average value of 37.87±7.35℃/km, and the heat flow ranges from 24.2 to 121.0 mW·m-2, with the average value of 71.5±13.4 mW·m-2. The temperature at the depth of 1 km, 2 km, 3 km, 4 km, 5 km ranges during 22.2~70.4℃, 43.6~117.4℃, 64.4~164.0℃, 84.4~209.9℃, and 103.7℃~254.9℃, respectively, and with the average value of 46.5±7.9℃, 78.3±10.9℃, 109.5±15.6℃, 139.8±20.7℃, and 169.6±26.2℃, respectively.After comparison between the corrected BHT with the DST data, we found that the corrected BHT data by the Horner Plot is still much lower than the DST data, while the data corrected by the Waples method is very close to the DST data; From the view of the geothermal gradient and heat flow, the Pearl River Mouth Basin belongs to the classical "hot basin"; The counter maps of the geothermal gradient, heat flow and deep temperature generally show the increase trend from the shelf area to the slop area, but display two abnormal areas with high value, that is the Shunde sub-sag and the Yangjiang sub-sag; The overall characteristics of the present geothermal field of the Pearl River Mouth Basin is under the control of geology background. The increase trend is in consistence with the decrease trend of the crust thickness of this basin, and the high value of the Shunde sub-sag is likely to be caused by igneous activities while the high value of the Yangjiang sub-sag might be the result of fault activities..
Key words: BHT correction      Geothermal gradient      Heat flow      Temperature      Pearl River Mouth Basin     
1 引言

珠江口盆地处于欧亚、印度—澳大利亚和太平洋及菲律宾海板块相互作用且靠近菲律宾板块的特殊构造位置,是在复杂基底上发育起来的被动大陆边缘盆地,其构造格局具有“东西分块、南北分带”特征.自北而南由北部断阶带、北部坳陷带,中部隆起带、南部坳陷带及南部隆起带组成“三隆两坳”地形(龚再升等,1997)(图 1a).珠江口盆地是中国南海北部最大的中新生代沉积盆地,由于其良好的油气资源前景而备受关注,2006珠江口盆地白云凹陷荔湾3-1深水扇气田的重大发现拉开了我国深水油气勘探的序幕.盆地的现今地温场特征与盆地所处的大地构造位置有关,是构造作用的综合反映,地温场通过提供能量、改变岩石力学性质来制约和影响岩石圈的变形与演化,同时也是影响分布于烃源岩中的分散有机质生成油气关键因素(Tissot et al.,1987).对现今地温场进行研究,可以了解盆地内烃源岩现今的受热状态和生烃状况,对评估盆地(或凹陷)的油气潜力具有重要意义.

图 1 珠江口盆地构造位置、构造单元划分(a)及中部地学断面图(b)(图b修改自姚伯初(1998)). 图(a)中,EP表示欧亚板块,IAP表示印度—澳大利亚板块,PP表示太平洋板块,ID表示印度板块,IC表示印支地块,SCS表示南海.图(b)中,CzS表示沉积层,UPC表示上地壳,LWC表示下地壳,M表示莫霍面. Fig. 1 Location & subdivision of the Pearl River Mouth Basin(a),and the Central Transect of the Pearl River Mouth Basin(b)(Fig. 1b is modified from Yao(1998)) In Fig. 1a,EP=Eurasian plate,PP= Pacific plate,ID=India,IC=Indochina,SCS=South China Sea; In Fig. 1b,CzS=Cenozoic sedimentary,UPC=Up crust,LWC=Lower crust,M=Moho boundary.

刻画现今地温场的物理量主要包括地层温度、地温梯度和大地热流分布特征等,其中地温梯度和大地热流研究基于地层温度的确定.常见的地温数据可分为钻孔系统连续测温、地层试油温度(DST)、孔底温度(BHT)、地层随压测试温度(MDT)等.上述各类温度数据中,系统连续测温数据、DST以及MDT数据比较可靠,它们构成了盆地地温场研究的主要数据.BHT由于泥浆循环、静井时间不够等因素影响,一般低于地层真实温度,需要校正后才能使用.关于BHT校正,前人一般使用的是Horner图版校正法(Horner,1951),但随着研究的深入,越来越多的学者发现Horner方法校正后的数据依然小于地层真实温度(Beck et al.,1988; Dowdle et al.,1975; Hermanrud et al.,1990)(一般认为DST最接近地层真实温度).Waples(2001)等根据Malay盆地的BHT数据校正过程总结出了经验公 式,并在2004年(Waples et al.,2004)对其进行了 拓展.Malay盆地是一个年轻的热盆,沉积物以碎屑 沉积为主(Waples et al.,2004),其盆地属性与珠江口盆地相似(唐晓音等,2014; 饶春涛和李平鲁,1991).

珠江口盆地现今地温场的研究始于20世纪70年代.为了研究南海的起源、演化历史、大地构造属性及其形成的地球动力学背景,前人获得了大量钻井和海底探针地热资料(Anderson et al.,1978; Jessop et al.,1976; Nissen et al.,1995; Ru and Pigott,1986; Shyu et al.,1998; Taylor and Hayes,1983; Watanable et al.,1977; 陈墨香等,1991; 饶春涛和李平鲁,1991; 徐行等,2006),其中包括了一部份珠江口盆地的地热数据,让我们对珠江口盆地 现今地温场有了基本认识.米立军等(2009)首次研究了南海北部深水区地热特征及其成因,并提 出南海北部深水区地温梯度为29.4±5.22℃/km,平均为39.1±0.74 ℃/km;大地热流值为24.2~121 mW·m-2,平均为77.5±14.8 mW·m-2.唐晓音等(2014)新增了19个大地热流数据,系统分析后认为盆地平均热流71.8±13.6 mW·m-2.由于海上盆地位置的特殊性,温度数据的获得主要依靠海上油气勘探井,这就导致研究区地温数据稀少,分布不均匀.本文通过系统整理,选取了16口参数完整的钻井BHT数据,采用Waples等(2001;2004)发表的方法对其进行了校正.并根据校正后的数据新增获得了研究区16个地温梯度及大地热流数据,丰富了研究区的地热学参数.除此之外,计算了盆地1~5 km深度的温度,以期为研究区油气资源评价与勘探提供地热学依据.

2 钻井BHT数据校正及新增地温梯度与大地热流数据 2.1 校正方法 2.1.1 Horner法

Horner Plot图版校正通过钻井时泥浆的循环时间和泥浆停止时间比值与温度测量值在图版上插值获得地层真实温度,校正方法的基本公式如下:

(1)

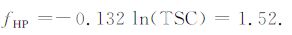
其中,Tc为校正后的温度数据,单位℃; Tm为测试的原始BHT数据,单位℃;tc为停井时间与泥浆循环结束间的时间,单位h,tc一般很难获得,但对校正结果影响不大,在没有具体参数的情况下,通常取2 h(Waples et al.,2001);TSC为泥浆循环结束至温度测试开始的时间,单位h;λ为岩石热导率,单位W/(mK);H为热供应率.

该方法需要对同一深度段的温度进行至少两次以上的测试,但现代油气勘探过程中,除了目的层段或者特殊要求,一般不会增加测井作业.即使存在多次作业,如果每次作业时间间隔太短,也会造成校正温度较大误差.另外,测井数据中很少记录泥浆循环时间,这些因素都造成了Horner Plot校正井温的局限性.针对以上情况,Waples等(20012004)通过统计分析马来盆地测井井温数据,利用DST测温数据作为参考标准,提出了一种新的井底温度校正方法,在本文中我们称为Waples法.

2.1.2 Waples 法

对于深度小于3000 m的BHT数据,校正公式如下:

(2)

其中,TC为校正后的温度数据,单位℃;TS为地表(海底)温度,单位℃;f为校正因子;Tm为测试BHT数据,单位℃.

对于单个BHT温度,校正因子f由下式给出:

(3)

其中,TSC是泥浆循环结束至温度测试间的时间,单位h;Z是温度数据所在深度,单位m.

对于已经作过Horner校正的温度数据,校正因子f由下式给出:

(4)

Horner校正的前提是同一深度需要进行多次温度测试,那么同一深度就会存在多个TSC,方程(4)中的TSC是指同一深度处最大的TSC值.

对于深度大于3000 m的BHT数据,有

(5)

2.2 校正结果

图 2a展示了例井LF13-1-2的校正结果,校正基本参数与校正结果数值见表 1.经过Horner法校正后,2854 m深度处的温度为129.2 ℃,2859 m深度处的温度为122.9 ℃,2063 m深度处的温度为94.2 ℃,1372 m深度处的温度为的56.4 ℃.虽然他们较原始BHT数值有所增大,但仍然明显小于DST数据(图 2b).而经过本论文选取的方法校正后,BHT数据非常接近DST数据,说明Waples方法适用于珠江口盆地BHT数据的校正.用最小二 乘法拟合原始BHT温度得到地温梯度为37 ℃/km,而根据Waples校正后的温度数据拟合得到的地温梯度为42.8 ℃/km,明显大于未校正数据(图 2b).运用相同方法,本文一共校正了16口井的BHT数据,其他15口井的校正结果如图 3.

表 1 LF13-1-2井校正基本参数与校正结果 Table 1 Basic parameters and results of the BHT correction for the well LF13-1-2
图 2 BHT校正例井LF13-1-2 (a)Horner 图版校正,图a中空心菱形表示各深度多次测量的BHT值;(b)BHT测试值与校正值间的对比,图b中蓝色的实心菱形代表测试BHT数据,绿色实心菱形代表Horner 图版(图a)校正后的BHT数据,红色实心圆点代表Waples方法校正后的BHT数据,红色斜十字代表DST数据. Fig. 2 An example from LF13-1-2 well showing (a)Horner-Plot method for obtaining corrected temperatures at successive measured depths,and(b)comparison between the uncorrected temperatures(blue diamond),corrected temperatures by Horner-plot method(green diamonds),corrected temperatures by Waples method(red dots)and DST(red crosses). In(a),two or more measured temperatures(BHTs)in each depth are used to obtain corrected temperatures by Horner-Plot method. The interceptions of the trend lines for each depth indicate corrected temperatures shown alongside an arrow. In(b),the value of 37 ℃/km shown at the lower-left corner and the value of 42.8 ℃/km shown at the upper-right corner present the geothermal gradients derived from the uncorrected temperatures and corrected temperatures by Waples method,separately.
2.3 珠江口盆地地温梯度

对校正后的BHT温度用最小二乘法进行线性拟合,得到16口钻孔的地温梯度(图 3表 2).结合前人报道的地温梯度数据(Yuan et al,2009饶春涛和李平鲁等,1991唐晓音等,2014),绘制了珠江口盆地现今地温梯度分布图(图 4).结果表明,珠江口盆地现今地温梯度值介于24.7~60.8 ℃/km,平均37.87±7.35 ℃/km.

图 3 钻孔校正前后BHT对比及校正后温度拟合地温梯度 蓝色实心菱形点代表原始BHT数据,红色实心圆点代表本文方法校正后的BHT数据,红色斜十字代表DST数据. Fig. 3 Temperature vs. depth plots for the studied boreholes The black lines connecting corrected temperatures at each measured depth(red dots)and the solid lines show the best-fit line for geothermal gradient at each borehole with values shown at the lower left corner at each figures. The value of geothermal gradient in the upper right corner of each figure indicates the geothermal gradient used to calculate heat flows in this study(see Table 2). The blue diamonds represent the uncorrected BHT and the red crosses represent the DST.
表 2 珠江口盆地新增大地热流数据.深度*表示除去水深与补心高的真实地层深度 Table 2 The newly acquired heat flow data of the Pearl River Mouth Basin. Depth with * at the upper-right represents the depth not including water depth and kelly bushing
图 4 珠江口盆地现今地温梯度等值线图 Fig. 4 Contour map of the geothermal gradient of the Pearl River Mouth Basin
2.4 珠江口盆地大地热流

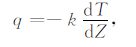
大地热流是表征由地球内部向地表传输并在单位面积上散发的热量,它是地球内部各种动力学过程的能量平衡在地表最直接的反映,在数值上,大地热流值等于地温梯度与地层热导率之积:

(6)

式中,q为大地热流(或称地表热流)值,mW·m-2k为热导率,W/(m·K);${{dT} \over {dZ}}$为地温梯度,℃/km;负号表示热流方向与地温梯度方向相反.

本文新增计算LF13-1-2等16口钻井的大地热流计算结果如表 2所示.经统计,位于研究区的大地热流数据共177个(图 5),大地热流值介于24.2~ 121.0 mW·m-2之间,平均71.5±13.4 mW·m-2. 根据盆地热流数据,按克里格插值法绘制了珠口盆地大地热流等值线图(图 5).可以看出,该盆地大地热流在平面上具有两个显著的分布特征:从北到南(从陆架到陆坡方向)大地热流具有逐渐增高的趋势;存在阳江凹陷和顺德凹陷两个高值异常区.

图 5 珠江口盆地现今大地热流等值线图 Fig. 5 Contour map of the heat flow of the Pearl River Mouth Basin
3 珠江口盆地深部温度

钻孔的深度一般有限,对于无法通过直接测量获得钻孔特定深度温度的情况,可以根据浅部测温资料用间接的方法向深部外推.在研究沉积盆地深部地温时,一般考虑岩石热导率和生热率不随时间和位置变化,在稳态热流状况下的深部温度可用下式计算:

(7)

式中q0为海底热流(mW·m-2);Z是深度(km);A是计算深度段的平均生热率(μW·m-3);K是计 算深度段的平均热导率W/m/K;TS为海底温度(℃).

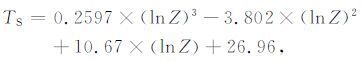
本论文海底温度计算公式如下,该公式根据台湾国际海洋研究中心海水温度数据库数据推算而来(Chi et al.,2008).

(8)

式中Z为水深,单位为m;TS为海底温度,单位为℃

根据式(7)—(8),本文分别计算了珠江口盆地 177个钻孔(钻孔分布见图 6)1000、2000、3000、4000、 5000 m深度处的地层温度,并绘制了相应的等值线图.总体来看,各深度处的温度分布具有如下特征.

1000 m深度处地温特征:地温介于22.2~70.4 ℃之间,平均为46.5±7.9 ℃,总体上呈北高南低之势,这种分布格局与恒温带温度取值有关,由于采用海底温度为恒温带温度,研究区北部浅水区海底温度为15~23 ℃,而南部水深大于800 m时,海底温度小于4 ℃.两者相差近20 ℃.从而导致 1000 m深度处地层温度具有北高南低分布特征(图 6a).

图 6 珠江口盆地1000 m(a)、2000 m(b)、3000 m(c)、4000 m(d)、5000 m(e)深度处的地温分布图 Fig. 6 Temperature at the depth of 1000 m(a),2000 m(b),3000 m(c),4000 m(d),5000 m(e)of the Pearl River Mouth Basin

2000 m深度处地温特征:地温介于43.6~117.4 ℃之间,平均为78.3±10.9 ℃,与1000深度处地温分布格局不同,2000 m处地温基本上不存在北高南低的分布特征,除阳江凹陷北部和顺德—开平凹陷两个显著高值异常之外,以70~90 ℃为主(图 6b).

3000 m深度处地温特征:地温介于64.4~164.0 ℃之间,平均为109.5±15.6 ℃,由北向南,温度呈现出增高趋势(图 6c).

4000 m深度处地温特征:地温介于84.4~209.9 ℃之间,平均为139.8±20.7 ℃,分布格局与3000 m处地温分布相似(图 6d).

5000 m深度处地温特征:最高254.9 ℃,最低 103.7 ℃,平均值169.6±26.2 ℃,分布格局与3000 m 处地温分布相似(图 6e).

4 珠江口盆地现今地温场特征及成因分析

据最新统计,珠江口盆地地温梯度平均为37.87±7.35 ℃/km,与中国东部华北(33~35 ℃/km)和松辽盆地(38 ℃/km)(王均等,1990)等“热盆”的地温梯度相当,高于苏北盆地(29.6 ℃/km)的地温梯度(袁玉松等,2005),远高于中国中西部地区的鄂尔多 斯(24.4 ℃/km)(Yuan et al.,2007)、四川(20.9 ℃/km)(袁玉松等,2006)、塔里木(20 ℃/km)(王良书等,2003)和准噶尔(21.2~22.6 ℃/km)(王社教等,2000邱楠生等,2001)等克拉通盆地的地温梯度.与中国 近海其他盆地相比,其地温梯度比东海(32.7 ℃/km)(Yang et al.,2004)和南黄海南部(28.6 ℃/km)(杨树春等,2003)都高.

珠江口盆地大地热流值平均为71.5±13.4 mW·m-2,远高于中国大陆地区大地热流平均值(63.0±24.2 mW·m-2)(胡圣标等,2001),也高于中国近海其他盆地:东海盆地台北坳陷的热 流值为59.5~81.3 mW·m-2,平均为70.4 mW·m-2,西湖坳陷的热流值为55.3~84.3 mW·m-2,平均为71.7 mW·m-2(Yang et al.,2004);南黄海盆地南部地区热流值为60.1~76.8 mW·m-2,平均为67.7 mW·m-2(杨树春等,2003).

盆地现今地温场是构造活动的综合反映,珠江口盆地新生代区域构造演化主要受华南板块与印支板块碰撞、太平洋及菲律宾海板块俯冲挤压和南海扩张等三大主控因素制约和影响,主要经历了晚白垩世—早渐新世多幕断陷裂谷阶段、晚渐新世—早中新世裂后断坳转换及区域热沉降阶段和晚中新世以来新构造运动及热沉降坳陷阶段等三大构造演化阶段(Ru et al.,1986; 李平鲁,1993; 张功成,2010).珠江口盆地多幕断陷裂谷作用始于晚白垩世,其发育演化历程先后经历了3幕断陷裂谷演化阶段(裂陷发育期),即晚白垩世初始断陷裂谷阶段、始新世断陷裂谷鼎盛阶段和早渐新世晚期断陷裂谷阶段.在此期间发生了神弧运动、珠琼运动一幕及珠琼运动二幕3次构造运动(李平鲁,1993).晚渐新世—早中新世,受印度板块与欧亚板块碰撞的影响,深部地幔流向SE和SSE 方向蠕散(Tapponnier et al.,1986).由于地幔物质的过剩堆积导致上地幔发生强烈隆升、岩石圈进一步被拉伸减薄,盆地进入了裂后断坳转换及热沉降阶段.晚渐新世该区发生了大规模的海底扩张(张裂)即南海运动,形成了南海北部地区区域性破裂不整合面.晚中新世以来,菲律宾板块向NNW方向俯冲推挤,台湾地体与东海陆架的碰撞拼贴,东沙运动即新构造运动开始(Sibuet et al.,2002),盆地伴随着块断升降、隆起剥蚀、挤压褶皱和断裂及岩浆等活动.

多幕拉张、裂陷使得珠江口盆地地壳厚度向洋盆方向递减,见图 1b.因此,盆地地温梯度、大地热流以及深部温度分布(2000 m以深)总体上从陆架到陆坡区增大,但局部存在两个高值异常区,分别为顺德和阳江地区.顺德地区的大地热流高值异常位于始新世—渐新世的基性岩侵入、喷发区,阳江地区的高值异常则位于珠三坳陷的北部边界断裂之上(饶春涛和李平鲁,1991),该岩浆侵入体的时代虽然较老,其本身的热效应对现今地温场的影响也许不会太显著,但可能正因为它的存在,导致深部热流体易于向浅部输送,从而在地表形成大地热流高值异常.同样,断裂活动带也起着深部热流体易于向浅部输送的沟通作用以及强烈的水热或其他热液作用,从而导致浅部地表地温梯度和大地热流出现高值异常.

5 结论

本文通过校正珠江口盆地的BHT数据,在新增地温梯度与大地热流数据的基础上计算了盆地1~5 km深度处的温度,并绘制了盆地最新地温梯度、大地热流及深部温度等值线图.经过一系列分析得出了以下结论:

(1) 研究区钻井井底温度(BHT)不能直接用于盆地地温场的研究,需要选用合理方法进行校正后才能使用.Waples方法适用于珠江口盆地BHT数据的校正.

(2) 珠江口盆地地温梯度值平均37.87± 7.35 ℃/km,大地热流值平均71.5±13.4 mW·m-2,属于典型的“热盆”;盆地1000、2000、3000、4000、 5000 m深度处的平均温度分别为46.5±7.9、78.3±10.9、 109.5±15.6、139.8±20.7、169.6±26.2 ℃.

(3) 珠江口盆地地温梯度、大地热流以及深度温度(2000 m以深)整体分布上具有类似特征,即由北部盆地(坳陷)带向中南部盆地(坳陷)带增高.这种特征受区域构造背景控制,增高趋势与北部地壳由陆架向陆坡区减薄的趋势相对应;局部热流高值异常可能由岩浆、断裂等活动造成.

致谢

地温资料收集得到了中海油研究总院以及中海石油(中国)有限公司深圳分公司的大力协助,两位审稿专家对稿件提出了宝贵的修改意见,在此表示衷心感谢!

参考文献
Ande rson R N, Langseth M G, Hayes D E, et al. 1978. Heat flow, thermal conductivity, geothermal gradient.//Hayes D E eds. Geophysical Atlas of the East and Southeast Asian Seas. Geological Society of America, Boulder, CO.
Beck A E, Balling N. 1988. Determination of Virgin Rock Temperatures.//Handbook of Terrestrial Heat-Flow Density Determination, R. Haenel, L. Rybach, and L. Stegena, Editors. Springer Netherlands, 59-85.
Chen M X, Xia S G, Yang S Z. 1991. Local geothermal anomalies and their formation mechanisms on Leizhou peninsula, South China. Scientia Geologica Sinica. (in Chinese) , 26(4): 369–383.
Chi W C, Reed D L. 2008. Evolution of shallow, crustal thermal structure from subduction to collision:An example from Taiwan. Geological Society of America Bulletin , 120(5-6): 679–690.
Dowdle W L, Cobb W M. 1975. Static formation temperature from well logs-an empirical method. Journal of Petroleum Technology , 27(11): 1326–1330.
Gong Z S, Li S T, Xie T J, et al. Continental Margin Basin Analysis and Hydrocarbon Accumulation of the Northern South China Sea . (in Chinese) Beijing: Science Press, 1997 .
Hermanrud C, Cao S, Lerche I. 1990. Estimates of virgin rock temperature derived from BHT measurements:bias and error. Geophysics , 55(7): 924–931.
Horner D R. 1951. Pressure build-up in wells.//Procedings of the Thidrd World Petroleum Congress, The Hague, Section Ⅱ, 503-521.
Hu S B, He L J, Wang J Y. 2001. Compilation of heat flow data in the China continental area (3rd edition). Chinese Journal of Geophysics. (in Chinese) , 44(5): 611–626.
Jessop A M, Hobart M A, Sclater J G. The world heat-flow data collection-1975. Geothermal Series Number 5. Canada: Earth Physics Branch, 1976 : 125 .
Li P L. 1993. Cenozoic tectonic movement in the Pearl River Mouth Basin. China Offshore Oil and Gas (Geology). (in Chinese) , 7(6): 11–17.
Mi L J, Yuan Y S, Zhang G C, et al. 2009. Characteristics and genesis of geothermal field in deep-water area of the northern South China Sea. Acta Petrol EI Sinica. (in Chinese) , 30(1): 27–32.
Nissen S S, Hayes D E, Bochu Y, et al. 1995. Gravity, heat flow, and seismic constraints on the processes of crustal extension: Northern margin of the South China Sea. Journal of Geophysical Research , 100(B11): 22447–22483.
Qiu N S, Wang X L, Yang H B, et al. 2001. The characteristics of temperature distribution in the Junggar basin. Scientia Geologica Sinica. (in Chinese) , 36(3): 350–358.
Rao C T, Li P L. 1991. Study of heat flow in Pearl River Mouth Basin. China Offshore Oil and Gas (Geology). (in Chinese) , 5(6): 7–18.
Ru K, Pigott J D. 1986. Episodic rifting ad subsidence in the South China Sea. AAPG Bulletin , 70(9): 1136–1155.
Shyu C T, Hsu S K, Le Pichon X, et al. 2002. East Asia plate tectonics since 15 Ma:constraints from the Taiwan region. Tectonophysics , 344(1-2): 103–134.
Shyu C T, Hsu S K, Liu C S. 1998. Heat flows off southwest Taiwan:Measurements over mud diapirs and estimated from bottom simulating reflectors. Terrestrial Atmospheric and Oceanic Sciences , 9(4): 795–812.
Tang X Y, Hu S B, Zhang G C, et al. 2014. Characteristic of surface heat flow in the Pearl River Mouth Basin and its relationship with thermal lithosphere thickness. Chinese J. Geophys. (in Chinese) , 57(06): 1857–1867.
Tapponnier P, Peltzer G, Armijo R. 1986. On the mechanics of the collision between India and Asia.//M.P. Coward and A.C. Ries, Editors. Collision Tectonics. Published for the Geological Society by Blackwell Scientific:Lond, 115-157.
Taylor B, Hayes D E. 1983. Origin and history of the South China basin. 27th AGU. Washington, DC.
Tissot B P, Pelet R, Ungerer P. 1987. Thermal History of Sedimentary Basins, Maturation Indexes, and Kinetics of Oil and Gas Generation. AAPG Bulletin , 71(12): 1445–1466.
Wang J, Huang S Y, Huang G S, et al. Basic Characteristics of the Earth's Temperature Distribution in Chian. Beijing: Seismic Press, 1990 .
Wang L S, Li C, Liu S W, et al. 2003. Geotemperature gradient distribution of Kuqa foreland basin, north of Tarim, China. Chinese Journal of Geophysics. (in Chinese) , 46(3): 403–407.
Wang S J, Hu S B, Wang J Y. 2000. The characteristics of heat flow and geothermal fields in Junggar basin. Chinese Journal of Geophysics. (in Chinese) , 43(6): 771–779.
Waples D W, Pacheco J, Vera A. 2004. A method for correcting log-derived temperatures in deep wells, calibrated in the Gulf of Mexico. Petroleum Geoscience , 10(3): 239–245.
Waples D W, Ramly M. 2001. A statistical method for correcting log-derived temperatures. Petroleum Geoscience , 7(3): 231–240.
Watanable T, Langseth M G, Anderson R N. Heat flow in back-arc basins of the western Pacific. In:Talwani M, Pitman W C,eds. Island Arcs,Deep Sea Trenches and Back-Arc Basins. Washington, D C:AGU, 1977.137-167.
Xu X, Shi X B, Luo X H, et al. 2006. Heat flow measurements in the Xiasha Trough of the South China Sea. Marine and Geology &Quaternary Geology. (in Chinese) , 26(4): 51–58.
Yang S C, Hu S B, Cai D S, et al. 2003. Geothermal characteristics and tectonothermal evolution of the southern area of South Yellow Sea. Chinese Science Bulletin. (in Chinese) , 48(14): 1564–1569.
Yang S C, Hu S B, Cai D S, et al. 2004. Present-day heat flow, thermal history and tectonic subsidence of the East China Sea Basin. Marine and Petroleum Geology , 21(9): 1095–1105.
Yao B C. 1998. Crust structure of the northern margin of the South China Sea and its tectonic significance. Marine Geology and Quaternary Geology. (in Chinese) , 18(2): 1–16.
Yuan Y S, Guo T L, Hu S B, et al. 2005. Tectonothermal evolution and hydrocarbon generation history in southern Jiangsu, Lower Yangtze area-a case study of Well Shengke 1. Progress in Natural Science. (in Chinese) , 15(06): 753–758.
Yuan Y S, Ma Y S, Hu S B, et al. 2006. Present geothermal characteristics in South China. Chinese Journal of Geophysics. (in Chinese) , 49(4): 1118–1126.
Yuan Y, Hu S, Wang H, et al. 2007. Meso-Cenozoic tectonothermal evolution of Ordos basin, central China:Insights from newly acquired vitrinite reflectance data and a revision of existing paleothermal indicator data. Journal of Geodynamics , 44(1-2): 33–46.
Yuan Y, Zhu W L, Mi L J, et al. 2009. "Uniform geothermal gradient" and heat flow in the Qiongdongnan and Pearl River Mouth Basins of the South China Sea. Marine and Petroleum Geology , 26(7): 1152–1162.
Zhang G C. 2010. Tectonic evolution of deepwater area of northern continental margin in South China Sea. Acta Petrol EI Sinica. (in Chinese) , 31(4): 528–533.
陈墨香, 夏斯高, 杨淑贞. 1991. 雷州半岛局部地热异常及形成机制. 地质科学 , 26(4): 369–383.
龚再升, 李思田, 谢泰俊, 等. 南海北部大陆边缘盆地分析与油气聚集. 北京: 科学出版社, 1997 .
胡圣标, 何丽娟, 汪集旸. 2001. 中国大陆地区大地热流数据汇编(第三版). 地球物理学报 , 44(05): 611–626.
李平鲁. 1993. 珠江口盆地新生代构造运动. 中国海上油气(地质) , 7(6): 11–17.
米立军, 袁玉松, 张功成, 等. 2009. 南海北部深水区地热特征及其成因. 石油学报 , 30(1): 27–32.
邱楠生, 王绪龙, 杨海波, 等. 2001. 准噶尔盆地地温分布特征. 地质科学 , 36(3): 350–358.
饶春涛, 李平鲁. 1991. 珠江口盆地热流研究. 中国海上油气(地质) , 5(6): 7–18.
唐晓音, 胡圣标, 张功成, 等. 2014. 珠江口盆地大地热流特征及其与热岩石圈厚度的关系. 地球物理学报 , 57(06): 1857–1867.
王钧, 黄尚瑶, 黄歌山, 等. 中国地温分布的基本特征. 北京: 地震出版社, 1990 .
王良书, 李成, 刘绍文, 等. 2003. 塔里木盆地北缘库车前陆盆地地温梯度分布特征. 地球物理学报 , 46(3): 403–407.
王社教, 胡圣标, 汪集旸. 2000. 准噶尔盆地热流及地温场特征. 地球物理学报 , 43(6): 771–779.
徐行, 施小斌, 罗贤虎, 等. 2006. 南海西沙海槽地区的海底热流测量. 海洋地质与第四纪地质 , 26(4): 51–58.
杨树春, 胡圣标, 蔡东升, 等. 2003. 南黄海南部盆地地温场特征及热-构造演化. 科学通报 , 48(14): 1564–1569.
姚伯初. 1998. 南海北部陆缘的地壳结构及构造意义. 海洋地质与第四纪地质 , 18(2): 1–16.
袁玉松, 郭彤楼, 胡圣标, 等. 2005. 下扬子苏南地区构造-热演化及烃源岩成烃史研究——以圣科1井为例. 自然科学进展 , 15(06): 753–758.
袁玉松, 马永生, 胡圣标, 等. 2006. 中国南方现今地热特征. 地球物理学报 , 49(4): 1118–1126.
张功成. 2010. 南海北部陆坡深水区构造演化及其特征. 石油学报 , 31(4): 528–533.