2. 中国地震局地震预测重点实验室(中国地震局地震预测研究所), 北京 100036
2. CEA Key Laboratory of Earthquake Prediction (Institute of Earthquake Science, China Earthquake Administration), Beijing 100036, China
2013年4月20日在龙门山断裂带南段发生了逆冲型的四川芦山MS7.0级地震.震后的现场应急科考及高分辨率遥感影像解译等,均没有在芦山震区主要断层附近发现构造成因的地震地表破裂带(徐锡伟等,2013;李传友等,2013;张岳桥等,2013),而相关的探槽、浅层人工地震探测结果也反映了一些研究(韩竹军等,2013)曾经认为的芦山“地震地表破裂迹象”其实并未向下延伸,进一步支持这次地震并没有形成明显的地震地表破裂(雷生学等,2014).此外,虽然不同研究机构给出的该地震序列的余震重新定位结果略有差别,但均显示余震主要集中在10~20 km的深度范围内,更浅部的余震稀少(陈晨和胥颐,2013;房立华等,2013;吕坚等,2013;苏金蓉等,2013;赵博等,2013;Han et al.,2014;Long et al.,2015).而基于波形数据的地震学反演结果表明芦山主震时震源断层以逆冲滑动为主,兼有一定右旋走滑分量,但在断层浅部没有显著的同震滑移分布(Hao et al.,2013;刘成利等,2013;王卫民等,2013;张勇等,2013;赵翠萍等,2013;Zhang et al.,2014).因此综合地表地质调查、余震定位、破裂过程反演等结果推断芦山地震可能是一次盲逆断层的错动事件(徐锡伟等,2013;Long et al.,2015).
针对芦山MS7.0级地震的同震滑动与破裂方式,一些学者分别以震区地表的GPS、InSAR、强震动等观测资料为约束开展了相关反演研究(Jiang et al.,2014;刘云华等,2014;金明培等,2014),部分结果显示主震时发震断层的滑动是以逆冲为主,兼有显著左旋走滑分量(Jiang et al.,2014;刘云华等,2014),这与利用地震学资料与方法的反演结果及认识有所不同(Hao et al.,2013;刘成利等,2013;王卫民等,2013;张勇等,2013;赵翠萍等,2013;Zhang et al.,2014).因此,有必要利用更多的观测资料,尤其是近场的多学科观测资料进行联合约束,探寻出现上述差异的原因.此外,发震断层的构造模型对于反演结果可能有较大影响,但已有的针对芦山地震破裂过程、同震滑动的反演研究大多采用了过于简化的断层模型——具有固定倾角的单一倾斜面(Hao et al.,2013;刘成利等,2013;王卫民等,2013;张勇等,2013;赵翠萍等,2013;Zhang et al.,2014;Jiang et al.,2014;刘云华等,2014),或者假设断层倾角随深度线性渐变(金明培等,2014),倾角的选取则主要依据地表地质信息或者通过数据拟合来搜索最优角度.然而,重新定位的余震分布已初步揭示芦山地震的发震构造可能更为复杂,可能包含多条同向及反向的断层(徐锡伟等,2013;陈晨和胥颐,2013;房立华等,2013;吕坚等,2013;苏金蓉等,2013;赵博等,2013;Han et al.,2014;Long et al.,2015).鉴于反演问题存在的多解性,利用更多信息进行参考限定,构建更加接近实际的断层模型,是能否反演出更加合理的同震滑动与破裂方式的关键.
本文借助对芦山地震序列的高精度重新定位结果,结合震区的地质与地球物理信息进行综合分析,构建三维发震构造模型;在此基础上采用水平层状弹性介质模型,并以震区近场的GPS、水准及强震动等多种地表观测资料作为约束,联合反演芦山主震的同震滑动分布,进而分析讨论该地震的发生与发震构造和地表多种观测之间的动力学关联.
2 地表观测数据本文使用的地表同震位移/形变观测数据主要为GPS、强震动、水准观测三类(图 1a).其中,芦山震中200 km以内有33个连续GPS站,包括中国大陆构造环境监测网络项目(简称陆态网络)、四川省地震局区域网以及中国地震局地震预测研究所在芦山震区及其附近布设的小台阵.已有学者利用这些连续GPS台站的观测数据解算出芦山主震的同震位移(武艳强等,2013;Jiang et al.,2014),本文直接利用这些解算结果.考虑到芦山震区的近场(余震区及其附近)仅有4个连续GPS台站,可能难以对反演过程进行很好约束,我们补充了震中距60 km范围内13个强震台站的观测资料,使用其中已经过基线校正的三分量共38个同震位移数据(51QLY台垂向结果不可靠,未使用)(金明培等,2014).另外,2008年汶川MS8.0级地震之后,四川省测绘局于2010年4—11月对龙门山断裂带南段地区进行了二等水准复测,芦山地震之后,中国地震局第二监测中心于2013年6—7月对穿越该震区的雅安—宝兴测线进行了一等精密水准复测.相关研究已利用这两期水准观测,扣除震间影响,计算得到芦山地震的同震垂向位移(郝明等,2014).将芦山余震区及其附近多个测点的水准观测结果纳入本文的研究,使我们能够对芦山地震发震断层的同震垂向运动反演进行很好约束.

|
图 1 用于反演计算的观测站(点)的分布(a)以及重新定位的芦山地震序列分布(b) 图(a)中的紫色方框表示图(b)的位置与范围,图(b)中重新定位的芦山地震序列分布据Long等(2015). Fig. 1 Distribution of the observation stations included in the inversion process(a)and the relocated hypocenters of the Lushan earthquake sequence(b) The purple box in Fig.1a represents the location and range of the Fig.1b,the relocated hypocenters of the Lushan earthquake sequence in Fig.1b is from Long et al.(2015). |
已有研究大多将2013年芦山MS7.0地震的发震断层简化为单一的倾斜面(Hao et al.,2013;刘成利等,2013;王卫民等,2013;张勇等,2013;赵翠萍等,2013;Zhang et al.,2014;Jiang et al.,2014;刘云华等,2014),但重新定位的余震分布及发震构造研究已表明实际的发震断层结构可能更加复杂(徐锡伟等,2013;Long et al.,2015),对发震断层过于简化的处理会对同震滑动反演结果的可靠性以及对破裂过程与机理的解释产生较大影响.相比于其他地球物理探测方法,由高精度重新定位的余震3D分布,结合相关地质与地球物理信息来刻画震源断层的结构,是目前国际同类研究中效果最好、被选用较多的一种方法(Shaw and Shearer,1999;Boncio et al.,2004;Lutter et al.,2004;Plesch et al.,2007).为此,我们利用芦山地震序列重新定位的最新结果(Long et al.,2015),结合相关地质与地球物理信息(Jia et al.,2006;Burchfiel et al.,2008;雷兴林等,2013;詹艳等,2013;Li et al.,2014;Wang et al.,2014;Liu et al.,2015)进行综合分析,构建用于本文同震滑动反演的芦山地震的三维断层模型.其中,Long等(2015)已发表的芦山序列的重新定位结果,由于采用了多方法、分阶段联合定位技术,通过修正数据与速度模型,以及在不同阶段反复迭代等途径有效提高了定位精度(定位误差仅数百米),是目前为止针对芦山地震序列重新定位精度最高的结果之一,采用这一结果使得本研究能够更细致分析芦山地震的发震构造.
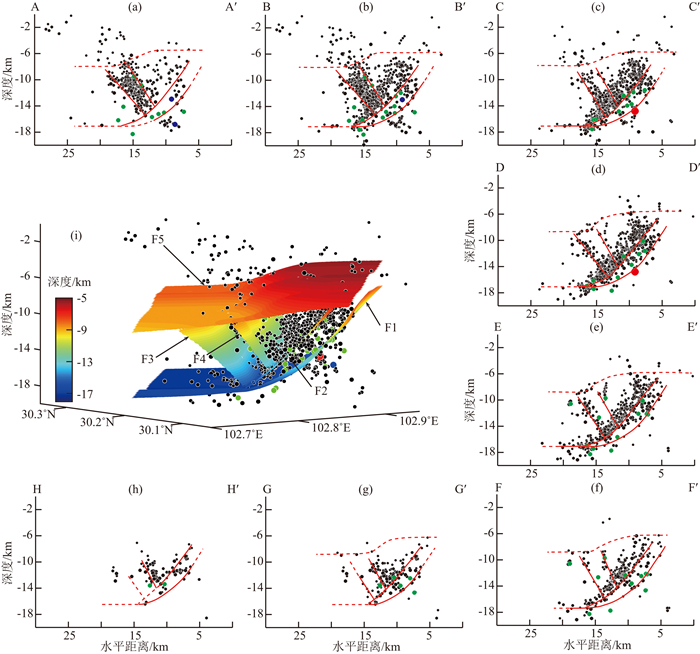
余震分布范围通常可以作为主震破裂区范围的上限(Wells and Coppersmith,1994).因此,由图 1b可以推断芦山主震的破裂长度不超过36 km.我们沿余震区长轴走向等间距划分了A-A′—H-H′共8个垂直于长轴走向的剖面线,取每一剖面线两侧各4 km宽的范围进行震源深度投影,相邻剖面的投影区域相互重叠4 km(图 1b),然后分析各剖面上的震源深度分布并参考相邻剖面的分布情况进行断层解释,结果如图 2a—2h.从中看到:震区存在两条NW倾的主断层F1和F2,深度范围8~17 km,倾角由浅部约55°随深度逐渐减小,最终汇聚于约17 km深的近水平基底滑脱带上,而重新定位的芦山主震震源位于断层F1的断坡(ramp)的中下部.此外,据断层F2上盘的余震分布还可以识别出两条SE倾的反倾断层F3和F4(图 2c—2e,图 2f—2h).其中,F3长8~16 km,倾角约53°,而F4长8~14 km,倾角60°左右,两条断层的倾角随深度变化不大.构造地质学的相关理论表明,在逆冲褶皱构造的发展过程中,其除了会朝推覆方向形成一系列叠瓦状的、向下汇聚于基底滑脱面的主要逆冲断层外,也往往会在这些断层的断坡上形成一些反倾的次级逆断层,即反冲断层(back-thrust)(Boyer and Elliott,1982;Cooley et al.,2011).而相关研究也表明龙门山断裂带南段具有典型的叠瓦状逆冲构造的发育特征(李勇等,2013;王伟锋等,2014).因此,我们在图 2a—2h中对芦山震区断层系统的解释结果在理论上是合理有据的.

|
图 2 图 2(a)—(h)横跨芦山震区8个剖面的震源深度分布及断层解释;(i)本研究构建的芦山震区的三维断层模型.剖面线位置见图 1b,F1—F5为断层编号.重新定位目录来自Long等(2015) Fig. 2 Fig.2(a)—(h)The hypocentral distribution and the fault interpretation of 8 profiles across the aftershocks zone of the Lushan earthquake.(i)The 3D seismogenic fault model we constructed for the Lushan earthquake.The layout of profile lines is shown in Fig.1b,F1—F5 indicate numbers of the faults.The data of the relocated hypocenters are from Long et al.(2015) |
此外,我们注意到芦山震区绝大多数余震都位于深度8 km以下的前述4条断层区域内,而8 km以上深度的余震很少(图 2a—2h),这说明横跨芦山震区似乎存在一个由NW侧8~9 km深渐变到SE侧5~6 km深的界面F5,它将震区分隔成浅层和下层两个部分,下层的断层和余震受此界面的限制,没有进一步向上扩展.相关地质调查与地球物理勘探信息已证实,在横穿芦山震区的龙门山断裂带南段确实存在一个向NW缓倾、深度由NW侧8 km渐变到SE侧5 km左右的浅部滑脱面,它分隔了浅层的中新生界沉积盖层与下层的变质基底(Jia et al.,2006;Burchfiel et al.,2008;詹艳等,2013;徐锡伟等,2013;Long et al.,2015).由此看来,芦山地震的发震构造确实是位于浅部滑脱面F5之下的、由F1-F4组成的隐伏逆冲断层系统,即盲冲断层系统(徐锡伟等,2013),而F5界面之上的少量余震则可能是浅部断层受主震破裂影响而触发的(Long et al.,2015).
综上,我们将图 2a—2h剖面的断层解译结果进行综合,通过插值和平滑处理得到芦山震区的三维断层模型(图 2i),并用于下一节的同震滑动分布反演.该模型包括通过主震震源的NW倾主断层F1及其连接的基底滑脱带部分,F1上方NW倾的断层F2,F2上方两条反倾断层F3和F4,以及浅层滑脱面F5.其中,F1—F4的断层走向总体上平行,仅在局部存在一定差异.如前所述,图 2的断层模型确定是以重新定位的余震分布为主,结合了相应地质与地球物理信息,因此结果是可靠的.
4 同震滑动分布反演本文采用基于约束条件下最小二乘原理及最速下降法的反演方法(Wang et al.,2009),根据图 2i的断层模型对2013年芦山MS7.0主震的同震滑动分布进行反演.该反演方法在发展更新过程中已得到国内外学者的广泛使用和认可(Wang et al.,2009,2013;Xu et al.,2010a;Diao et al.,2011;Zhang et al.,2011),它在反演过程中同时考虑数据拟合程度以及断层面上滑动或应力降分布的平滑性,利用最速下降法搜索满足目标函数最小的解(Wang et al.,2009):

|
(1) |
式中b表示每个子断层面上的滑动量,y表示不同的观测数据集,G表示联系二者的格林函数,H表示拉普拉斯算子的有限差分近似表达式乘以与滑动量成正比的权重因子,τ表示与断层面上滑动分布呈线性相关的剪切应力降,α表示平滑因子.
在同震滑动分布的反演研究中,通常将地壳简化为弹性半无限空间均匀介质(Okada,1992).但由于这种简化的介质模型与实际差异较大,会在一定程度上降低反演结果的可靠性.而我们使用的反演方法可以将地壳处理为层状介质模型,相对更接近于实际,因此可提升反演结果的整体可靠性.发生芦山地震的龙门山断裂带南段处于青藏高原和四川盆地的过渡地带,地壳上地幔介质结构同时受两侧块体的影响(Wang et al.,2007;Xu et al.,2010b;王小龙等,2013;郑勇等,2013).考虑到逆冲型地震主要以上盘的变形为主,受上盘介质结构的影响更大,因此我们主要依据龙门山断裂带北西侧(上盘)区域已有的P波、S波速度以及密度等研究成果(Wang et al.,2007;Xu et al.,2010b)构建反演用的层状介质模型(表 1).
|
|
表 1 反演采用的分层壳幔结构模型(Wang et al.,2007;Xu et al.,2010b) Table 1 The layered crust-mantle structure model used in inversion(Wang et al.,2007;Xu et al.,2010b) |
不同类型观测资料在本文反演中的权重采用了计算程序中的设定,即整体相对权重为1,而权重的分配考虑了各类观测具体数据的误差,误差越大的数据对应的权重越低.
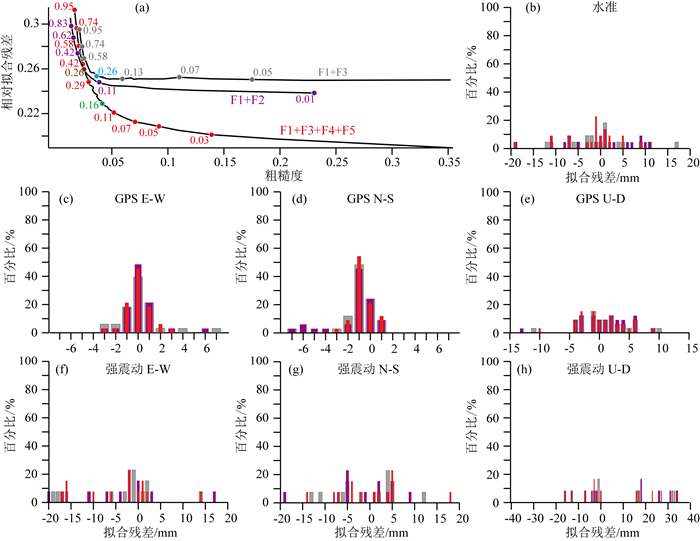
平滑因子α的选取会对反演的同震滑动分布产生显著影响,实际反演计算时一般利用粗糙度和拟合残差的折中曲线来选择,基本能兼顾二者的平滑因子(图 3a).

|
图 3 相对拟合残差与粗糙度折中曲线,圆点旁的数字为对应平滑因子,灰色、紫色、红色点分别对应F1+F3、F1+F2和F1+F3+F4+F5断层模型,青色、棕色、绿色点对应各自最优平滑因子;(b)—(h)三个断层模型反演的拟合残差分布,灰色、紫色、红色分别为F1+F3、F1+F2和F1+F3+F4+F5模型,平滑因子分别取0.26、0.26和0.16 Fig. 3 The trade-off curves of relative fitting residual and roughness,the numbers next to the points represent the smoothing factors,the grey,purple and red dots correspond to F1+F3 fault model,F1+F2 fault model and F1+F3+F4+F5 fault model,and the cyan,brown and green dots correspond to the best smoothing factors,respectively.(b)—(h)demonstrate the fitting residual distribution of inversion model,the grey and purple bars present the result of F1+F3 fault model and F1+F2 fault model respectively with smoothing factor of 0.26,while the red bars present the result of F1+F3+F4+F5 fault model with smoothing factor of 0.16 |
为了了解和验证本文所构建的三维断层模型(图 2i)中哪些断层参与了芦山主震的同震破裂过程,我们将该断层模型离散成一系列2 km×2 km的子断层片,利用离散后5条断层的不同组合分别进行同震滑动反演,尝试从中找出最合理、且能最佳拟合地表多种同震位移观测的断层组合.
5 反演结果与讨论 5.1 反演结果分析我们尝试了利用图 2中5条断层所有可能的组合模型进行反演,发现以F1+F3+F4+F5作为发震断层模型得到的模拟值与地表实际观测资料的拟合效果最优,拟合残差更集中,且残差大的奇异点相对较少(图 3a—3h).另外我们发现,所有不包含浅部滑脱面F5的发震断层组合模型,其在F1断层面上的反演结果存在一定的不合理性.以F1+F3的简化组合模型为例,其反演结果揭示的F1和F3断层的同震运动方式尽管与F1+F3+F4+F5断层模型反演结果对应断层的同震运动方式基本一致,但在简化断层模型F1+F3的结果中,沿F1断层浅部的同震滑移量非常大,且滑移极值区在浅部向NE侧有所迁移(图 4),说明在F1+F3简化断层模型的情况下,沿F1的同震破裂理应继续朝地表扩展.然而,这与余震主要分布于F5之下以及与主断层F1终止于浅部滑脱面F5之下的震区构造特征不符(图 2).此外,所有包含与主断层同倾向断层F2的发震断层组合模型,其反演结果同样存在一定的不合理性.以F1+F2的简化组合模型为例,其反演结果显示同震滑动都分布在次级断层F2之上,而主断层F1之上则几乎没有滑动(图 5).这显然与芦山主震震源位于主断层F1之上且较大震级的余震主要分布在F1断面周围及F1和F2之间的观测现象相违背(图 2).而基于地震波谱的反演表明:芦山地震的震源过程反映在第一次较大的破裂释放事件之后还有几次明显的但规模稍小的破裂释放事件(刘成利等,2013;张勇等,2013;赵翠萍等,2013;Zhang et al.,2014),而这些较小的事件有可能对应了次级断层F3、F4等的同震错动.因此,综合上述分析我们认为主断层F1、反倾断层F3和F4以及浅部滑脱面F5可能参与了芦山主震的同震破裂过程,即由F1+F3+F4+F5的断层组合模型得到的同震滑动分布结果是最有可能的.

|
图 4 F1+F3断层模型的反演结果,(a)和(b)分别为反演的F3、F1断层面的同震滑动分布.黑色箭头表示子断层片上盘相对下盘的同震滑动矢量.图b中的白色圆点表示Long等(2015)重新定位的芦山主震震源 Fig. 4 The inverted coseismic slips on fault surfaces F3(a)and F1(b)from the fault model F1+F3.The black arrows denote the coseismic slip vectors of the hanging wall relative to the foot wall.The white point in(b)indicates the relocated hypocenter of the Lushan mainshock from Long et al.(2015) |

|
图 5 F1+F2断层模型的反演结果,(a)和(b)分别为反演的F2、F1断层面的同震滑动分布.黑色箭头表示子断层片上盘相对下盘的同震滑动矢量.图b中的白色圆点表示Long等(2015)重新定位的芦山主震震源 Fig. 5 The inverted coseismic slips on fault surfaces F2(a)and F1(b)from the fault model F1+F2.The black arrows denote the coseismic slip vectors of the hanging wall relative to the foot wall.The white point in(b)indicates the relocated hypocenter of the Lushan mainshock from Long et al.(2015) |
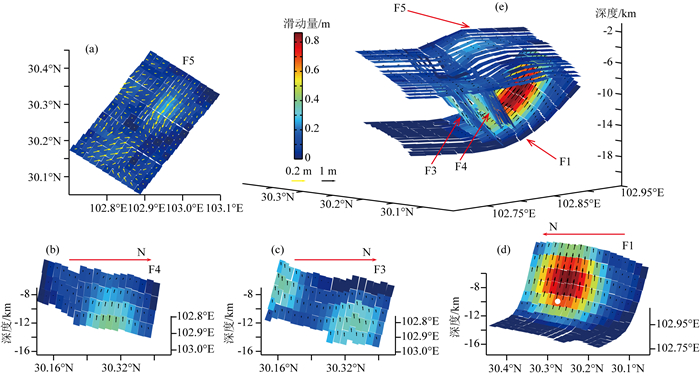
由复杂断层模型F1+F3+F4+F5的反演结果可见,主断层F1上的同震滑动最为显著,最大滑动量0.86 m位于F1断坡上30.26°N,102.99°E,深度11.49 km的子断层片上,滑动角为92.88°(图 6d—6e).该子断层片位于Long等(2015)重新定位的主震震源点上方,且与一些研究机构得到的主震矩心深度基本一致( http://earthquake.usgs.gov/earthquakes/eqarchives/fm/neic_b000gcdd_wmt.php;曾祥方等,2013;Han et al.,2014).在F1的断坡上,同震滑动以上述位置为中心向四周逐渐衰减,平均滑动量为0.19 m(底部滑脱带也参与了平均),平均滑动角为98.03°(图 6d—6e).因此,我们反演主震时沿F1断层的同震滑动几乎是纯逆冲的,与该主震震源机制解的大多数结果完全一致(http://earthquake.usgs.gov/earthquakes/eqarchives/fm/neic_b000gcdd_wmt.php ;http://earthquake.usgs.gov/earthquakes/eqarchives/fm/neic_b000gcdd_fmt.php ;杜方等,2013;林向东等,2013;刘杰等,2013;吕坚等,2013;曾祥方等,2013;赵博等,2013;Han et al.,2014;Long et al.,2015).

|
图 6 F1+F3+F4+F5断层模型的反演结果 (a)—(d)各断层面同震滑动反演结果;(e)整个断层模型的同震滑动反演结果.黑色和黄色箭头用不同比例表示子断层片上盘相对下盘的同震滑动矢量.图d中的白色圆点表示Long等(2015)重新定位的芦山主震的震源点. Fig. 6 The inversion results from the fault model F1+F3+F4+F5 (a)—(d)The inversion results of coseismic slip on each fault surface;(e)The inversion results of coseismic slip of the whole fault model.The black and yellow arrows denote the coseismic slip vectors of the hanging wall relative to the foot wall using different scales,respectively.The white point in Fig.6d demonstrates the location of the relocated hypocenter of Lushan mainshock from Long et al.(2015). |
反演得到沿两个反倾断层F3和F4的同震滑动基本相当.其中,F3上的滑动主要分布在该断层NE段的中底部以及SW段的中上部,最大滑动量0.37 m位于N30.17°,E102.79°,深度10.89 km的子断层片上,滑动角为119.92°,平均滑动量0.20 m,平均滑动角117.23°.因此,反倾断层F3的同震滑动也是以逆冲为主,且伴有少量右滑分量(图 6c,6e).F4上的滑动则相对集中于该断层中段—NE段的中底部,最大滑动量0.40 m位于N30.29°,E102.95°,深度13.67 km的子断层片上,滑动角为97.98°,平均滑动量0.17 m,平均滑动角94.20°.因此,反倾断层F4的滑动基本为纯逆冲型(图 6b,6e).在构造地质学上,逆冲断层和反冲断层常会伴有次要的、不等量的走滑运动分量(Boyer and Elliott,1982;Cooley et al.,2011).因此,上述反演得到F1、F3和F4断层以逆冲运动为主、F3还伴有一定右滑分量的现象是符合构造地质学原理的.
F5作为当地的浅部滑脱面,其长期运动主要是调节深、浅部构造层运动的累积差异(由不同位置、不同时间的局部运动造成的累积差异).芦山7.0级地震主破裂发生在F5滑脱面下方的一个局部,因此F5断层面上的反演结果主要反映的是F5对下方局部的冲起构造(F1与F3之间)的同震运动的响应,最大滑动量为0.25 m,平均滑动量0.10 m,这种响应幅度相比下方其他断层的主动错动来说要小很多.由于受F1、F3的围限以及浅部构造层F5的阻挡,冲起构造整体上冲运动所引起的F5界面下方的水平响应主要表现为沿F5走向两端(NE向和SWW向)的少量扩散运动(图 6a,6e).类似于一管两端都开口的牙膏受到挤压,由于周围都被围限,牙膏容易从两端的开口朝相反的方向被挤出.当然,由于地壳介质的黏滞系数要大很多,沿F5底面的这种不同方向的响应性调节运动幅度要小得多,而且反演结果反映的是芦山地震同震引起的局部位置、特定时间的运动,因此可能与F5滑脱面上长期的累积运动特征不完全一致.
另外,基于F1+F3+F4+F5的断层模型,本研究反演得到芦山主震的矩震级为MW6.5,这与InSAR反演、USGS体波矩张量反演及部分地震波形反演获得的矩震级基本一致(刘云华等,2014;http://earthquake.usgs.gov/earthquakes/eqarchives/fm/neic_b000gcdd_fmt.php ;林向东等,2013;赵博等,2013).
5.2 讨论本文的反演表明:2013年四川芦山MS7.0级地震孕育并发生于震区基底由多条主要断层组成的隐伏逆冲断裂(或盲冲断裂)系统(图 2).主震时该系统的NW倾主断层F1以及SE倾的次级反冲断层F3与F4分别发生主、次量值的逆冲运动,造成它们之间的倒三角形冲起构造产生隆升运动(图 6b—6e).由于浅部构造层及其滑脱面F5的存在,沿F1、F3及F4等断层的同震逆冲破裂/错动虽无法继续向浅表扩展,但冲起构造的同震隆升导致F5界面上方的浅部构造层经受垂向挤压,引起一定量的位移与变形并传至地表.在这一过程中,F5界面对深、浅部构造层之间同震运动/变形的差异进行调节,表现为沿缓倾角但有起伏的F5界面底部其NE和SW段分别产生了NE和SWW向的水平扩散滑动(图 6a,6e).
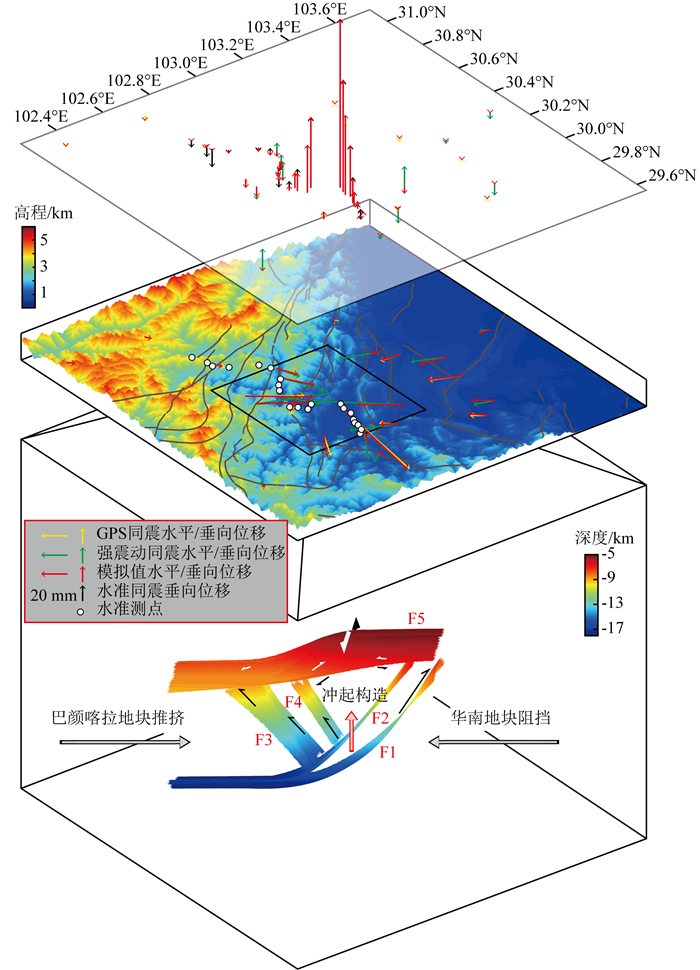
根据本文反演结果以及上述的分析讨论,我们将芦山地震的同震滑动/变形过程概括为图 7的模式,它可以很好解释为什么在芦山震区的地表没有产生明显的构造型地表破裂带(徐锡伟等,2013;李传友等,2013;张岳桥等,2013;雷生学等,2014),但GPS、强震观测和水准测量却能观测到显著的同震地表位移与形变(武艳强等,2013;Jiang et al.,2014;金明培等,2014;郝明等,2014).另外,由图 7的模式还可认识到:由于芦山地震的发震构造是相对复杂的基底盲冲断裂系统,且由于F5界面的存在以及它对基底与盖层之间同震运动/变形差异的调节作用,使得在震区地表通过GPS、强震观测及水准测量等得到的同震位移与形变并非是震源断层同震滑动的直接表现,而是经过“转换”的间接位移与变形.因此,GPS观测显示的芦山地震时地表沿NE向断层出现“同震左旋”运动(武艳强等,2013;Jiang et al.,2014)可能仅仅是一种“表象”.换句话说,本文基于F1+F3+F4+F5断层模型的反演结果(图 2,图 6)可在较大程度上解释芦山震区地表GPS观测的同震“左旋”走滑运动(武艳强等,2013;Jiang et al.,2014)与地震学观测的震源断层几乎纯逆冲运动(http://earthquake.usgs.gov/earthquakes/eqarchives/fm/neic_b000gcdd_wmt.php ;http://earthquake.usgs.gov/earthquakes/eqarchives/fm/neic_b000gcdd_fmt.php ;杜方等,2013;林向东等,2013;刘杰等,2013;吕坚等,2013;曾祥方等,2013;赵博等,2013;Han et al.,2014;Long et al.,2015)之间“矛盾”的原因.

|
图 7 芦山7.0级地震的发震构造与动力学模式示意图 断层面上的箭头示意相应的同震运动方式. Fig. 7 A schematic diagram of the seismogenic structure and dynamic model of the MS7.0 Lushan earthquake Arrows on faults surface denote corresponding coseismic kinematic pattern. |
基于重新定位的余震分布,结合地质及地球物理信息构建3D发震构造模型,同时采用GPS、水准、强震动三种地表观测资料进行约束,使我们能对2013年4月20日四川芦山MS7.0地震的同震滑动开展更细致的联合反演.结果反映芦山主震时龙门山断裂带南段盲冲断裂系统中的多条断层可能发生了不等量及不同方式的滑动.同震滑动主要分布在断层F1的断坡部分,F3和F4上也存在量级稍小的滑动.这3条断层的滑动以逆冲为主,其中F3还兼有右滑分量.浅部滑脱面F5及其上浅部构造层的存在限制了沿F1、F3及F4等断层同震破裂继续向上扩展,F5以扩散式的水平向滑动方式调节与转换来自下方3条断层及冲起构造的部分同震逆冲/隆升运动.同震运动的另一部分影响还穿过F5界面向上传递,造成浅部构造层和地表的同震运动/变形响应.尽管沿F2断层之上发生了很多小震级的余震,但主震发生在F1之上,且较大震级的余震主要分布在F1断面周围及F1和F2之间的区域内,F2断层在地震发生时可能并未出现明显的同震滑动.此外,本文模型反演的芦山地震矩震级为MW6.5,与已有的一些研究结果基本一致.总之,基于我们构建的F1+F3+F4+F5的芦山地震发震断层模型—复杂的基底盲冲断裂系统—本文的反演结果能够很好拟合三种地表同震位移/形变观测资料,解释这一MS7.0的地震为何未产生地表破裂,还能在一定程度上解释地表GPS观测的同震“左旋”运动表象与地震波观测获得的震源断层纯逆冲破裂之间的动力学关联性.
致谢金明培、龙锋高级工程师分别提供了强震仪同震位移及地震序列重新定位的数据;GPS、水准观测的同震位移数据分别来自Jiang等(2014)和郝明等(2014);两位审稿专家提出很好的意见与建议,在此一并致谢.
| Boncio P, Lavecchia G, Pace B. 2004. Defining a model of 3D seismogenic sources for seismic hazard assessment applications: The case of central Apennines(Italy). J.Seismol. , 8(3): 407–425. | |
| Boyer S E, Elliott D. 1982. Thrust systems. AAPG Bulletin , 66(9): 1196–1230. | |
| Burchfiel B C, Royden L H, van der Hilst R D, et al. 2008. A geological and geophysical context for the Wenchuan earthquake of 12 May 2008,Sichuan,People's Republic of China. GSA Today , 18(7): 4–11. | |
| Chen C, Xu Y. 2013. Relocation of the Lushan MS7.0 earthquake sequence and its tectonic implication. Chin.J.Geophys. , 56(12): 4028–4036. doi: 10.6038/cjg20131208. | |
| Cooley M A, Price R A, Dixon J M, et al. 2011. Along-strike variations and internal details of chevron-style,flexural-slip thrust-propagation folds within the southern Livingstone Range anticlinorium,a paleohydrocarbon reservoir in southern Alberta Foothills,Canada. AAPG Bulletin , 95(11): 1821–1849. | |
| Diao F Q, Xiong X, Wang R J. 2011. Mechanisms of transient postseismic deformation following the 2001 MW7.8 Kunlun(China)earthquake. Pure and Applied Geophysics , 168(5): 767–779. | |
| Du F, Long F, Ruan X, et al. 2013. The M7.0 Lushan earthquake and the relationship with the M8.0 Wenchuan earthquake in Sichuan,China. Chin.J.Geophys. , 56(5): 1772–1783. doi: 10.6038/cjg20130535. | |
| Fang L H, Wu J P, Wang W L, et al. 2013. Relocation of the mainshock and aftershock sequences of MS7.0 Sichuan Lushan earthquake. Chin.Sci.Bull. , 58(28-29): 3451–3459. doi: 10.1007/s11434-013-6000-2. | |
| Han L B, Zeng X F, Jiang C S, et al. 2014. Focal mechanisms of the 2013 MW 6.6 Lushan,China earthquake and high-resolution aftershock relocations. Seismol.Res.Lett. , 85(1): 8–14. | |
| Han Z J, Ren Z K, Wang H, et al. 2013. The surface rupture signs of the Lushan "4.20" MS 7.0 earthquake at Longmen township,Lushan county and its discussion. Seismology and Geology (in Chinese) , 35(2): 388–397. | |
| Hao J L, Ji C, Wang W M, et al. 2013. Rupture history of the 2013 MW6.6 Lushan earthquake constrained with local strong motion and teleseismic body and surface waves. Geophys.Res.Lett. , 40(20): 5371–5376. doi: 10.1002/2013GL056876. | |
| Hao M, Wang Q L, Liu L W, et al. 2014. Interseismic and coseismic displacements of the Lushan MS7.0 earthquake inferred from leveling measurements. Chin.Sci.Bull. , 59(35): 5129–5135. doi: 10.1007/s11434-014-0652-4. | |
| Jia D, Wei G Q, Chen Z X, et al. 2006. Longmen Shan fold-thrust belt and its relation to the western Sichuan Basin in central China: New insights from hydrocarbon exploration. AAPG Bulletin , 90(9): 1425–1447. | |
| Jiang Z S, Wang M, Wang Y Z, et al. 2014. GPS constrained coseismic source and slip distribution of the 2013 MW6.6 Lushan,China,earthquake and its tectonic implications. Geophys.Res.Lett. , 41(2): 407–413. | |
| Jin M P, Wang R J, Tu H W. 2014. Slip model and co-seismic displacement field derived from near-source strong motion records of the Lushan MS7.0 earthquake on 20 April 2013. Chin.J.Geophys. , 57(1): 129–137. doi: 10.6038/cjg20140112. | |
| Lei S X, Ran Y K, Wang H, et al. 2014. Discussion on whether there are coseismic surface ruptures of the Lushan MS7.0 earthquake at Longmen area and its implications. Seismology and Geology (in Chinese) , 36(1): 266–274. | |
| Lei X L, Ma S L, Su J R, et al. 2013. Inelastic triggering of the 2013 MW6.6 Lushan earthquake by the 2008 MW7.9 Wenchuan earthquake. Seismology and Geology (in Chinese) , 35(2): 411–422. | |
| Li C Y, Xu X W, Gan W J, et al. 2013. Seismogenic structures associated with the 20 April 2013 MS 7.0 Lushan earthquake,Sichuan province. Seismology and Geology (in Chinese) , 35(3): 671–683. | |
| Li Y, Zhou R J, Zhao G H, et al. 2013. Thrusting and detachment folding of Lushan earthquake in front of Longmenshan Moutains. Journal of Chengdu University of Technology(Science and Technology Edition) (in Chinese) , 40(4): 353–363. | |
| Li Y Q, Jia D, Wang M M, et al. 2014. Structural geometry of the source region for the 2013 MW6.6 Lushan earthquake: Implication for earthquake hazard assessment along the Longmen Shan. Earth and Planetary Science Letters , 390: 275–286. | |
| Lin X D, Ge H K, Xu P, et al. 2013. Near field full waveform inversion: Lushan magnitude 7.0 earthquake and its aftershock moment tensor. Chin.J.Geophys. , 56(12): 4037–4047. doi: 10.6038/cjg20131209. | |
| Liu C L, Zheng Y, Ge C, et al. 2013. Rupture process of the MS7.0 Lushan earthquake,2013. Science China Earth Sciences , 56(7): 1187–1192. doi: 10.1007/s11430-013-4639-9. | |
| Liu J, Yi G X, Zhang Z W, et al. 2013. Introduction to the Lushan,Sichuan M7.0 earthquake on 20 April 2013. Chin.J.Geophys. , 56(4): 1404–1407. doi: 10.6038/cjg20130434. | |
| Liu S, Zhang S M, Ding R, et al. 2015. Upper crustal folding of the 2013 Lushan earthquake area in southern Longmen Shan,China,insights from Late Quaternary fluvial terraces. Tectonophysics , 639: 99–108. | |
| Liu Y H, Wang C S, Shan X J, et al. 2014. Result of SAR differential interferometry for the co-seismic deformation and source parameter of the MS7.0 Lushan Earthquake. Chin.J.Geophys. , 57(8): 2495–2506. doi: 10.6038/cjg20140811. | |
| Long F, Wen X Z, Ruan X, et al. 2015. A more accurate relocation of the 2013 MS7.0 Lushan,Sichuan,China,earthquake sequence,and the seismogenic structure analysis. J.Seismol. , 19(3): 653–665. doi: 10.1007/s10950-015-9485-0. | |
| Lutter W J, Fuis G S, Ryberg T, et al. 2004. Upper crustal structure from the Santa Monica mountains to the Sierra Nevada,southern California: Tomographic results from the Los Angeles Regional Seismic Experiment,Phase II(LARSE II). Bull.Seismol.Soc.Amer. , 94(2): 619–632. | |
| Lü J, Wang X S, Su J R, et al. 2013. Hypocentral location and source mechanism of the MS7.0 Lushan earthquake sequence. Chin.J.Geophys. , 56(5): 1753–1763. doi: 10.6038/cjg20130533. | |
| Okada Y. 1992. Internal deformation due to shear and tensile faults in a half-space. Bull.Seismol.Soc.Amer. , 82(2): 1018–1040. | |
| Plesch A, Shaw J H, Benson C, et al. 2007. Community fault model(CFM)for southern California. Bull.Seismol.Soc.Amer. , 97(6): 1793–1802. doi: 10.1785/0120050211. | |
| Shaw J H, Shearer P M. 1999. An elusive blind-thrust fault beneath Metropolitan Los Angeles. Science , 283(5407): 1516–1518. | |
| Su J R, Zheng Y, Yang J S, et al. 2013. Accurate locating of the Lushan,Sichuan M7.0 earthquake on 20 April 2013 and its aftershocks and analysis of the seismogenic structure. Chin.J.Geophys. , 56(8): 2636–2644. doi: 10.6038/cjg20130813. | |
| Wang C Y, Han W B, Wu J P, et al. 2007. Crustal structure beneath the eastern margin of the Tibetan Plateau and its tectonic implications. J.Geophys.Res. , 112(B7). doi: 10.1029/2005JB003873. | |
| Wang L, Wang R, Roth F, et al. 2009. Afterslip and viscoelastic relaxation following the 1999 M7.4 İzmit earthquake from GPS measurements. Geophys.J.Int. , 178(3): 1220–1237. | |
| Wang R J, Parolai S, Ge M R, et al. 2013. The 2011 MW9.0 Tohoku Earthquake: Comparison of GPS and Strong-Motion Data. Bull.Seismol.Soc.Amer. , 103(2B): 1336–1347. | |
| Wang W F, Qing Y B, Zhu C H, et al. 2009. New viewpoints of the seismogenic mechanism of Wenchuan and Lushan earthquakes under the action of transverse fault. Journal of Earth Sciences and Environment (in Chinese) , 36(3): 102–112. | |
| Wang W M, Hao J L, Yao Z X. 2013. .Preliminary result for rupture process of Apr.20,2013,Lushan Earthquake,Sichuan,China. Chin.J.Geophys. , 56(4): 1412–1417. doi: 10.6038/cjg20130436. | |
| Wang X L, Ma S L, Guo Z, et al. 2013. S-wave velocity of the crust in Three Gorges Reservoir and the adjacent region inverted from seismic ambient noise tomography. Chin.J.Geophys. , 56(12): 4113–4124. doi: 10.6038/cjg20131216. | |
| Wang Z, Huang R Q, Pei S P. 2014. Crustal deformation along the Longmen-Shan fault zone and its implications for seismogenesis. Tectonophysics , 610: 128–137. | |
| Wells D L, Coppersmith K J. 1994. New empirical relationships among magnitude,rupture length,rupture width,rupture area,and surface displacement. Bull.Seismol.Soc.Amer. , 84(4): 974–1002. | |
| Wu Y Q, Jiang Z S, Wang M, et al. 2013. Preliminary results pertaining to coseismic displacement and preseismic strain accumulation of the Lushan MS7.0 earthquake,as reflected by GPS surveying. Chin.Sci.Bull. , 58(28-29): 3460–3466. doi: 10.1007/s11434-013-5998-5. | |
| Xu C J, Liu Y, Wen Y M, et al. 2010a. Coseismic slip distribution of the 2008 MW7.9 Wenchuan earthquake from joint inversion of GPS and InSAR data. Bull.Seismol.Soc.Amer. , 100(5B): 2736–2749. | |
| Xu X W, Wen X Z, Han Z J, et al. 2013. Lushan MS7.0 earthquake: A blind reserve-fault event. Chin.Sci.Bull. , 58(28-29): 3437–3443. doi: 10.1007/s11434-013-5999-4. | |
| Xu Y, Li Z W, Huang R Q, et al. 2010b. Seismic structure of the Longmen Shan region from S-wave tomography and its relationship with the Wenchuan MS8.0 earthquake on 12 May 2008,southwestern China. Geophys.Res.Lett. , 37(2). doi: 10.1029/2009GL041835. | |
| Zeng X F, Luo Y, Han L B, et al. 2013. The Lushan MS7.0 earthquake on 20 April 2013: A high-angle thrust event. Chin.J.Geophys. , 56(4): 1418–1424. doi: 10.6038/cjg20130437. | |
| Zhan Y, Zhao G Z, Unsworth M, et al. 2013. Deep structure beneath the southwestern section of the Longmenshan fault zone and seimogenetic context of the 4.20 Lushan MS7.0 earthquake.Chin.Sci.Bull.,58(28-29): 3467-3474,doi: 10.1007/s11434-013-6013-x. Chin.Sci.Bull. , 58(28-29): 3467–3474. doi: 10.1007/s11434-013-6013-x. | |
| Zhang G H, Qu C Y, Shan X J, et al. 2011. Slip distribution of the 2008 Wenchuan MS7.9 earthquake by joint inversion from GPS and InSAR measurements: a resolution test study. Geophys.J.Int. , 186(1): 207–220. | |
| Zhang Y, Xu L S, Chen Y T. 2013. Rupture process of the Lushan 4.20 earthquake and preliminary analysis on the disaster-causing mechanism. Chin.J.Geophys. , 56(4): 1408–1411. doi: 10.6038/cjg20130435. | |
| Zhang Y, Wang R J, Chen Y T, et al. 2014. Kinematic rupture model and hypocenter relocation of the 2013 MW6.6 Lushan earthquake constrained by strong-motion and teleseismic data. Seismol.Res.Lett. , 85(1): 15–22. | |
| Zhang Y Q, Dong S W, Hou C T, et al. 2013. Preliminary study on the seismotectonics of the 2013 Lushan MS7.0 earthquake,west Sichuan. Acta Geologica Sinica (in Chinese) , 87(6): 747–758. | |
| Zhao B, Gao Y, Huang Z B, et al. 2013. Double difference relocation,focal mechanism and stress inversion of Lushan MS7.0 earthquake sequence. Chin.J.Geophys. , 56(10): 3385–3395. doi: 10.6038/cjg20131014. | |
| Zhao C P, Zhou L Q, Chen Z L. 2013. Source rupture process of Lushan MS7.0 earthquake,Sichuan,China and its tectonic implications. Chin.Sci.Bull. , 58(28-29): 3444–3450. doi: 10.1007/s11434-013-6017-6. | |
| Zheng Y, Ge C, Xie Z J, et al. 2013. Crustal and upper mantle structure and the deep seismogenic environment in the source regions of the Lushan earthquake and the Wenchuan earthquake. Science China Earth Sciences , 56(7): 1158–1168. doi: 10.1007/s11430-013-4641-2. | |
| 陈晨, 胥颐. 2013. 芦山MS7.0级地震余震序列重新定位及构造意义. 地球物理学报 , 56(12): 4028–4036. | |
| 杜方, 龙锋, 阮祥, 等. 2013. 四川芦山7.0级地震及其与汶川8.0级地震的关系. 地球物理学报 , 56(5): 1772–1783. | |
| 房立华, 吴建平, 王未来, 等. 2013. 四川芦山MS7.0级地震及其余震序列重定位. 科学通报 , 58(20): 1901–1909. | |
| 韩竹军, 任治坤, 王虎, 等. 2013. 芦山县龙门乡芦山"4.20"7.0级强烈地震地表破裂迹象与讨论. 地震地质 , 35(2): 388–397. | |
| 郝明, 王庆良, 刘立炜, 等. 2014. 基于水准数据的芦山7.0级地震震间期和同震位移场特征. 科学通报 , 59(36): 3631–3636. | |
| 金明培, 汪荣江, 屠泓为. 2014. 芦山7级地震的同震位移估计和震源滑动模型反演尝试. 地球物理学报 , 57(1): 129–137. | |
| 雷生学, 冉勇康, 王虎, 等. 2014. 关于芦山7.0级地震在龙门一带是否存在同震地表破裂的讨论. 地震地质 , 36(1): 266–274. | |
| 雷兴林, 马胜利, 苏金蓉, 等. 2013. 汶川地震后中下地壳及上地幔的粘弹性效应引起的应力变化与芦山地震的发生机制. 地震地质 , 35(2): 411–422. | |
| 李传友, 徐锡伟, 甘卫军, 等. 2013. 四川省芦山MS7.0地震发震构造分析. 地震地质 , 35(3): 671–683. | |
| 李勇, 周荣军, 赵国华, 等. 2013. 龙门山前缘的芦山地震与逆冲-滑脱褶皱作用. 成都理工大学学报(自然科学版) , 40(4): 353–363. | |
| 林向东, 葛洪魁, 徐平, 等. 2013. 近场全波形反演:芦山7.0级地震及余震矩张量解. 地球物理学报 , 56(12): 4037–4047. | |
| 刘成利, 郑勇, 葛粲, 等. 2013. 2013年芦山7.0级地震的动态破裂过程. 中国科学:地球科学 , 43(6): 1020–1026. | |
| 刘杰, 易桂喜, 张致伟, 等. 2013. 2013年4月20日四川芦山M7.0级地震介绍. 地球物理学报 , 56(4): 1404–1407. | |
| 刘云华, 汪驰升, 单新建, 等. 2014. 芦山MS7.0级地震InSAR形变观测及震源参数反演. 地球物理学报 , 57(8): 2495–2506. | |
| 吕坚, 王晓山, 苏金蓉, 等. 2013. 芦山7.0级地震序列的震源位置与震源机制解特征. 地球物理学报 , 56(5): 1753–1763. | |
| 苏金蓉, 郑钰, 杨建思, 等. 2013. 2013年4月20日四川芦山M7.0级地震与余震精确定位及发震构造初探. 地球物理学报 , 56(8): 2636–2644. | |
| 王伟锋, 卿艳彬, 朱传华, 等. 2014. 横断层作用下汶川地震与芦山地震发震机制新探. 地球科学与环境学报 , 36(3): 102–112. | |
| 王卫民, 郝金来, 姚振兴. 2013. 2013年4月20日四川芦山地震震源破裂过程反演初步结果. 地球物理学报 , 56(4): 1412–1417. | |
| 王小龙, 马胜利, 郭志, 等. 2013. 利用地震背景噪声成像技术反演三峡库区及邻近地区地壳剪切波速度结构. 地球物理学报 , 56(12): 4113–4124. | |
| 武艳强, 江在森, 王敏, 等. 2013. GPS监测的芦山7.0级地震前应变积累及同震位移场初步结果. 科学通报 , 58(20): 1910–1916. | |
| 徐锡伟, 闻学泽, 韩竹军, 等. 2013. 四川芦山7.0级强震:一次典型的盲逆断层型地震. 科学通报 , 58(20): 1887–1893. | |
| 曾祥方, 罗艳, 韩立波, 等. 2013. 2013年4月20日四川芦山MS7.0地震:一个高角度逆冲地震. 地球物理学报 , 56(4): 1418–1424. | |
| 詹艳, 赵国泽, UnsworthM, 等. 2013. 龙门山断裂带西南段4.20芦山7.0级地震区的深部结构和孕震环境. 科学通报 , 58(20): 1917–1924. | |
| 张勇, 许力生, 陈运泰. 2013. 芦山4.20地震破裂过程及其致灾特征初步分析. 地球物理学报 , 56(4): 1408–1411. | |
| 张岳桥, 董树文, 侯春堂, 等. 2013. 四川芦山2013年MS7.0地震发震构造初步研究. 地质学报 , 87(6): 747–758. | |
| 赵博, 高原, 黄志斌, 等. 2013. 四川芦山MS7.0地震余震序列双差定位、震源机制及应力场反演. 地球物理学报 , 56(10): 3385–3395. | |
| 赵翠萍, 周连庆, 陈章立. 2013. 2013年四川芦山MS7.0级地震震源破裂过程及其构造意义. 科学通报 , 58(20): 1894–1900. | |
| 郑勇, 葛粲, 谢祖军, 等. 2013. 芦山与汶川地震震区地壳上地幔结构及深部孕震环境. 中国科学:地球科学 , 43(6): 1027–1037. | |
 2016, Vol. 59

